Retired Document
Important: This document may not represent best practices for current development. Links to downloads and other resources may no longer be valid.
Advanced Profiling Control
Although the Start button makes starting and stopping Shark quite simple, sometimes it can be impractical, or even impossible to use. For example, how can you press the start button on a headless server? Profiling application launch can be hard to accomplish by hand as well. And what if you are only interested in profiling one particular “hot” loop, buried somewhere deep within your application?
This section discusses various advanced ways to control what Shark profiles, when it profiles, and how the resulting profile relates to your target execution.
Process Attach
It’s not always beneficial to profile the entire system — often there is just too much information. For this reason, Shark allows you to target any process in the system individually, further focusing your profile. In this mode, Shark will only save samples from the target process, while discarding any others.
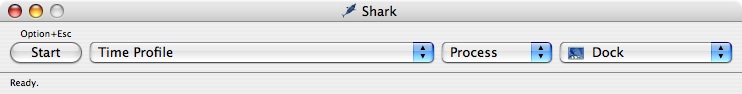
When you enter this mode by selecting Process from the Target popup in Shark’s main window(or use Command-2), the Shark window will expand, adding a new popup — the Process List, as we show in Figure 5-1. By default, the Process List is sorted by process name, and you will only see processes that you own. To change these defaults, open the preferences by selecting the Shark→Preferences menu item (Command-Comma) and adjust the values for the Process List under the “Appearance” tab Shark Preferences.
Process Launch
Attempting to profile launch times for your application by hand can be a frustrating endeavor. Profiling an application (or part of one) that only runs for a short time can be similarly difficult. For this reason, Shark allows you to launch your application directly, from within Shark. To instruct Shark to launch your process, enter Process Attach mode, by selecting Process from the Target popup (Command-2). Now, select the “Launch...” target from the top of the process list (or use Command-Shift-L). Choosing this “process” and then pressing “Start” will bring up the Process Launch Panel, shown below in Figure 5-2.
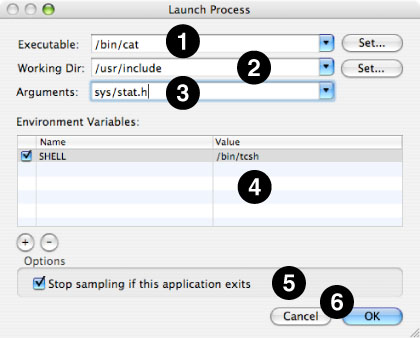
Once the Process Launch Panel has appeared, you need to “fill in the blanks” in order to tell Shark how to launch your application. If you reach here by choosing Debug→Launch Using Performance Tool→Shark in Xcode, most of these blanks will be completed for you. At the very least, you must choose an executable file before pressing “OK” and continuing. However, you can also supply many other bits of information to Shark in order to simulate the launching of your application from a command-line shell prompt, and specify a couple of options to help limit capture of spurious samples.
Executable— The full path to the executable. You can either type it here or press the “Set...” button and then find it using a normal Mac “Open File...” dialog box. For Mac applications, you can set this to be either the entire application or the core binary file inside of it.
Working Dir— The full path to the working directory that the application will start using. By default, this is the path where the executable is located, but you may point it anywhere else that you like. When the application is executed, it will appear to have been started from a shell that had this directory as its working directory (i.e. the output of
pwd) just before executing the command. Hence, relative paths to data files will start being determined from this directory.Arguments— Enter any arguments here that you would have normally entered onto your shell command line after the name of the executable. Shark will feed them into the application just as if they had come from a normal shell. Note that since Shark’s “shell” does not have any text I/O, you will need to provide
< stdin.txtand> stdout.txtredirection operations here if your executable expects to usestdinand/orstdout“files.”Environment Variables— Supply any environment variables that must be set before your application starts in this table. Otherwise, Shark will start your application with no environment variables set (it even clears out any “defaults” that you may have had before invoking Shark). Pressing the “+” and “–” buttons below the table allows you to add or remove environment variables, respectively. Once added, you can freely edit the names of the variables and their value in the appropriate table cells.
Stop sampling if this application exits— If checked, Shark stops sampling immediately after your application completes. Hence, this will prevent Shark from capturing a bunch of samples that have nothing to do with your application if it completes quickly.
Cancel & OK— Shark will start your application and sample it immediately after you hit OK. If you change your mind, Cancel will return you back to the main Shark window.
Batch Mode
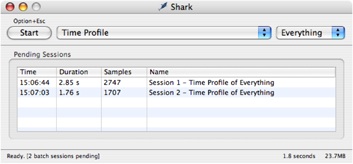
Batch mode queues up any sessions recorded without displaying them. Pending sessions are listed in the main Shark window. Batch mode allows multiple sessions to be recorded in quick succession, by not immediately incurring the overhead of displaying the viewers for each session. To enter Batch Mode, select the Sampling→Batch Modemenu item (or Command-Shift-B).
Batch mode is most useful when paired with remote control from within your application’s code, profiling multiple hot loops in quick succession, during a single program execution. Using a different session label for each loop, you can rapidly obtain multiple profiles for later investigation. See Performance Counter Spreadsheet Advanced Settings for information on using this technique.
Windowed Time Facility (WTF)
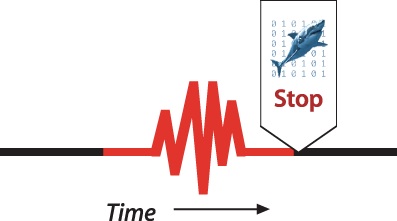
For measuring hard to repeat scenarios, Shark provides the Windowed Time Facility (abbreviated as WTF) with the Time Profile and System Trace configurations. The Windowed Time Facility directs Shark to only record and process a finite buffer of the most recently acquired samples, allowing it to run continuously for long periods of time in the background. This continuous behavior allows you to stop profiling just after something interesting occurs. At this point, Shark processes the samples in the window of time just before profiling was terminated. This allows you to determine what part of your program’s execution is “interesting” after it occurs, instead of trying to anticipate it in advance. Now, you effectively have the benefit of hindsight for finding hard to repeat problems.
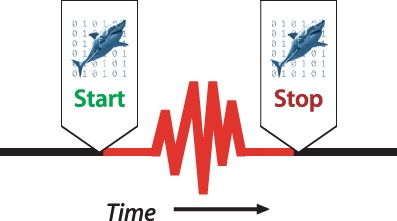
Another way of describing how WTF mode works is how it modifies Shark’s normal “start” and “stop” behavior. Generally, Shark processes all the data between the “start” and “stop” trigger events, as is shown in Figure 5-4. Most commonly, users start Shark just before entering an “interesting” period of execution and stop it when leaving the area of interest. However, you may not always know when you will encounter the “interesting” region of your program in advance. WTF mode sidesteps this problem by eliminating the need to “start” normally. While Shark stops in the normal way, as we show in Figure 5-5, the starting position is just a fixed number of samples (or effectively amount of time, with Time Profiling) before the end, instead of at a user-specified point.
Tracing the execution around an asynchronous event, such as inter-thread communication, the arrival of a network packet, or OS event such as a page fault, are all situations when WTF mode can make profiling easier, especially when these “glitches” occur at hard-to-predict times.
This mode of profiling is especially useful for game programming; often, the timing of calls to performance-critical code regions is highly dependent upon a player’s actions, which can be hard to reproduce. For example, assume you are developing a video game engine and occasionally see the frame rate drop and/or video glitches. If the conditions for causing the glitch are unpredictable and inconsistent, then you would normally have to start sampling, attempt to reproduce the problem, and then stop sampling afterwards. If the glitch is rare, then odds will be low that you will catch the glitch within the limited sampling window, creating an extremely frustrating workflow. With WTF mode, in contrast, you can just start Shark and forget about it — until the glitch actually occurs, when a quick press of the “stop” button will capture the sequence of samples involving the glitch.
WTF mode can be enabled in several different ways. In order of increasing complexity, it can be turned on through any of the following three options:
You can select the Time Profile and System Trace configurations with “WTF” included in the name from the Configuration popup (see Main Window).
WTF is an option for the “normal” Time Profile and System Trace configurations which may be enabled by checking the “WTF Mode” check boxes in the mini-configuration editors associated with these configurations (see Taking a Time Profile and Basic Usage).
You may include this option in your own configurations that use the “Timed Samples & Counters” or “System Trace” data source plugins (see Simple Timed Samples and Counters Config Editor and System Trace Data Source PlugIn Editor).
In addition, WTF mode works perfectly well with all of the different ways to effectively press “start” and “stop” described in this chapter. For example, instead of manually pressing “stop” at the end of your WTF region, you might have code in your program detect “glitch” conditions and programmatically fire a “stop” signal using the techniques described in Programmatic Control.
WTF with System Trace
In most ways, WTF mode functions exactly the same when used with both the Time Profile and System Trace configurations. However, there are two notable differences.
First, since System Trace is event-driven, and not time interval-driven, the “window” is actually a fixed number of system events per processor, and not a fixed window of time. Therefore, the actual period of time represented by the window is highly dependent on the rate that system events occur for each processor. If these events occur very rapidly, the window might be quite short in time; if these events occur infrequently, the window might represent a long interval.
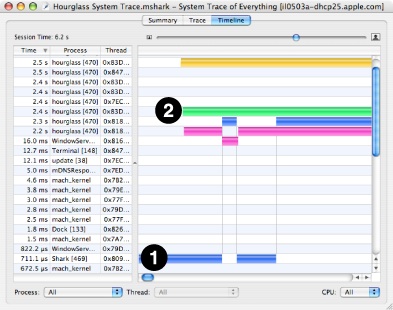
Second, the beginning of a WTF System Trace Timeline (see Figure 5-6) can appear a bit strange; different processors might first appear at vastly different points in the timeline. In the figure below, the timeline for the processor at (1) begins well before the other three processor timelines at (2). This occurs because each processor maintains its own “window” of samples, and system events can occur at vastly different rates on each processor. As a result, each processor’s window of samples can correspond to different periods of time. Since all processors’ timelines end at the same time, the effect of this is that some processors won’t show up in the timeline until much later than other processors.
Unresponsive Application Measurements
During the development process, there may come a point where your application goes unresponsive, and the dreaded spinning rainbow cursor is displayed (![]() ). Often, the situations in which this happens can be hard to repeat. For these situations, Shark provides Unresponsive Application Triggering, allowing you to automatically sample whenever an application becomes unresponsive. This method of triggering is enabled by selecting the Sampling→Unresponsive Applications menu item (Command-Shift-A). When Unresponsive Application Triggering is enabled, Shark will automatically switch to Batch Mode and display unresponsive application triggering options, as shown below.
). Often, the situations in which this happens can be hard to repeat. For these situations, Shark provides Unresponsive Application Triggering, allowing you to automatically sample whenever an application becomes unresponsive. This method of triggering is enabled by selecting the Sampling→Unresponsive Applications menu item (Command-Shift-A). When Unresponsive Application Triggering is enabled, Shark will automatically switch to Batch Mode and display unresponsive application triggering options, as shown below.
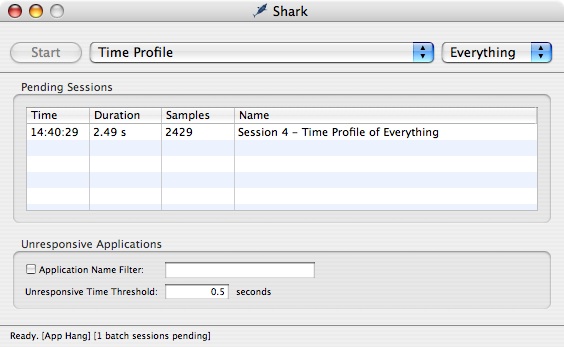
Unresponsive application profiling can be limited to a single application by setting the Application Name Filter check box and filling in a name or partial name in the associated text field. The threshold for the amount of time an application is unresponsive (does not respond to mouse or keyboard events) can be set by entering a value (in seconds) in the Unresponsive Time Threshold text field. With this, you can eliminate sampling of expected, brief bits of unresponsive time and focus instead on the really long and painful occurrences.
Command Line Shark
In some situations, such as profiling on headless servers, it is not possible to use the graphical user interface at all. For these cases, use /usr/bin/shark. Command line shark supports the major features of its graphical counterpart for data collection, but does not do much with the recorded data beyond saving sessions. In general, it is intended that you use it to collect sessions and then review your results with a graphical copy of Shark later. This section will discuss some common ways to use command line shark. A more complete description of the options available when using command line shark is available in its man page, shark(1).
Basic Methodology
There are four main ways to use command-line shark. With the exception of network mode, which can run along with interactive and remote modes, any one invocation of shark is locked into using only one of these modes for its entire duration.
Interactive Mode
By default, command-line shark works in a simple interactive mode. After starting up, it records sessions on demand through a simple, three-step process:
sharkwaits in the background until it spots a “hot key” press, and then it starts sampling. On your local system, the hot key same as graphical Shark (Option-Escape, by default), while on remote terminals it defaults to Control-\, since this key combination can be transmitted through a generic terminal.When you press the same “hot key” again,
sharkwill stop sampling and begin analyzing its samples to produce a standard Shark session file. It displays progress as this occurs, and then writes out the session file to disk, using the namesession_XX.mshark(XX = a number) and the current terminal directory by default. When complete, shark waits for another “hot key” press.If you press Control-c instead of a “hot key,” then
sharkwill terminate and return you to the shell prompt.
After shark completes, you will have a sequence of Shark session files that you may then examine at your leisure with graphical Shark. Of course, there are many ways to modify this basic methodology, described in the next few sections.
Immediate Mode
Command line shark also supports immediate mode, where it starts sampling immediately after it is launched with no user interaction, and quits after it finishes profiling — usually after 30 seconds, or when the user presses Control-C. This is often useful for invocation from shell scripts. To launch shark in this mode, use the -i option, as follows:
shark -i |
Remote Mode
A third way to use command line shark is remote mode, which works much like the remote mode supported by graphical Shark and described in Interprocess Remote Control. Once started in this mode, shark will wait for start/stop signals from other processes to arrive in any one of three ways:
A program instrumented with
chudStartRemotePerfMonitor()andchudStopRemotePerfMonitor()calls can start and stopshark, respectively. This works the same as the equivalent functionality described in Programmatic Control.The utility program
chudRemoteCtrlcan start and stopshark. This works the same as the equivalent functionality described in Command Line Remote Control.The UNIX
SIGUSR1andSIGUSR2signals can be sent toshark’s PID by your program or the UNIXkillutility with the “-s USR1” and “-s USR2” options. It will interpretSIGUSR1as a start/stop toggle andSIGUSR2as a command to stop sampling and generate a session.
To launch shark in this mode, use the -r option, as follows:
shark -r |
Network Mode
Finally, command line shark supports network mode, where it is controlled remotely by graphical Shark running on another computer. When enabled, shark starts up in interactive (or remote) mode, and works normally that way. However, it also listens for network connections from graphical Shark running on different Macintoshes. You can then use a combination of local start/stop operations and network start/stop operations while shark is running. To launch shark in this mode, use the -N option, as follows:
shark -N |
A full description of network shark usage is in Network/iPhone Profiling.
Common Options
Many of Shark’s configurations, such as Time Profile and System Trace, support common options such as time and sample limits. Command line shark allows you to change these limits for configurations that support them. These common options include:
Time Limit—
shark -Tallows you to change the time limit. Valid times are any integer followed by “u,” “m,” or “s,” corresponding to microseconds, milliseconds, and seconds, respectively.Time Interval —
shark -Iallows you to change the sampling interval for configurations that support a sampling interval. Valid times are entered the same way as for time limits.Sample Limit —
shark -Sallows you to specify the maximum number of samples to record during each session.
Some other, less commonly used options change the behavior of shark:
Quiet Mode—
shark -qwill limit terminal output to reporting of errors only.Ignore task exits—
shark -xwill instruct shark to ignore task exit notifications. Normally, shark gets notified when tasks are about to exit while it is profiling. This allows shark to collect some basic information about the task just before it is allowed to quit. It is possible, though not likely, that this can cause gaps in profiling. Use of this option is discouraged. This is equivalent to the use of the similarly named preference in Shark Preferences.Change default filename—
shark -oallows you to change the default session file name fromsession_XX.msharkto a user supplied name. This name will be appended with a unique number to create a unique file name. For example,shark -o myfilewill result in session files namesmyfile_01.mshark,myfile_02.mshark, and so on.Change session file path—
shark -dallows you to specify the directory where shark will save session files, instead of the current working directory.
Target Selection
With command line shark, you can choose to launch and attach shark to a process, or attach shark to a currently running process, using options similar to the ones described previously in Process Attach and Process Launch for graphical Shark. To launch a process, simply append the process invocation as you normally would to the end of the shark command line. The following example would launch /bin/ls ~/Documents, and start shark profiling immediately:
shark -i /bin/ls ~/Documents |
Instead, if you wanted to attach to a running Apache daemon process, you might try this line:
shark -i -a [pid of httpd] |
Making things even simpler, if you do not know the PID of the process in which you are interested, you can specify a full or partial name as the argument to the -a option. If there are multiple matches to a partial name, Shark will take its best guess. For these situations, it is often best to supply a PID instead.
Reports
Command line shark supports generation of textual reports, either from session files that you’ve already created, or from new sessions as they are generated. These reports can be simple summaries (-g or -G options), or complete analysis reports (-t option).
When creating a summary report, you can either create one from a session that is already saved on disk, with shark -g, or create it for new sessions, with shark -G. Both options result in the creation of a sidecar file, whose name will be the original session file name with -report.txt appended.
Creating a full analysis, either from previously saved sessions, or for any new sessions, requires passing the -t flag to shark. The -t flag optionally takes a filename as an argument. If no file name is specified, shark will allow you to take sessions as normal, except it will write one additional file per session — the full analysis report. If you specify a file name, shark will instead only generate the full analysis report sidecar file, and immediately quit. In both cases, the report filename will be the session file name, with -full.txt appended.
Custom Configurations
Because of its command line nature, shark can only operate on configurations already created by its graphical counter-part as discussed in Custom Configurations. To use a custom configuration on a headless server, export it from Shark by opening the Configuration Editor, selecting the desired Configuration, and clicking the “Export...” button in the Configuration Editor (as described in The Config Editor). Copy the resulting .cfg file to ~/Library/Application Support/Shark/Configs on the target machine so that command-line shark can find it.
Running shark -l will list all installed configurations, including any custom configurations (which will be near the bottom of the list). Using a capital -L instead will additionally list a short summary of what each configuration does, what plugins are active with each one, and their settings.
Instruct shark to use your custom config by passing its corresponding number to the -c argument. For example, if your new configuration was listed as number 13, you might use the following command line to load that configuration into command line shark:
shark -c 13 |
Alternatively, you can specify the configuration file to use directly, using -m:
shark -m custom.cfg |
For more information on creating and using custom profiling configurations, see Custom Configurations.
More Information
This section has presented some of the most common options and techniques for using command-line shark. For more detailed information on all available options, please read the man page: shark(1).
Interprocess Remote Control
In some cases, it is best to have your programs start and stop Shark’s sampling at precisely chosen points in their execution. Shark supports two major forms of start/stop “remote control” from other processes: programmatic control allows you to insert code directly into your application to start and stop profiling, while command line remote control allows you to insert commands in your perl or shell scripts to start and stop profiling. In order for a remote client to activate Shark, Shark must first be placed in remote mode using the Shark→Sampling→Programmatic (Remote) menu item. Similarly, you can use shark -r to start command line shark in remote mode (as mentioned in Remote Mode).
Programmatic Control
It may be useful to narrow down what is profiled by Shark to a particular section of code within your application. You can start and stop sampling from within your application’s code by calling the chudStartRemotePerfMonitor() and chudStopRemotePerfMonitor() functions, defined in the CHUD.framework. This can be accomplished in one of two ways:
Remote Profiling— instrument your code with calls to
chudStartRemotePerfMonitor()/chudStopRemotePerfMonitor(). Shark should then be placed in remote monitoring mode via the Sampling➝Programmatic (Remote) menu item (Command-Shift-R) before running your instrumented program. For every pair of start/stop calls, Shark will create a new sampling session. This can be especially useful with Adding Shortcut Equations.Thread Marking— When using Hardware Performance Counters on a PowerPC machine, as discussed in Hardware Counter Configuration, you can use
chudMarkPID()to mark your process orchudMarkCurrentThread()to mark the current thread around your critical sections of code. If you configure Shark to sample only marked performance events, only code in the critical sections will be profiled.
It is important to keep in mind that many profiling techniques used by Shark employ statistical sampling in order to generate a profile. If the sampling interval is longer than the time it takes to execute the instrumented section of code, you may see few or no samples in the resulting profile. Statistical sampling is most useful when at least several hundred samples are taken.
Example: Towers of Hanoi
We will use the Towers of Hanoi puzzle as an example of controlling Shark from within source code. The French mathematician Edouard Lucas invented the Towers of Hanoi puzzle in 1883 . The puzzle begins with a tower of N disks, initially stacked in decreasing size on one of three pegs. The goal is to transfer the entire tower to one of the other pegs, moving only one disk at a time and never a larger one onto a smaller one. A common solution to the Towers of Hanoi problem is a recursive algorithm (see Listing 5-1, below).
Listing 5-1 Towers of Hanoi Source Code
/* This functions takes a tower of n disks and moves from peg */ |
/* 'source' to peg 'destination'. Peg 'temp' may be used */ |
/* temporarily. */ |
void Hanoi(char source, char temp, char destination, int n){ |
if(n>0) { |
Hanoi (source, destination, temp, n-1); |
Hanoi (temp, source, destination, n-1); |
} |
} |
As a demonstration of source code instrumentation, we insert calls to start and stop Shark into the Towers of Hanoi test program (see Listing 5-2, below). Shark is then placed in Remote Monitoring mode and set to use the standard Time Profile configuration. The test program is run for N=10..20 disks. Shark records a session for each pair of start and stop calls.
Listing 5-2 Instrumented Towers of Hanoi
#include <CHUD/CHUD.h> |
chudInitialize(); |
chudAcquireRemoteAccess(); |
for(i=n_min; i<=n_max; i++) { |
sprintf(label_str, "Hanoi #%d", i); |
chudStartRemotePerfMonitor(label_str); |
Hanoi('A','B','C',i); |
chudStopRemotePerfMonitor(); |
} |
chudReleaseRemoteAccess(); |
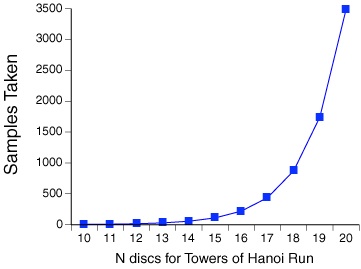
The Towers of Hanoi test program demonstrates the need for a sampling interval that is much shorter than the time between the calls to start and stop Shark (see Figure 5-8). Less than 100 samples are taken unless the problem size is at least 15 disks. As a result, you will often find that it is better to sample your entire application and use Shark’s powerful Data Mining mechanisms to narrow down what is displayed after sampling.
Command Line Remote Control
You can also start sampling remotely through the command-line using the chudRemoteCtrl command-line tool. Again, in order for remote clients to activate Shark, Shark must first be placed in remote mode using the Shark→Sampling→Programmatic (Remote) menu item.
To start profiling from within your shell scripts (or by hand), issue the following command:
chudRemoteCtrl -s MySessionLabel |
The argument to -s, above, is an arbitrary, user-specified label that will be applied to the generated session. To stop profiling, issue the following command:
chudRemoteCtrl -e |
When used to stop profiling, chudRemoteCtrl will not return until Shark has stopped profiling. In the case of command-line shark, chudRemoteCtrl will not exit until the session file is written to disk. More information on chudRemoteCtrl is available from its man page, chudRemoteCtrl(1).
Network/iPhone Profiling
Shark allows you to share computers for profiling over a network and to discover other computers sharing their copies of Shark using Bonjour or manual IP address entry. This allows you to record profiles on two separate Macs on your desk (good for fullscreen application profiling), Macs in another room (useful when you are profiling servers), or even Macs halfway around the world (for travelers).
In addition, the same user interface can be used to control Shark running on any iPhone (or other device that runs the iOS, such as the iPod Touch). Shark is included by default in the iOS developer tools, so once they are installed onto your device it can be controlled by Shark running on any Mac simply by docking the device and attaching the dock to one of the Mac’s USB ports.
To use Network Profiling, select the Shark→Sampling→Network/iPhone Profiling... menu item (Command-Shift-N), and the main window will expand to show the Network/iPhone Manager pane below the main controls, as shown in Figure 5-9.
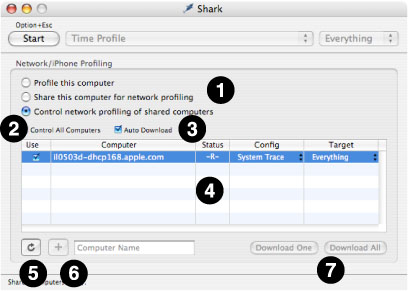
The controls in this window are described below:
Modes of Operation— Choose the overall network operation mode here:
Profile this computer— Profile the system that is running this instance of Shark; this is the “normal” way of running Shark, and effectively disables Network/iPhone Mode.
Share this computer for network profiling— Shark will advertise itself as a shared profiling service to networked computers. In this shared profiling mode, the user interface for starting and stopping profiling on the local machine is disabled.
Control network profiling of shared computers— Any computers on the network (in the local domain) running Shark in “shared” network mode will automatically be listed as available for control by this instance of Shark. In addition, all iOS devices in docks attached directly to this computer will also appear as “shared computers” if they have Shark installed (because it cannot be controlled directly on the device, Shark is automatically started in “shared” mode on these devices when necessary). In “Control” mode, clicking on Shark’s Start button triggers profiling on the selected shared computer(s). “Distant” computers that are outside of the local network domain can be added to the list of controlled computers by entering the computer’s network name in the field below the shared computer table and clicking the Add (+) button.
Control All Computers checkbox— When selected, all of the currently listed shared computers will be automatically selected for control. Any new computers that become available in the list (either by Bonjour auto-discovery or by being manually added by name to the table) will be automatically selected for control, as well. All computers will start and stop sampling together, at approximately the same time. Additionally, changing the config or target of any shared computer causes all the controlled computers’ settings to change to the same setting, if it is available. This option is very useful when you are attempting to control a large cluster of identical computers.
Auto Download checkbox— When selected, the shared computers controlled by this copy of Shark will automatically deliver sessions to the the controller. The name of the system that generated each session is included in the title of each session document window. Otherwise, the sessions will be saved locally on the controlled machines for later download. This can be a better policy if you are taking many sessions in quick succession, and network bandwidth becomes a limiting factor or impacts your measurements adversely.
Computer table— This is the list of all the Macs running the Shark application in shared profiling mode and attached iOS devices. These computers can be selected for profiling control by this Shark application. Columns are discussed in the order they are presented onscreen, left-to-right:
Use— Toggles whether or not to control Shark on a shared computer.
Computer— The name of each shared computer
Status— This shows the current “state” of Shark running on the remote system. There are several different possible states of a shared computer running Shark in network mode:
Unknown (–?–): Computer is not connected.
Ready (–R–): Shark can start sampling.
Sampling (–S–): Shark is actively collecting profile data.
Processing (–P–): Shark is creating a profile session.
Transmitting (–T–): The new session is being sent.
Config— The currently active Sampling Configuration on the shared computer. The entries in this column are menus, just like the one in Shark’s main window (see Main Window). The selected configuration on the remote shared computer can be changed by changing the selection in the menu
Target— The currently active Profiling Target on the shared computer. The entries in this column are menus, just like the one in Shark’s main window (seeMain Window). The targeted process (if any) on the remote shared computer can be changed by changing the selection in the menu.
Cached Sessions (not pictured)— This column is only visible if “Auto Download” is not active. It lists the number of complete profile sessions cached on each shared computer, and waiting for download to the controlling system.
Refresh button— Click this button to clear the table and search for shared computers and attached iOS devices again. Computers that you have added by hand will not be cleared from the list when you refresh.
Add Computer button and Name field— Pressing this button attempts to add the computer with the name or IP address entered into the computer name field to the list of shared computers. The specified computer must be attached to the network and running Shark in shared profiling mode, or this will fail.
Download One and Download All buttons— If the Auto Download checkbox is not selected, then computers that are being controlled across the network will cache the session files they generate for later download rather than sending them immediately to the controlling Shark application. The number of sessions available to download is listed in the Shared Computer table’s Cached Sessions column. Clicking the Download One button will download a single session, while clicking the Download All button will download all available sessions. Sessions are always retrieved in the order that they were created.
Using Shared Profiling Mode
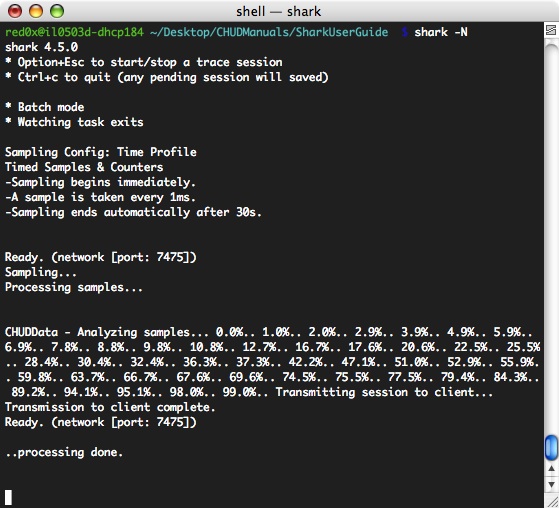
Although the graphical Shark application can be placed in “Share this computer” mode, it is more typical to use command line shark on any remote, shared computers. You can use ssh(1) to connect to a remote computer. Once connected, launch command line shark with the –N option. The remote run of shark will then respond to network requests to start and stop profiling. A sample transcript of a remote command line shark in “Network Sharing” mode is shown in Figure 5-10. For more information on the usage and configuration of command line shark, see Timed Counters: The Performance Counter Spreadsheet.
Mac OS X Firewall Considerations
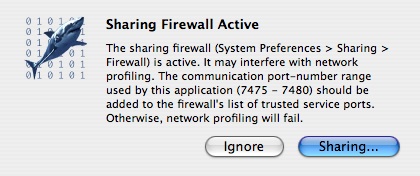
The sharing firewall on Mac OS X can prevent Shark’s network profiling from working in either sharing or control mode. When the Shark Network Manager successfully opens a network connection, the communication port number Shark is using is listed in brackets. This is normally port number 7475. Unfortunately, this port is not “open” through the firewall by default. If you attempt to enter “Shared Profiling” or “Network Control” mode while the firewall is enabled, you will be presented with a warning dialog, as illustrated in Figure 5-11
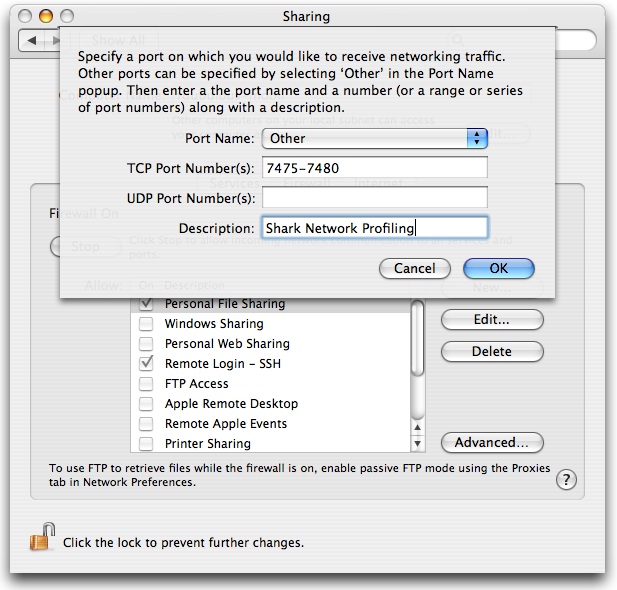
Click the Sharing... button in the warning dialog to bring up the System Preferences window Sharing tab. Otherwise click the Ignore button to dismiss the dialog, but note that doing so may result in the inability to use Shark over the network. Once in the Sharing Preference window of System Preferences, select the Firewall tab. If you have never before added settings for Shark, then click the New… button, and fill in the sheet as shown in Figure 5-12, and click the OK button.
Copyright © 2012 Apple Inc. All Rights Reserved. Terms of Use | Privacy Policy | Updated: 2012-07-23