Retired Document
Important: This document may not represent best practices for current development. Links to downloads and other resources may no longer be valid.
New Features in Instruments 4.2
This chapter provides a summary of some of the new features in Instruments 4.2.
Network Connections
Inspect how your iOS application is using TCP/IP and UDP/IP connections with the Networking Connections instrument. With this instrument, it's possible to see how much data is flowing over each connection, for each application, as well as interesting statistics such as round trip times and retransmission requests. You can use this information to help reduce network traffic and energy consumption.
When you begin a recording run, the instrument takes a snapshot of all open ports and reports their cumulative network activity in the detail view. Then the instrument begins measuring new activity and graphing it in the track view.
The Connection Summary table in the detail view shows outgoing and incoming network connections. In Figure 3-1, a trace document shows the open connections in all processes for a specified time interval.

In the detail view, you can also display two other tables. The Process Summary table aggregates the cumulative data for each process. The Interface Summary table aggregates the data by network interface. The detail view also displays Trace Highlights, a set of useful graphs.
Network Activity
Contained within the Energy Diagnostics template for iOS, the Network Activity instrument helps bridge the gap between networking (cellular and Wi-Fi) and energy usage. You can use this instrument to track the device wide volume of data flow through each network interface alongside an energy usage level taken directly from the battery.
You can use this instrument to correlate network activity with energy usage in iOS devices. For example, Figure 3-2 shows an Energy Diagnostics trace document with two runs that result in dramatically different energy usage levels.

In run 1, the network activity is frequent enough to keep the radio active, resulting in greater energy consumption. In run 2, the same data is transmitted in larger, less frequent bursts, allowing the radio to sleep between transmissions.
System Trace for iOS
System Trace is an Instruments template that uses several instruments to profile aspects of the operating system that could be affecting application performance. In Instruments 4.2, you can use System Trace to profile both iOS and OS X.
Automation
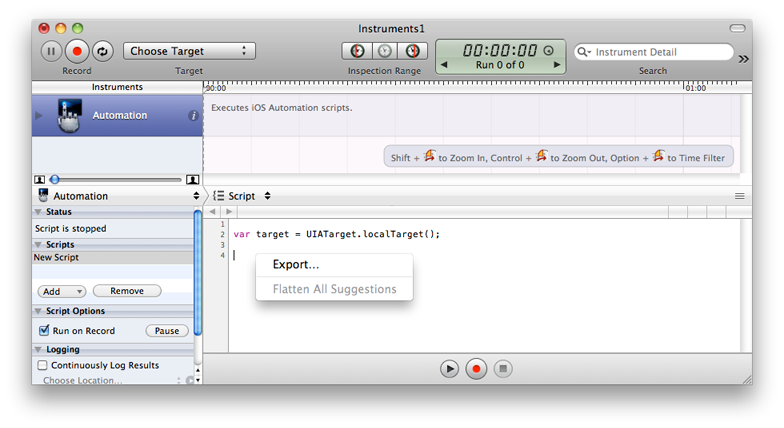
The Automation instrument (included in the Instruments application and shown in Figure 3-3) allows you to write test scripts to exercise your iOS application’s user interface elements when the application is running on a connected device. You write the tests in JavaScript to the UI Automation API. The test script simulates user interaction with the application as it runs and returns log information to the host computer.
For more information about using the UI Automation feature, see Built-in Instruments in the Instruments User Guide. For Reference details, see UI Automation Reference Collection.

This version of the Automation instrument introduces several new features, including:
Script editing with a built-in script editor
Capturing (recording) user interface actions for use in automation scripts
Running a test script from an Xcode project
Various API enhancements, including the ability to simulate a device location change and to execute a task from the Automation instrument on the host
Editing a Test Script in the Automation Instrument
The built-in script editor in the Automation instrument allows you to edit your test scripts in the trace document. You can create a new script in your trace document or import an existing script. The editor supports script editing, including code completion. Note, however, that a script created in the trace document must be exported before you can use it outside the trace document.
Creating a Script in the Editor
To create a script for editing within your trace document:
Follow the steps in Creating an Automation Trace Document to create a trace document.
In the Automation section of the Instruments area on the left, click the Scripts disclosure triangle, if necessary, to display the contents of that pane.
From the Add pop-up menu, as shown in Figure 3-4, choose Create.
A new script opens in the content pane on the right.

Importing a Script into the Editor
To import an existing script from disk for editing within your trace document:
Follow the steps in Creating an Automation Trace Document to create a trace document.
In the Automation section of the Instruments area on the left, click the Scripts disclosure triangle, if necessary, to display the contents of that pane.
From the Add pop-up menu, as shown in Figure 3-4, choose Import.
Locate your script in the file system and click Open.
Your script opens in the content pane on the right.
Exporting Your Script to a File
Changes you make with the script editor are saved when you save your trace document. For scripts created in the editor, changes are saved as part of the trace document itself. To save those changes in a file you can access on disk, you have to export the script.
To export a script to a file on disk:
Capturing User Interface Actions into Automation Scripts
A new capture feature simplifies script development by allowing you to record actions that you perform on a target iOS device or in iOS Simulator. To use this feature, create an Automation trace document and then capture actions that you perform on the device. These captured actions are incorporated into your script as expressions that you can edit.
Creating an Automation Trace Document
To create a trace document with the Automation instrument and an iOS target:
Launch the Instruments application.
Choose the Automation template to create a trace document.
Choose View > Detail, if necessary, to display the detail view.
In the Target menu at the top of the window, choose a target iOS device, then choose your application from the list of iOS applications.
Capturing Actions using the Automation Instrument
With your Automation trace document open, follow these steps to capture actions into your script:
Click the Scripts disclosure triangle, if necessary, to display the contents of that pane.
Select your script from the list.
Click in the script editor pane to position the cursor where you want the captured actions to appear in the script.
Click the Record button under the text editor.
The target application launches, and the script status is updated to indicate that capturing is in progress.
Perform actions on the device.
Click the Stop button under the text editor to stop capturing actions.
The Automation instrument generates expressions in your script for the actions you perform. Some of these expressions include tokens that contain alternative syntax for the expression. To see the alternative syntax, select the arrow at the right of the token. To select the currently displayed syntax for a token and flatten the expression, double-click the token.
Running a Test Script from an Xcode Project
With the iOS 5 SDK and Xcode 4.2, you can now run your UI Automation test script from the Xcode project for your application. The following steps outline the process:
Write an automation test script for your application. See UI Automation Reference Collection and the UI Automation section of Built-in Instruments in Instruments User Guide for details.
Use Instruments to create an Automation instrument template tailored for your application and test script. See Creating a Custom Automation Instrument Template, below.
Open your application as an Xcode 4 project and profile your target application to launch Instruments and start your tests. See Executing an Automation Instrument Script in Xcode, below.
Creating a Custom Automation Instrument Template
To create a custom Automation instrument template:
Launch the Instruments application.
Choose the Automation template to create a trace document.
Choose View > Detail, if necessary, to display the detail view.
Click the Scripts disclosure triangle, if necessary, and select your script from the list.
If your script is not in the list, you can import it (choose Add > Import) or create a new one (choose Add > Create).
Choose File > Save as Template, name the template, and save it to the default Instruments template location:
~/Library/Application Support/Instruments/Templates/
Executing an Automation Instrument Script in Xcode
After you have created your customized Automation template, you can execute your test script from Xcode by following these steps:
Open your project in Xcode.
From the Scheme pop-up menu (in the workspace window toolbar), select Edit Scheme for a scheme with which you would like to use your script.
Select Profile from the left column of the scheme editing dialog.
Choose your application from the Executable pop-up menu.
Choose your customized Automation Instrument template from the Instrument pop-up menu.
Click OK to approve your changes and dismiss the scheme editor dialog.
Choose Product > Profile.
Instruments launches and executes your test script.
Executing an Automation Instrument Script from the Command Line
You can also execute your test script from the command line. If you have created a customized Automation template as described in Creating a Custom Automation Instrument Template, you can use the following simple command:
instruments -w deviceID -t templateFilePath targetAppName
- deviceID
The 40-character device identifier, available in the Xcode Devices organizer, and in iTunes.
- templateFilePath
The full pathname of your customized Automation template, by default,
~/Library/Application Support/Instruments/Templates/templateName, wheretemplateNameis the name you saved it with.- targetAppName
The local name of the application. When targeting a device, omit the pathname and
.appextension. When targeting a simulator, use the full pathname.
You can use the default trace template if you don’t want to create a custom one. To do so, you use the environment variables UIASCRIPT and UIARESULTSPATH to identify the script and the results directory.
instruments -w deviceID -t defaultTemplateFilePath targetAppName |
-e UIASCRIPT scriptFilePath -e UIARESULTSPATH resultsFolderPath |
- defaultTemplateFilePath
The full pathname of the default template:
/Applications/Xcode.app/Contents/Developer/Platforms/iPhoneOS.platform/Developer/Library/Instruments/PlugIns/
AutomationInstrument.bundle/Contents/Resources/Automation.tracetemplate
- scriptFilePath
The file-system location of your test script.
- resultsFolderPath
The file-system location of the directory to hold the results of your test script.
Using Screenshots
Your script can capture screenshots using the captureScreenWithName and captureRectWithName methods in the UIATarget class. To ensure easy access to those screenshots, open the Logging section at the left of the template, select the "Continuously Log Results" option, and use the Choose Location popup menu to specify a folder for the log results. Each captured screenshot is stored in the results folder with the name specified by your script.
Using the Timeout Period
Initial attempts to access a new element are performed with a default timeout period. That is, if the first attempt to obtain the new element fails, UIAutomation repeatedly retries the access (with a brief delay between each try), until it succeeds or the amount of time retrying exceeds the current timeout period value. If the attempt times out, UIAutomation returns a UIAElementNil object. A UIAElementNil object is always considered invalid.
An attempt to access an element can fail for a variety of reasons—for example:
The app is still in the process of launching.
A new screen hasn’t yet been completely drawn.
The element (such as a button your script is trying to click) may be drawn, but its contents are not filled in or updated yet.
The default timeout period is a few seconds, but your script can adjust it as necessary. For example, you might decrease the timeout period if you want to test whether an element exists, but don’t need to wait if it isn’t. On the other hand, you might increase the timeout period when the script must access an element, but the user interface is slow to update. The following methods for manipulating the timeout period are available in the UIATarget class:
timeout: Returns the current timeout value.setTimeout: Sets a new timeout value.pushTimeout: Stores the current timeout value on a stack and sets a new timeout value.popTimeout: Retrieves the previous timeout value from a stack, restores it as the current timeout value, and returns it.
For details, see UIATarget Class Reference.
Accessibility Label and Identifier Attributes
The label attribute and identifier attribute figure prominently in your script’s ability to access UI elements. It is important to understand how they are used.
Setting a meaningful value for the label attribute is optional, but recommended. You can set and view the label string in the Label text field in the Accessibility section of the Identity inspector in Interface Builder. This label is expected to be descriptive, but short, partly because assistive technologies such as Apple’s VoiceOver use it as the name of the associated UI element. In UI Automation, this label is returned by the label method. It is also returned by the name method as a default if the identifier attribute is not set. For details, see UIAccessibilityElement Class Reference.
The identifier attribute allows you to use more descriptive names for elements. It is optional, but it must be set for the script to perform either of these two operations:
Accessing a container view by name while also being able to access its children.
Accessing a UILabel view by name to obtain its displayed text (via its
valueattribute).
In UI Automation, the name method returns the value of this identifier attribute, if one is set. If it is not set, the name method returns the value of the label attribute.
Currently, you can set a value for the identifier attribute only programmatically, via the accessibilityIdentifier property. For details, see UIAccessibilityIdentification Protocol Reference.
API Changes
The UI Automation API for iOS 5.0 includes numerous enhancements. For example:
UIATargetnow supports rotation gestures and location changes.UIAHost, a new class, allows the test script to cause a task to be executed from within the Automation instrument process running on the host computer.UIAElementnow supports rotation gestures centered on a specified element and incorporates support for navigation bars, tab bars, and toolbars. These features were previously available only in theUIAWindowandUIAPopoverclasses.UIAKeyboardnow supports tapping keyboard keys to generate (type) a specified string.
These API changes are described in UI Automation Reference Collection.
Copyright © 2012 Apple Inc. All Rights Reserved. Terms of Use | Privacy Policy | Updated: 2012-02-16