Understanding Sample Perspective in the Sampler Instrument
Q: I'm running the Sampler instrument and it looks like CPU time is being evenly distributed across all threads in my application. Why?
A: I'm running the Sampler instrument and it looks like CPU time is being evenly distributed across all threads in my application. Why?
If you see a Sampler trace that indicates that CPU time is being evenly distributed across all threads that usually means you have Sampler set to display "All Sample Counts" as shown in Figure 1.

When set to "All Sample Counts" the Sampler instrument tells you what each thread is doing, regardless of thread state. This can be useful to determine why a particular thread may not be performing as you might expect it, but it is not typically useful for determining where the hot spots in your application are. Instead you want to switch the Sampler instrument to display "Running Sample Times" as shown in Figure 2.
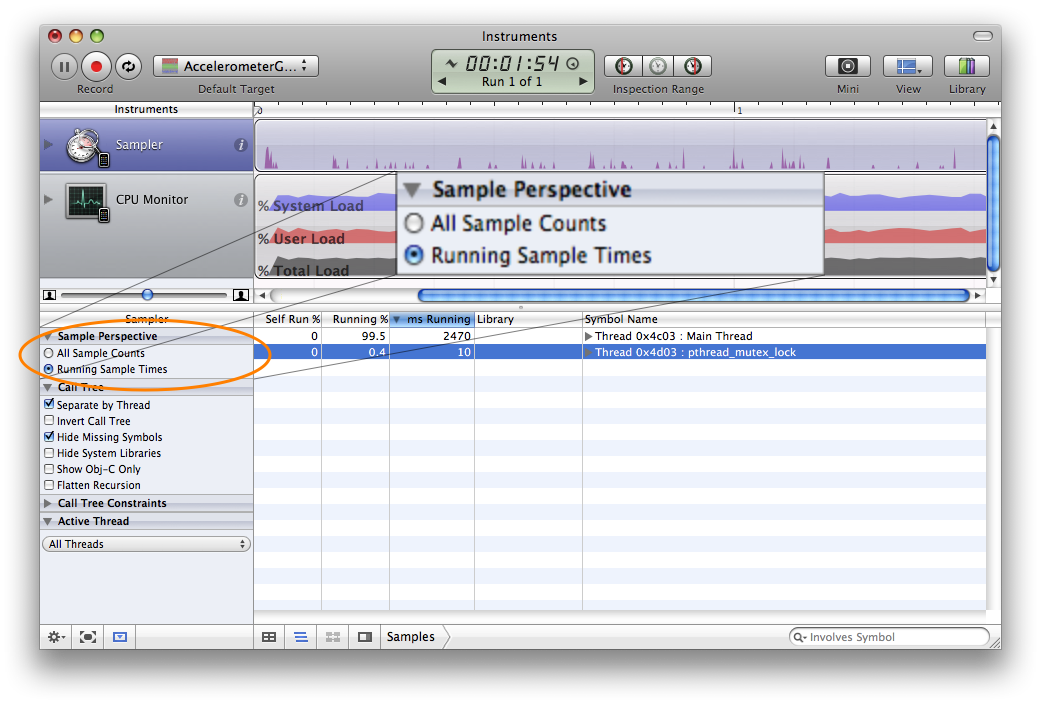
Now you see that the second thread consumed very little real CPU time compared to the main thread, which indicates that you should be looking there first for performance tuning.
Document Revision History
| Date | Notes |
|---|---|
| 2009-06-01 | New document that describes what Sample Perspective does and how it changes the results of the Sampler Instrument. |
Copyright © 2009 Apple Inc. All Rights Reserved. Terms of Use | Privacy Policy | Updated: 2009-06-01