Understanding and Debugging Kernel Panics
When the kernel crashes on Mac OS X, the system displays a panic message. At this point the system will have to be restarted. But before hitting the power button, how can one find out what caused the crash?
This technote addresses kernel panics: what they are and how to debug the code that caused the panic.
The foundation of Mac OS X is an operating system core commonly known as Darwin. This technote contains links to source files available from the Darwin open source site. Access to these files requires a username and password obtained by agreeing to the Apple Public Source License.
What is a Kernel Panic?
In UNIX, a panic is an unrecoverable system error detected by the kernel as opposed to similar errors detected by user space code. It is possible for kernel code to indicate such a condition by calling the panic function located in the Kernel.framework header file sys/systm.h. However, most panics are the result of unhandled processor exceptions in kernel code, such as references to invalid memory addresses. These are typically indicative of a bug somewhere in the call chain leading up to the panic.
What Does a Panic Look Like?
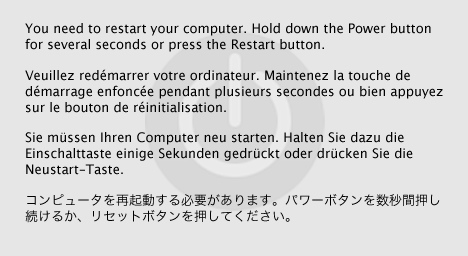
A panic is typically indicated by the multi-lingual panic alert shown in Figure 1. After restarting the system, a log file named with the date and time of the panic should be present in /Library/Logs/PanicReporter. (Prior to Mac OS X 10.5 Leopard, this log is /Library/Logs/panic.log.) The panic log contains information about the state of the machine at the time of the panic. Starting with Mac OS X 10.4 Tiger, after restarting the system, the user will be given an opportunity to send this panic log to Apple. To protect a user’s privacy, the only information transmitted to Apple are the panic log, a simple hardware description without identifying IP address, and any user comments.
Other behaviors can be specified by setting flags in the debug boot argument passed to the kernel when it starts up. These boot arguments can be set via the boot-args firmware variable using the nvram command-line tool. A list of flags affecting remote debugging is given in Table 19-1 of Kernel Programming Guide and Kernel Core Dumps.
The most common use of boot-args is to enable remote (two-machine) kernel debugging. This causes the system to wait for a connection from a remote GDB debugger session after either the panic alert or textual panic dump has been displayed. For more details on remote kernel debugging, please refer to Kernel Extension Programming Topics.
Basics of Processor Exception Handling in the Mac OS X Kernel
An exception is a condition encountered by the processor that requires special processing.
Intel Processor Exception Handling
On Intel IA-32 and Intel 64 architecture processors, each architecturally-defined exception is assigned a unique identification number called a vector. The processor uses the vector assigned to an exception as an index into the interrupt descriptor table (IDT). The IDT provides the entry point to the exception handler. Some of the processor registers are stored on the stack before control is transferred to the exception handler.
Exceptions are classified as faults, traps, and aborts depending on the way they are reported and whether the instruction that caused the exception can be restarted without loss of program continuity.
The most common exceptions are:
Page faults, caused by an attempt to access data at an invalid memory address, such as dereferencing a NULL pointer.
Invalid/undefined opcode exceptions, caused by an attempt to execute an instruction with an invalid opcode.
General protection faults, caused by any of a number of conditions, including transferring execution to a non-executable code segment or writing to either a code segment or read-only data segment.
Details on exception handling on Intel processors can be found in Chapter 5 "Interrupt and Exception Handling" of the document Intel 64 and IA-32 Architectures Software Developer’s Manual, Volume 3A: System Programming Guide, Part 1.
The processor registers that are shown in a panic log are:
Control Register 0 (CR0). Contains flags that control the processor's operating mode and indicate the state of the processor.
Control Register 2 (CR2). Contains the address that caused a page fault.
Control Register 3 (CR3). Contains the physical address of the base of the page directory.
Control Register 4 (CR4). Contains a group of flags that enable several architectural extensions and indicate operating system support for specific processor capabilities.
EAX. General-purpose register, also used as an accumulator for operands and results data.
EBX. General-purpose register, also used as a pointer to data in the DS segment.
ECX. General-purpose register, also used as a counter for string and loop operations.
EDX. General-purpose register, also used as an I/O pointer.
EBP. General-purpose register mainly used as a pointer to data on the stack (stack frame).
ESI. General-purpose register, used as a pointer to data in the segment pointed to by the DS register and as a source pointer for string operations.
EDI. General-purpose register, used as a pointer to data (or destination) in the segment pointed to by the ES register and as a destination pointer for string operations.
EFLAGS. Program status and control register. Contains status, control, and system flags. Status flags are set as the result of compare and arithmetic operations. This register is displayed in panics as
EFL.Instruction Pointer (EIP). Contains the address of the next instruction to be executed. Depending on the exception, this may be the address of the instruction which caused the exception or the next instruction in the program flow.
CS. Segment register pointing to the code segment.
DS. Segment register pointing to the data segment.
Details on the Intel 64 and IA-32 register sets can be found in Chapter 3 "Basic Execution Environment" of the document Intel 64 and IA-32 Architectures Software Developer’s Manual, Volume 1: Basic Architecture.
The Mac OS X kernel follows this execution flow when handling an Intel 64 or IA-32 exception:
xnu/osfmk/i386/idt64.s: master_idt(
xnu/osfmk/i386/idt.s: master_idton Core Duo processors)xnu/osfmk/i386/locore.s: lo_alltrapsEach exception handler in the IDT eventually branches to
lo_alltrapsxnu/osfmk/i386/locore.s: trap_from_kernelxnu/osfmk/i386/trap.c: kernel_trapxnu/osfmk/i386/trap.c: panic_trapxnu/osfmk/kern/debug.c: panicxnu/osfmk/i386/AT386/model_dep.c: Debuggerxnu/osfmk/i386/AT386/model_dep.c: panic_i386_backtrace
The functions panic_trap and panic_i386_backtrace produce the panic log.
PowerPC Processor Exception Handling
The PowerPC microprocessor family handles exceptions by switching to supervisor state, saving the processor state to certain registers, and then jumping to an exception handler routine. Each major type of exception (data memory access, alignment, etc.) has its own exception vector located at an absolute address defined in the PowerPC architecture.
The most common exceptions are:
DSI (data storage interrupt, or data memory access) exceptions, caused by an attempt to access data at an invalid memory address, such as dereferencing a NULL pointer.
ISI (instruction storage interrupt) exceptions, caused by an attempt to execute an instruction at an invalid memory address, such as branching to location zero.
Illegal instruction exceptions, caused by an attempt to execute an instruction with an invalid opcode.
Details on PowerPC exception handling can be found in Chapter 6 of the document PowerPC Microprocessor Family: The Programming Environments For 32-Bit Microprocessors (hereafter referred to as TPE).
The processor registers that are shown in a panic log are:
DSISR. Identifies the cause of DSI and alignment exceptions such as a direct-store error exception, or the operand of an integer double-word load or store instruction is not word-aligned.
Data Access Register (DAR). Contains the effective address of the memory element which caused a DSI or alignment exception.
Machine State Register (MSR). Defines the state of the processor. Settings include interrupt enable, privilege level, machine check enable, and address translation bits.
Machine Status Save/Restore Register 0 (SRR0). Contains the address used to calculate where instruction processing should continue after the exception is handled. Depending on the exception, this may be the effective address of the instruction which caused the exception or the next instruction in the program flow. This register is displayed in panics as
PC(program counter).Machine Status Save/Restore Register 1 (SRR1). Contains exception-specific information and selected bits from the MSR at the time the exception occurred. This register is displayed in panics as
MSR.Link Register (LR). Contains the address of the instruction following the last subroutine call (
bl: branch then link) instruction.General Purpose Register 1 (GPR1). Used as the stack pointer to store parameters and other temporary data items. This register is displayed in panics as
R1.
Details on the PowerPC register set can be found in TPE Chapter 2.
The Mac OS X kernel follows this execution flow when handling a PowerPC exception:
xnu/osfmk/ppc/lowmem_vectors.s: L_handlerXXXX(where
XXXXis the exception handler vector in the range 100 to 2FFF; only 100-2000 are currently used)xnu/osfmk/ppc/lowmem_vectors.s: L_exception_entryxnu/osfmk/ppc/hw_exception.s: thandlerxnu/osfmk/ppc/trap.c: trapxnu/osfmk/ppc/trap.c: unresolved_kernel_trap
The last function (unresolved_kernel_trap) is where panic information is displayed.
Panic Logs
How to Read the Panic Log from an Intel-Based Mac
Listing 1 is a typical panic display from an Intel-based Macintosh computer running Mac OS X 10.5.4. Line numbers have been added for ease of reference.
Listing 1 Example Intel panic log.
1 panic(cpu 0 caller 0x001A8CD4): Kernel trap at 0x223ab275, type 14=page fault, registers: 2 CR0: 0x8001003b, CR2: 0xdeadbeef, CR3: 0x01251000, CR4: 0x00000660 3 EAX: 0xdeadbeef, EBX: 0x0049be30, ECX: 0x0050d444, EDX: 0x00534da0 4 CR2: 0xdeadbeef, EBP: 0x220dbe48, ESI: 0x06d59600, EDI: 0x02cecd00 5 EFL: 0x00010206, EIP: 0x223ab275, CS: 0x00000008, DS: 0x032f0010 6 Error code: 0x00000002 7 8 Backtrace, Format - Frame : Return Address (4 potential args on stack) 9 0x220dbc48 : 0x12b0fa (0x4592a4 0x220dbc7c 0x133243 0x0) 10 0x220dbc98 : 0x1a8cd4 (0x46280c 0x223ab275 0xe 0x461fbc) 11 0x220dbd78 : 0x19ede5 (0x220dbd90 0x2cecd00 0x220dbe48 0x223ab275) 12 0x220dbd88 : 0x223ab275 (0xe 0x48 0x61330010 0x31340010) 13 0x220dbe48 : 0x410db2 (0x6d59600 0x2cecd00 0x13315e 0x1331fa) 14 0x220dbea8 : 0x412c47 (0x2cecd00 0x6d59600 0x49be30 0x1) 15 0x220dbf28 : 0x4124ab (0x2cecd00 0x3312740 0x0 0x3f05c9) 16 0x220dbf78 : 0x411127 (0x2cecd00 0x8 0x220dbfac 0x1) 17 0x220dbfc8 : 0x19ebdc (0x30db910 0x0 0x1a20b5 0x3b3e5d0) 18 Backtrace terminated-invalid frame pointer 0 19 Kernel loadable modules in backtrace (with dependencies): 20 com.apple.dts.driver.PanicDriver(1.1)@0x223aa000->0x223abfff 21 22 BSD process name corresponding to current thread: kernel_task 23 24 Mac OS version: 25 9E17 26 27 Kernel version: 28 Darwin Kernel Version 9.4.0: Mon Jun 9 19:30:53 PDT 2008; root:xnu-1228.5.20~1/RELEASE_I386 29 System model name: MacPro1,1 (Mac-F4208DC8) 30 ethernet MAC address: 00:17:f2:00:00:00 31 ip address: 192.0.2.1 32 33 Waiting for remote debugger connection. |
For each line of the panic log, the name of the kernel source file and function that displays that line is given, followed by an explanation of the information on that line.
Line 1: xnu/osfmk/i386/trap.c: panic_trap
panic(: This function calls panic to display its output.
cpu 3: The number of the processor core which called panic. Note that on a multicore system it's possible for one core to be panicked while the others continue to run.
caller 0x001A8CD4):: The address from which panic was called. If the panic is the result of an unhandled processor exception, this address will be inside the panic_trap function.
Kernel trap at 0x223ab275: Textual description of the cause of the panic and the address of the instruction that was executing at the time of the panic.
Type 14=page fault: trap name. This is a textual description of the exception. The trap names are found in the array trap_type in xnu/osfmk/i386/trap.c, which is initialized from the macro TRAP_NAMES found in the corresponding header file xnu/osfmk/i386/trap.h. The processor exception vector trapno (defined in xnu/osfmk/i386/trap.h) is initially pushed onto the stack by the exception handler the IDT points to (see xnu/osfmk/i386/idt64.s and xnu/osfmk/i386/idt.s).
The 14 at the beginning is the exception vector in decimal. Using this value one can look up details on the specific exception in Intel 64 and IA-32 Architectures Software Developer’s Manual, Volume 3A: System Programming Guide, Part 1 Chapter 5.
Back to Listing 1
Line 2: xnu/osfmk/i386/trap.c: panic_trap
Contents of registers CR0, CR2, CR3, and CR4 at the time the panic log is generated.
Back to Listing 1
Line 3: xnu/osfmk/i386/trap.c: panic_trap
Contents of registers EAX, EBX, ECX, and EDX from the exception handler.
Back to Listing 1
Line 4: xnu/osfmk/i386/trap.c: panic_trap
Contents of registers CR2, EBP, ESI, and EDI from the exception handler.
Back to Listing 1
Line 5: xnu/osfmk/i386/trap.c: panic_trap
Contents of registers EFLAGS, EIP, CS, and DS from the exception handler.
Back to Listing 1
Line 6: xnu/osfmk/i386/trap.c: panic_trap
Error code: 0x00000002: An error code is reported for each exception related to a specific segment. The format of the error code for a page fault (exception vector 14) is different from that for other exceptions. The page fault error code reports if the fault was caused by a not-present page or some other reason and whether the memory access was a read or a write. See Intel 64 and IA-32 Architectures Software Developer’s Manual, Volume 3A: System Programming Guide, Part 1 Section 5.3 for details.
Common error code values for exception vector 14 are 0x00000000 indicating a read from a non-present page, and 0x00000002 indicating a write to a non-present page.
Back to Listing 1
Line 7: xnu/osfmk/kern/debug.c: panic
Line 8: xnu/osfmk/i386/AT386/model_dep.c: panic_i386_backtrace
This is the actual stack backtrace. Each line shows the address of the stack frame, a colon ":", the return address saved in that frame, then four potential arguments in the stack frame enclosed in parentheses.
The first stack frame is located using the value of the stack pointer (EBP) at the time the backtrace is captured. The next stack frame is located using the value of EBP saved in the stack frame. Up to 16 stack frames will be shown, fewer than that if a zero stack pointer is encountered.
Details on how the stack is used by Mac OS X can be found in the document OS X ABI Function Call Guide.
The backtrace is typically the most useful information in a panic log because it can be used to reconstruct the call chain that led to the exception. This is discussed in the next section Isolating the Crash.
Back to Listing 1
Lines 9 through 18: xnu/osfmk/i386/AT386/model_dep.c: panic_i386_backtrace
Back to Listing 1
Line 19: xnu/osfmk/kern/kmod.c: kmod_dump_to
This looks at the addresses in the backtrace and prints out the module name, version, and the starting and ending addresses of each kernel loadable module in the backtrace. (A kernel loadable module is simply the executable portion of a kernel extension, or KEXT.) It also prints out the same information for the dependencies of each kernel extension. The module name and version is the same as that shown by the kextstat command and is the value of MODULE_NAME and MODULE_VERSION in the Xcode build settings. The dependencies are those specified in the OSBundleLibraries property in the KEXT's Info.plist property list.
Back to Listing 1
Line 20: xnu/osfmk/kern/kmod.c: kmod_dump_to
Back to Listing 1
Line 21: xnu/osfmk/kern/debug.c: panic_display_process_name
Line 22: xnu/osfmk/kern/debug.c: panic_display_process_name
If the current thread originated from within the kernel, the task name shown is kernel_task.
Back to Listing 1
Line 23: xnu/osfmk/kern/debug.c: panic_display_system_configuration
Line 24: xnu/osfmk/kern/debug.c: panic_display_system_configuration
Line 25: xnu/osfmk/kern/debug.c: panic_display_system_configuration
The build number is obtained from the kernel global variable osversion.
Back to Listing 1
Line 26: xnu/osfmk/kern/debug.c: panic_display_system_configuration
Back to Listing 1
Line 27: xnu/osfmk/kern/debug.c: panic_display_system_configuration
Line 28: xnu/osfmk/kern/debug.c: panic_display_system_configuration
This is the value of the kernel global variable version, set at the time the kernel is built.
The string Mon Jun 9 19:30:53 PDT 2008 is the date and time the kernel was built. The string xnu-1228.5.20~1 is the source revision used to build this kernel. This information can be used to locate the source for this kernel version in the Darwin open source.
To see the version of a running kernel, use the sysctl command as illustrated in Listing 2.
Listing 2 Displaying the kernel version.
$ sysctl kern.version kern.version = Darwin Kernel Version 9.4.0: Mon Jun 9 19:30:53 PDT 2008; root:xnu-1220.5.20~1/RELEASE_I386 |
The steps to build a custom kernel can be found in the chapter Building and Debugging Kernels of the document Kernel Programming Guide.
Back to Listing 1
Line 29: xnu/osfmk/kern/debug.c: panic_display_model_name
The model name gives a high-level description of the panicked system. The first part MacPro1,1 contains the product name and version. The second part is only useful if the panic log is sent to Apple.
Back to Listing 1
Line 30: xnu/osfmk/kdp/kdp_udp.c: kdp_connection_wait
This is the built-in Ethernet MAC address of the panicked machine. This and the IP address (line 31) are used to establish a remote debugging session.
Back to Listing 1
Line 31: xnu/osfmk/kdp/kdp_udp.c: kdp_connection_wait
This is the IP address of the panicked machine. This and the Ethernet MAC address (line 30) are used to establish a remote debugging session.
Back to Listing 1
Line 32: xnu/osfmk/kdp/kdp_udp.c: kdp_connection_wait
Line 33: xnu/osfmk/kdp/kdp_udp.c: kdp_connection_wait
At this point the system is waiting for a connection from a remote debugger.
Back to Listing 1
How to Read the Panic Log from a PowerPC-Based Mac
Listing 3 is a typical panic display from a PowerPC-based Macintosh computer running Mac OS X 10.5.4. Line numbers have been added for ease of reference.
Listing 3 Example PowerPC panic log.
1 Unresolved kernel trap(cpu 0): 0x300 - Data access DAR=0x00000000DEADBEEF PC=0x000000001918F504 2 Latest crash info for cpu 0: 3 Exception state (sv=0x1a85d500) 4 PC=0x1918F504; MSR=0x00009030; DAR=0xDEADBEEF; DSISR=0x42000000; LR=0x1918F4F0; R1=0x19997C50; XCP=0x0000000C (0x300 - Data access) 5 Backtrace: 6 0x1918F4F0 0x0034380C 0x00344960 0x00346810 0x00345930 0x000B05D4 7 Kernel loadable modules in backtrace (with dependencies): 8 com.apple.dts.driver.PanicDriver(1.1)@0x1918e000->0x1918ffff 9 Proceeding back via exception chain: 10 Exception state (sv=0x1a85d500) 11 previously dumped as "Latest" state. skipping... 12 Exception state (sv=0x19f2ac80) 13 PC=0x00000000; MSR=0x0000D030; DAR=0x00000000; DSISR=0x00000000; LR=0x00000000; R1=0x00000000; XCP=0x00000000 (Unknown) 14 15 BSD process name corresponding to current thread: kernel_task 16 17 Mac OS version: 18 9E17 19 20 Kernel version: 21 Darwin Kernel Version 9.4.0: Mon Jun 9 19:36:17 PDT 2008; root:xnu-1228.5.20~1/RELEASE_PPC 22 System model name: PowerMac7,2 23 Memory access exception (1,0,0) 24 ethernet MAC address: 00:0a:95:00:00:00 25 ip address: 192.0.2.2 26 27 Waiting for remote debugger connection. |
For each line of the panic log, the name of the kernel source file and function that displays that line is given, followed by an explanation of the information on that line.
Line 1: xnu/osfmk/ppc/trap.c: unresolved_kernel_trap
Unresolved kernel trap: Textual description of the cause of the panic.
(cpu 0): The number of the processor core on which the exception occurred. Note that on a multicore system it's possible for one core to be panicked while the others continue to run.
0x300 - Data access: trap name. This is a textual description of the exception. The trap names are found in the array trap_type in xnu/osfmk/ppc/trap.c. The hardware exception code trapno (defined in xnu/osfmk/ppc/exception.h) is initially set by the exception handler xnu/osfmk/ppc/lowmem_vectors.s: L_handlerXXXX where XXXX is the PowerPC exception vector. The index into the trap_type array is computed by dividing trapno by T_VECTOR_SIZE, defined to be 4 (the size of a function pointer), also in xnu/osfmk/ppc/exception.h.
The 0x300 at the beginning is the PowerPC exception vector. Using this value one can look up details on the specific exception in TPE Chapter 6.
DAR: contents of Data Access Register
PC: contents of register SRR0
The interpretation of DAR and PC varies depending on the definition of each exception.
Back to Listing 3
Line 2: xnu/osfmk/ppc/model_dep.c: print_backtrace
Back to Listing 3
Line 3: xnu/osfmk/ppc/model_dep.c: print_backtrace
PowerPC exception states are stored in data structures of type savearea (see xnu/osfmk/ppc/exception.h). sv is the address of the savearea for the latest exception.
Back to Listing 3
Line 4: xnu/osfmk/ppc/model_dep.c: dump_savearea
PC: contents of SRR0
MSR: contents of SRR1
DAR: contents of Data Access Register
DSISR: contents of DSISR
LR: contents of Link Register
R1: contents of GPR1
XCP: This is not a register but is the exception code stored in the savearea corresponding to the current exception. It is followed by the trap name (see line 1).
Back to Listing 3
Line 5: xnu/osfmk/ppc/model_dep.c: dump_backtrace
Back to Listing 3
Line 6: xnu/osfmk/ppc/model_dep.c: dump_backtrace
This is the actual stack backtrace. The initial stack pointer is the value of GPR1 in the savearea. The value of LR from the linkage area of the stack frame is printed, then the next stack frame is located using the value of GPR1 saved in the stack frame. Up to 32 stack frames will be printed, fewer than that if a zero GPR1 is encountered or if a savearea exists for an earlier exception.
Details on how the stack is used by Mac OS X can be found in the document OS X ABI Function Call Guide.
The backtrace is typically the most useful information in a panic dump because it can be used to reconstruct the call chain that led to the exception. This is discussed in the next section Isolating the Crash.
Back to Listing 3
Line 7: xnu/osfmk/kern/kmod.c: kmod_dump_to
This looks at the addresses in the backtrace and prints out the module name, version, and starting and ending addresses of each kernel loadable module in the backtrace. (A kernel loadable module is simply the executable portion of a kernel extension, or KEXT.) It also prints out the same information for the dependencies of each kernel extension. The module name and version is the same as that shown by the kextstat command and is the value of MODULE_NAME and MODULE_VERSION in the Xcode build settings. The dependencies are those specified in the OSBundleLibraries property in the KEXT's Info.plist property list.
Back to Listing 3
Line 8: xnu/osfmk/kern/kmod.c: kmod_dump_to
Line 9: xnu/osfmk/ppc/model_dep.c: print_backtrace
Each exception state is now dumped. The first one was already shown in lines 3 through 6 (note the same value of sv in both locations) so it is skipped.
Back to Listing 3
Line 10: xnu/osfmk/ppc/model_dep.c: print_backtrace
Back to Listing 3
Line 11: xnu/osfmk/ppc/model_dep.c: print_backtrace
Back to Listing 3
Line 12: xnu/osfmk/ppc/model_dep.c: dump_savearea
Same as line 3.
Back to Listing 3
Line 13: xnu/osfmk/ppc/model_dep.c: dump_savearea
Same as line 4.
Back to Listing 3
Line 14: xnu/osfmk/kern/debug.c: panic_display_process_name
Line 15: xnu/osfmk/kern/debug.c: panic_display_process_name
If the current thread originated from within the kernel, the process name shown is kernel_task.
Back to Listing 3
Line 16: xnu/osfmk/kern/debug.c: panic_display_system_configuration
Line 17: xnu/osfmk/kern/debug.c: panic_display_system_configuration
Line 18: xnu/osfmk/kern/debug.c: panic_display_system_configuration
The build number is obtained from the kernel global variable osversion.
Back to Listing 3
Line 19: xnu/osfmk/kern/debug.c: panic_display_system_configuration
Line 20: xnu/osfmk/kern/debug.c: panic_display_system_configuration
Line 21: xnu/osfmk/kern/debug.c: panic_display_system_configuration
This is the value of the kernel global variable version, set at the time the kernel is built.
The string Mon Jun 9 19:36:17 PDT 2008 is the date and time the kernel was built. The string xnu-1228.5.20~1 is the source revision used to build this kernel. This information can be used to locate the source for this kernel version in the Darwin open source.
To see the version of a running kernel, use the sysctl command as illustrated in Listing 2.
The steps to build a custom kernel can be found in the chapter Building and Debugging Kernels of the document Kernel Programming Guide.
Back to Listing 3
Line 22: xnu/osfmk/kern/debug.c: panic_display_model_name
The model name includes the product name and version of the panicked system.
Back to Listing 1
Line 23: xnu/osfmk/kdp/kdp_udp.c: kdp_raise_exception
This line contains an exception message followed by the exception number, code, and subcode in parentheses.
exception: The array kdp_trap_codes defined in xnu/osfmk/kdp/ml/ppc/kdp_machdep.c is used to convert PowerPC-specific exception codes to the generic Mach exception codes used by KDB (kernel debugger). The Mach codes are defined in mach/exception_type.h, but this isn't generally useful because most unhandled PowerPC exceptions are mapped to EXC_BAD_ACCESS (1).
exception_message: The Mach exception code is used to look up a text message describing the exception. The message table exception_message is defined in xnu/osfmk/kdp/kdp_udp.c.
code and subcode are not used and are always zero.
Back to Listing 3
Line 24: xnu/osfmk/kdp/kdp_udp.c: kdp_connection_wait
This is the built-in Ethernet MAC address of the panicked machine. This and the IP address (line 25) are used to establish a remote debugging session.
Back to Listing 3
Line 25: xnu/osfmk/kdp/kdp_udp.c: kdp_connection_wait
This is the IP address of the panicked machine. This and the Ethernet MAC address (line 24) are used to establish a remote debugging session.
Back to Listing 3
Line 26: xnu/osfmk/kdp/kdp_udp.c: kdp_connection_wait
Line 27: xnu/osfmk/kdp/kdp_udp.c: kdp_connection_wait
At this point the system is waiting for a connection from a remote debugger.
Back to Listing 3
Isolating the Crash
Assume that one of your customers or testers had your kernel extension installed and experienced a kernel panic. Fortunately they sent you the panic log like the ones shown earlier. How can you go about finding the cause of the crash?
The first thing to do is to run the same version of the operating system on a computer with the same processor architecture as the panicked machine. Use the OS, kernel, and KEXT version numbers from the panic log to confirm that you're running the correct versions.
Next, take a quick glance at the kind of crash and in which kernel extension the crash occurred.
Finally, the backtrace can be used to get a more precise picture of the sequence of calls that led up to the crash. To decipher the backtrace, it's necessary to create relocated symbol files for the kernel and each kernel extension listed in the backtrace. A new set of symbol files must be generated each time a kernel extension is loaded because the load addresses of the KEXT or its dependencies are likely to be different each time.
Deciphering a Panic Log from an Intel-based Mac
In our example, a page fault exception occurred with the instruction pointer containing 0x223ab275. Looking at the list of loaded kernel extensions, the closest match is com.apple.dts.driver.PanicDriver which is located between addresses 0x223aa000 and 0x223abfff. Then, because this is a page fault, CR2 contains the address which could not be accessed, and the error code describes the reason for the page fault. In this case, it was an attempt to write to memory at 0xdeadbeef that triggered the exception.
The kernel and kernel extensions on a running Mac OS X system contain just enough symbolic information to resolve dependencies between them. In order to translate all of the return addresses in Mac OS X kernel code, download the Kernel Debug Kit corresponding to the version and build of Mac OS X on the panicked system. Kernel Debug Kits contain symbol-rich versions of the kernel and many I/O Kit families. Mount the Kernel Debug Kit disk image, and you're ready to go.
Your own kernel extensions will already have full line number and function name information provided they were built using Xcode's Debug build configuration. On Mac OS X 10.5 and later, be sure the Debug Information Format build setting in your Xcode target settings is set to DWARF with dSYM File.
Generating symbol files is done using the kextload command as illustrated in Listing 4. The -s option specifies the directory where to write the symbol files. The -n option causes kextload to prompt for the load address of each kernel extension and its dependencies.
Alternatively, you can use the createsymbolfiles script included as part of each Kernel Debug Kit to simplify symbol file generation as shown in Listing 5.
Listing 4 Generating the symbol file using kextload.
localhost:~ me$ kextload -c -e -k /Volumes/KernelDebugKit/mach_kernel -n -z -r /Volumes/KernelDebugKit/ -s /tmp PanicDriver/build/Debug/PanicDriver.kext/ kextload: notice: extension PanicDriver/build/PanicDriver.kext/ has debug properties set enter the hexadecimal load addresses for these modules: com.apple.dts.driver.PanicDriver: 0x223aa000 |
Listing 5 Generating the symbol file using createsymbolfiles.
localhost:~ me$ /Volumes/KernelDebugKit/createsymbolfiles -s /tmp PanicDriver/build/Debug/PanicDriver.kext kextload: notice: extension PanicDriver/build/PanicDriver.kext/ has debug properties set enter the hexadecimal load addresses for these modules: com.apple.dts.driver.PanicDriver: 0x223aa000 |
This results in a separate symbol file for each module in /tmp, named <module-name>.sym.
Next, start GDB and load the symbol files using the add-kext command as demonstrated in Listing 6. The set kext-symbol-file-path command tells GDB where to look for .sym symbol files. By default, GDB will look for symbol files in the same directory as the KEXT being loaded by add-kext.
Listing 6 Loading the symbol file into GDB.
localhost:~ me$ gdb /Volumes/KernelDebugKit/mach_kernel GNU gdb 6.3.50-20050815 (Apple version gdb-960) (Sun May 10 10:38:33 UTC 2008) Copyright 2004 Free Software Foundation, Inc. GDB is free software, covered by the GNU General Public License, and you are welcome to change it and/or distribute copies of it under certain conditions. Type "show copying" to see the conditions. There is absolutely no warranty for GDB. Type "show warranty" for details. This GDB was configured as "i386-apple-darwin"... (gdb) set kext-symbol-file-path /tmp (gdb) add-kext PanicDriver/build/Debug/PanicDriver.kext add symbol table from file "/tmp/com.apple.dts.driver.PanicDriver.sym" (y or n) y Reading symbols from /private/tmp/com.apple.dts.driver.PanicDriver.sym...Reading symbols from PanicDriver/build/Debug/PanicDriver.kext.dSYM/ Contents/Resources/DWARF/PanicDriver...done. done. (gdb) |
Repeat the add-kext command for each of your KEXT's dependencies as shown in the panic log.
If your project is configured to produce stabs debugging information instead of DWARF, use the add-symbol-file command instead as shown in Listing 7. stabs debugging information was the default on systems older than Mac OS X 10.5 Leopard.
Listing 7 Loading the symbol file into GDB when using stabs debugging information.
localhost:~ me$ gdb /Volumes/KernelDebugKit/mach_kernel GNU gdb 6.3.50-20050815 (Apple version gdb-573) (Fri Oct 20 15:50:43 GMT 2006) Copyright 2004 Free Software Foundation, Inc. GDB is free software, covered by the GNU General Public License, and you are welcome to change it and/or distribute copies of it under certain conditions. Type "show copying" to see the conditions. There is absolutely no warranty for GDB. Type "show warranty" for details. This GDB was configured as "i386-apple-darwin"... (gdb) add-symbol-file /tmp/com.apple.dts.driver.PanicDriver.sym add symbol table from file "/tmp/com.apple.dts.driver.PanicDriver.sym" at (y or n) y Reading symbols from /tmp/com.apple.dts.driver.PanicDriver.sym...done. (gdb) |
In the case of I/O Kit C++ function names, you may find it helpful to unmangle the names to make them more readable. The command set print asm-demangle on is a handy way to do this. This command controls the demangling of C++ and Objective-C names in disassembly listings.
Display the instruction located at the instruction pointer (EIP) using the "examine memory as instruction" command x/i <address>. Depending on the type of exception, this will either be the instruction that caused the exception or the one immediately following. An example is shown in Listing 8.
Listing 8 Disassembling from the instruction pointer.
(gdb) set print asm-demangle on (gdb) x/i 0x223ab275 0x223ab275 <com_apple_dts_driver_PanicDriver::start(IOService*)+77>: movl $0x7fff,(%eax) (gdb) |
Next, for each return address in the backtrace, disassemble the function containing that address using the command disass <address>. Listing 9 shows the results of disassembling the backtrace shown in Listing 1.
Listing 9 Decoding the backtrace.
(gdb) disass 0x12b0fa Dump of assembler code for function panic: 0x0012af54 <panic+0>: push %ebp ... 0x0012b0f5 <panic+417>: call 0x1ae39f <Debugger> 0x0012b0fa <panic+422>: mov 0x4d5278,%eax ... (gdb) disass 0x1a8cd4 Dump of assembler code for function kernel_trap: 0x001a872a <kernel_trap+0>: push %ebp ... 0x001a8ccf <kernel_trap+1445>: call 0x12af54 <panic> 0x001a8cd4 <kernel_trap+1450>: add $0xcc,%esp ... (gdb) disass 0x19ede5 Dump of assembler code for function trap_from_kernel: 0x0019edcb <trap_from_kernel+0>: mov %esp,%eax ... 0x0019ede0 <trap_from_kernel+21>: call 0x1a872a <kernel_trap> 0x0019ede5 <trap_from_kernel+26>: mov %edi,%esp ... (gdb) disass 0x223ab275 Dump of assembler code for function _ZN32com_apple_dts_driver_PanicDriver5startEP9IOService: 0x223ab228 <com_apple_dts_driver_PanicDriver::start(IOService*)+0>: push %ebp ... 0x223ab272 <com_apple_dts_driver_PanicDriver::start(IOService*)+74>: mov -0xc(%ebp),%eax 0x223ab275 <com_apple_dts_driver_PanicDriver::start(IOService*)+77>: movl $0x7fff,(%eax) ... (gdb) disass 0x410db2 Dump of assembler code for function _ZN9IOService14startCandidateEPS_: 0x00410d3c <IOService::startCandidate(IOService*)+0>: push %ebp ... 0x00410dac <IOService::startCandidate(IOService*)+112>: call *0x2cc(%eax) 0x00410db2 <IOService::startCandidate(IOService*)+118>: xor %edx,%edx ... (gdb) disass 0x412c47 Dump of assembler code for function _ZN9IOService15probeCandidatesEP12OSOrderedSet: 0x004125a8 <IOService::probeCandidates(OSOrderedSet*)+0>: push %ebp ... 0x00412c41 <IOService::probeCandidates(OSOrderedSet*)+1689>: call *0x3c4(%eax) 0x00412c47 <IOService::probeCandidates(OSOrderedSet*)+1695>: mov %al,-0x3a(%ebp) ... (gdb) disass 0x4124ab Dump of assembler code for function _ZN9IOService14doServiceMatchEm: 0x00412334 <IOService::doServiceMatch(unsigned long)+0>: push %ebp ... 0x004124a5 <IOService::doServiceMatch(unsigned long)+369>: call *0x3c0(%eax) 0x004124ab <IOService::doServiceMatch(unsigned long)+375>: mov (%ebx),%eax ... (gdb) disass 0x411127 Dump of assembler code for function _ZN15_IOConfigThread4mainEPS_: 0x00411016 <_IOConfigThread::main(_IOConfigThread*)+0>: push %ebp ... 0x00411121 <_IOConfigThread::main(_IOConfigThread*)+267>: call *0x3d4(%edx) 0x00411127 <_IOConfigThread::main(_IOConfigThread*)+273>: jmp 0x411142 <_IOConfigThread::main(_IOConfigThread*)+300> ... (gdb) disass 0x19ebdc Dump of assembler code for function call_continuation: 0x0019ebc0 <call_continuation+0>: mov 0x4(%esp),%eax ... 0x0019ebda <call_continuation+26>: call *%eax 0x0019ebdc <call_continuation+28>: add $0x10,%esp ... (gdb) |
Then locate the function containing the instruction pointed to by the instruction pointer. In this example, this is the function com_apple_dts_driver_PanicDriver::start beginning at the address 0x223ab228. Since the saved instruction pointer from a page fault generally points to the instruction that generated the exception, the movl instruction at 0x223ab275 is the suspect. The instruction attempts to write the value 0x7fff to the address pointed to by EAX. The panic log shows EAX contains the invalid pointer value 0xdeadbeef, which explains the cause of the page fault exception. This diagnosis is consistent with the earlier result from disassembling the single instruction located at the instruction pointer.
Also examine the other disassembled functions, looking for the instruction immediately before the address from the backtrace. Note that this instruction should be some form of branch instruction. To understand why, recall that the backtrace is a listing of the return addresses saved prior to executing a function call. If the disassembly shows something other than a branch instruction, this is a clue that you may not have generated your symbol file correctly, or that the operating system or Kernel Debug Kit version does not match the panicked machine. (This guideline does not apply to the leaf function which contains the instruction that generated an exception.)
Another handy technique is to use the "examine memory as instruction" command to disassemble instructions near the address from the backtrace as in Listing 10.
Listing 10 Disassembling a block of instructions.
(gdb) x/16i 0x19ebdc-32 0x19ebbc <thread_exception_return+12>: add %eax,(%eax) 0x19ebbe <thread_exception_return+14>: add %dl,0x424448b(%eax) 0x19ebc4 <call_continuation+4>: mov 0x8(%esp),%edx 0x19ebc8 <call_continuation+8>: mov 0xc(%esp),%ecx ... 0x19ebd9 <call_continuation+25>: push %edx 0x19ebda <call_continuation+26>: call *%eax 0x19ebdc <call_continuation+28>: add $0x10,%esp 0x19ebdf <call_continuation+31>: mov %gs:0x4,%eax ... |
One thing to be aware of when using this technique is that the first few instructions may not be correct because the disassembly is likely to begin in the middle of an instruction.
Deciphering a Panic Log from a PowerPC-based Mac
In our example, a data access exception occurred with the program counter containing 0x1918F504. Looking at the list of loaded kernel extensions, the closest match is com.apple.dts.driver.PanicDriver which is located between addresses 0x1918e000 and 0x1918ffff. Then, because this is a data access exception, DAR contains the address which could not be accessed. In this case, it was an attempt to access memory at 0xdeadbeef that triggered the exception.
The kernel and kernel extensions on a running Mac OS X system contain just enough symbolic information to resolve dependencies between them. In order to translate all of the return addresses in Mac OS X kernel code, download the Kernel Debug Kit corresponding to the version and build of Mac OS X on the panicked system. Kernel Debug Kits contain symbol-rich versions of the kernel and many I/O Kit families. Mount the Kernel Debug Kit disk image, and you're ready to go.
Your own kernel extensions will already have full line number and function name information provided they were built using Xcode's Debug build configuration. On Mac OS X 10.5 and later, be sure the Debug Information Format build setting in your Xcode target settings is set to DWARF with dSYM File.
Generating symbol files is done using the kextload command as illustrated in Listing 11. The -s option specifies the directory where to write the symbol files. The -n option causes kextload to prompt for the load address of each kernel extension and its dependencies.
Alternatively, you can use the createsymbolfiles script included as part of each Kernel Debug Kit to simplify symbol file generation as shown in Listing 12.
Listing 11 Generating the symbol file using kextload.
localhost:~ me$ kextload -c -e -k /Volumes/KernelDebugKit/mach_kernel -n -z -r /Volumes/KernelDebugKit/ -s /tmp PanicDriver/build/Debug/PanicDriver.kext kextload: notice: extension PanicDriver/build/Debug/PanicDriver.kext has debug properties set enter the hexadecimal load addresses for these modules: com.apple.dts.driver.PanicDriver: 0x1918e000 |
Listing 12 Generating the symbol file using createsymbolfiles.
localhost:~ me$ /Volumes/KernelDebugKit/createsymbolfiles -s /tmp PanicDriver/build/Debug/PanicDriver.kext kextload: notice: extension PanicDriver/build/PanicDriver.kext/ has debug properties set enter the hexadecimal load addresses for these modules: com.apple.dts.driver.PanicDriver: 0x1918e000 |
This results in a separate symbol file for each module, named <module-name>.sym.
Next, start GDB and load the symbol files using the add-kext command as demonstrated in Listing 13. The set kext-symbol-file-path command tells GDB where to look for .sym symbol files. By default, GDB will look for symbol files in the same directory as the KEXT being loaded by add-kext.
Listing 13 Loading the symbol file into GDB.
localhost:~ me$ gdb /Volumes/KernelDebugKit/mach_kernel GNU gdb 6.3.50-20050815 (Apple version gdb-960) (Sun May 18 18:41:56 UTC 2008) Copyright 2004 Free Software Foundation, Inc. GDB is free software, covered by the GNU General Public License, and you are welcome to change it and/or distribute copies of it under certain conditions. Type "show copying" to see the conditions. There is absolutely no warranty for GDB. Type "show warranty" for details. This GDB was configured as "powerpc-apple-darwin"... (gdb) set kext-symbol-file-path /tmp (gdb) add-kext PanicDriver/build/Debug/PanicDriver.kext add symbol table from file "/tmp/com.apple.dts.driver.PanicDriver.sym"? (y or n) y Reading symbols from /private/tmp/com.apple.dts.driver.PanicDriver.sym...Reading symbols from PanicDriver/build/Debug/PanicDriver.kext.dSYM/ Contents/Resources/DWARF/PanicDriver...done. done. (gdb) |
Repeat the add-kext command for each of your KEXT's dependencies as shown in the panic log.
If your project is configured to produce stabs debugging information instead of DWARF, use the add-symbol-file command instead as shown in Listing 14. stabs debugging information was the default on systems older than Mac OS X 10.5 Leopard.
Listing 14 Loading the symbol file into GDB when using stabs debugging information.
localhost:~ me$ gdb /mach_kernel GNU gdb 6.3.50-20050815 (Apple version gdb-573) (Fri Oct 20 15:54:33 GMT 2006) Copyright 2004 Free Software Foundation, Inc. GDB is free software, covered by the GNU General Public License, and you are welcome to change it and/or distribute copies of it under certain conditions. Type "show copying" to see the conditions. There is absolutely no warranty for GDB. Type "show warranty" for details. This GDB was configured as "powerpc-apple-darwin"... (gdb) add-symbol-file /tmp/com.apple.dts.driver.PanicDriver.sym add symbol table from file "/tmp/com.apple.dts.driver.PanicDriver.sym" at (y or n) y Reading symbols from /tmp/com.apple.dts.driver.PanicDriver.sym...done. (gdb) |
In the case of I/O Kit C++ function names, you may find it helpful to unmangle the names to make them more readable. The command set print asm-demangle on is a handy way to do this. This command controls the demangling of C++ and Objective-C names in disassembly listings.
Display the instruction located at the program counter (PC) using the "examine memory as instruction" command x/i <address>. Depending on the type of exception, this will either be the instruction that caused the exception or the one immediately following. An example is shown in Listing 15.
Listing 15 Disassembling from the program counter.
(gdb) set print asm-demangle on (gdb) x/i 0x1918F504 0x1918f504 <com_apple_dts_driver_PanicDriver::start(IOService*)+120>: stw r0,0(r2) (gdb) |
Next, for each return address in the backtrace, display the instruction located immediately prior to that address using the command x/i <address>-4. This will yield the name of the function in which the address is located. Note that each instruction disassembled from the backtrace should be some form of branch instruction. To understand why, recall that the backtrace is a listing of the return addresses saved prior to executing a function call. If the disassembly shows something other than a branch instruction, this is a clue that you may not have generated your symbol file correctly, or that the operating system version is not the same as on the panicked machine.
Listing 16 shows the results of decoding the backtrace shown in Listing 3.
Listing 16 Decoding the backtrace.
(gdb) x/i 0x1918F4F0-4 0x1918f4ec <com_apple_dts_driver_PanicDriver::start(IOService*)+96>: bl 0x1918f56c <com_apple_dts_driver_PanicDriver::start(IOService*)+224> (gdb) x/i 0x0034380C-4 0x343808 <IOService::startCandidate(IOService*)+188>: bctrl (gdb) x/i 0x00344960-4 0x34495c <IOService::probeCandidates(OSOrderedSet*)+2228>: bctrl (gdb) x/i 0x00346810-4 0x34680c <IOService::doServiceMatch(unsigned long)+524>: bctrl (gdb) x/i 0x00345930-4 0x34592c <_IOConfigThread::main(_IOConfigThread*)+352>: bctrl (gdb) x/i 0x000B05D4-4 0xb05d0 <Call_continuation+16>: blrl (gdb) |
Summary
Using the techniques discussed in this technote, it is possible to perform an effective post-mortem analysis of a kernel panic. While the information in a panic dump may have been cryptic at first, it should now be just another debugging tool available to the Mac OS X developer.
References
The Design and Implementation of the 4.4BSD Operating System, McKusick et al., Addison-Wesley, 1996.
Kernel Extension Programming Topics
Intel 64 and IA-32 Architectures Software Developer’s Manual, Volume 1: Basic Architecture, Intel Order Number 253665-027US, revised April 2008.
Intel 64 and IA-32 Architectures Software Developer’s Manual, Volume 3A: System Programming Guide, Part 1, Intel Order Number 253668-027US, revised July 2008.
PowerPC Microprocessor Family: The Programming Environments For 32-Bit Microprocessors, IBM document G522-0290-01 revised 02/21/2000.
Programming Environments Manual For 32-Bit Implementations of the PowerPC Architecture, Freescale Semiconductor document MPCFPE32B, revision 3, 9/2005.
Downloadables
PanicDriver sample code ("tn2063_PanicDriver.zip", 37.1K)
Document Revision History
| Date | Notes |
|---|---|
| 2008-08-14 | Added content for Intel-based Macs and updated for Leopard. |
| 2008-08-13 | Added content for Intel-based Macs and updated for Leopard. |
| 2002-11-11 | New document that addresses kernel panics: what they are and how to debug the code that caused the panic. |
Copyright © 2008 Apple Inc. All Rights Reserved. Terms of Use | Privacy Policy | Updated: 2008-08-14