Retired Document
Important: This document may not represent best practices for current development. Links to downloads and other resources may no longer be valid.
Getting Started with Shark
Starting to use Shark is a relatively simple process. You only need to choose one or two items from menus and press a big “Start” button in order to start sampling your applications. This chapter describes these basic steps and a few other general Shark features, such as its preferences.
Main Window
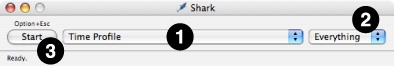
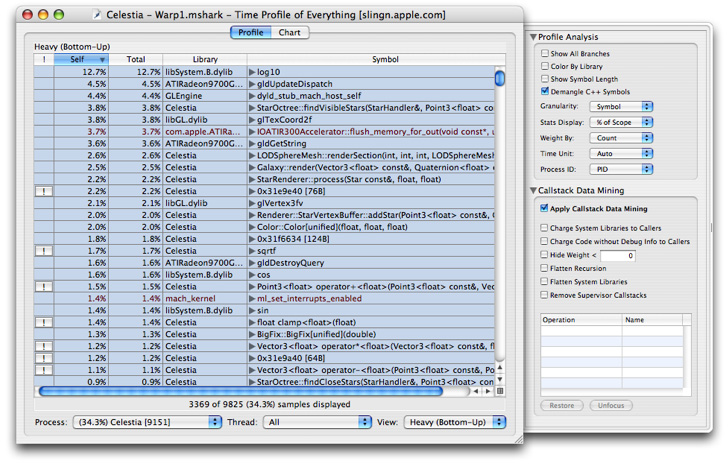
After launching Shark, you will be presented with Shark’s main window, as illustrated in Figure 1-1. The default sampling configuration is timer-based sampling (Time Profile) of everything running on the system. By default, the Time Profile configuration uses a 1 ms timer as the trigger for sampling and will record for 30 seconds (30,000 samples per processor). Opening the Sampling Configuration menu (#1) allows you to select from various built-in profiling configurations. Here is a list:
Time Profile— This configuration, the default, performs timer-based sampling, interrupting your system after a regular interval and taking a sample of what is executing. It is a great starting point, as it allows you to very quickly see what code in your application is actually executing most frequently. Knowing this is the first step to successfully optimizing CPU-bound applications. See Time Profiling for more information.
System Trace— This configuration records an exact trace of calls into the Mac OS X kernel by your program, and which threads are running. It is useful for examining your program’s interactions with Mac OS X and for visualizing how your threads are interacting in multithreaded programs. System Trace is discussed in depth in System Tracing.
Time Profile (All Thread States)— This variation on time profiling also records the state of all blocked, inactive threads. As a result, it’s a great way to see how much and why your threads are blocked. This is quite helpful in the development of multithreaded programs that do a lot of synchronization. This configuration is described in Time Profile (All Thread States).
Malloc Trace— If your program allocates and deallocates a lot of memory, performance can suffer and the odds of accidental memory leaks increase. Shark can help you find and analyze these allocations. Malloc Trace talks about this more.
Static Analysis— Shark can provide some basic optimization hints without actually running code. See Static Analysis for more information.
Java Profiling— Because Java programs run within the Java Virtual Machine (JVM), normally sampling them with Shark produces little useful information. However, Shark also includes several configurations that simulate the normal Time Profile, Malloc Trace, and even an exact trace of method calls, but while collecting information about what the JVM is executing instead of the native machine. A full description of these options and how to attach Shark to your Java programs is given in Using Shark with Java Programs.
Hardware Measurements— The L2 cache miss and Processor Bandwidth (x86 systems) or Memory Bandwidth (PowerPC systems) configurations measure memory system activity using counters built into the hardware. They are a great way to see how your program is being slowed because of poor cache memory use. See Event Counting and Profiling Overview for an overview of Shark’s counter measurement capabilities.
These built-in configurations are adequate for sampling most applications. After you have used Shark for awhile, however, you may decide that you would like to sample something in your application that is not covered by the built-in collection of options. In particular, you may want to perform hardware measurements using counters that are not used by the default hardware measurement configurations. The process for building your own configurations is described in Custom Configurations. This process is complex enough that you should probably familiarize yourself with Shark before attempting the creation of configurations.
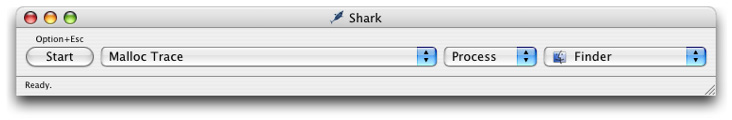
By default, Shark samples your entire system, as indicated by the “Everything” item selected for you in the Target pop-up menu (#2). Popping open this menu allows you to select a specific process or file (Figure 1-2). You may also choose different targets using the keyboard: Command-1 for everything, Command-2 for an executing process, and Command-3 for a file. For a Time Profile, it is unnecessary to select a specific target, but others like Malloc Trace and Static Analysis require you to target a specific process or file. If you select the “Process” target, you can also choose to launch a new process. See Process Attach and Process Launch for full instructions on the process attaching and launching target selection techniques.
Mini Configuration Editors
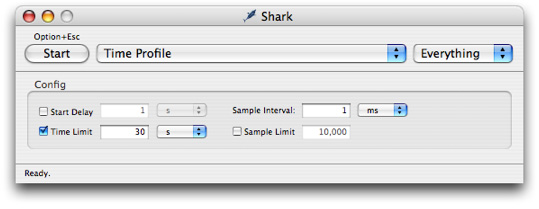
Each configuration typically has a few parameters that are frequently modified. Shark allows you to edit these easily using the mini configuration editors associated with each configuration. You can enable mini configuration editors by selecting the Config→Show Mini Config Editor menu item (Command-Shift-C). Most mini configuration editors are similar to the one depicted in Shark Preferences, but all have small configuration-specific variations. The selection of controls available in each min configuration editor are described in the chapters associated with each type of configuration.
Perform Sampling
After you choose what you would like to sample (or trace, with some configurations) and how, then actually using Shark to sample your program is extremely simple. There are two main ways to start sampling:
Click the Start button (#3 in Main Window).
Press the current “Hot Key” (Option-Esc, by default).
Shark will emit a brief tone and the Shark icon in the dock will turn bright red to let you know that Shark is now actively sampling. At this point, you should exercise your program appropriately to trigger the execution of code that you want to measure. Sometimes this may require no active input on your part, but if you are measuring something like user interface performance then you may need to manually perform several steps while Shark samples.
After you have finished sampling the interesting portion of your program, you will need to stop Shark’s sampling. Again, this is a simple process. You will typically use one of the following three options:
Click the Stop button, which is what the “Start” button becomes once sampling has started.
Press the current “Hot Key” (Option-Esc, by default).
Wait for the maximum profiling time or number of samples specified by the configuration to pass. When either of these conditions is met, Shark will automatically stop.
After Shark stops sampling, you will see a progress bar appear at the bottom of the main Shark window as samples are processed and symbols are gathered. During processing, Shark sorts samples both by process and by thread. Shark also looks up the symbols corresponding to each sampled address and caches any other information that may be needed for later browsing of your program. All of this work is done only after sampling is complete, in order to minimize the system overhead of Shark during sampling.
If you would like to use the “Hot Key” technique, but your application already uses Option-Esc for another purpose, then you should reassign Shark’s “Hot Key” to another key combination. See Shark Preferences for information on how to do this.
In addition to the basic timing options shown here, Shark also offers many other techniques for very fine selection of the time used for Shark’s sampling, should you need more control. See Advanced Profiling Control if you find that the basic start/stop operation described here is not enough to focus Shark’s sampling on the parts of your application that you would like to measure.
Session Windows and Files
Once you’ve recorded samples or a trace, Shark will open up a new session window to display the results. Depending upon the configuration you chose, the appearance of this window will vary. See the chapter on the particular configuration that you chose for more information (in Time Profiling, System Tracing, and Other Profiling and Tracing Techniques). Nevertheless, all session windows have some basic features in common.
Shark allows you to work with multiple sampling sessions at a time, displaying a separate window for each session. This is useful for comparing two or more sampling sessions side-by-side. The currently displayed session can be changed using the Window menu. By default, sessions are listed in the order they are loaded or created. In addition, each new session is given a unique name, in the format of “Session # - Configuration.”
Session Files
Shark makes it easy to save any sessions to .mshark “session” files at any time. There are several reasons why you might want to do this: for later analysis, to keep as archives to track performance regressions, or to share your results. These files are particularly convenient when attached to performance bug reports, as a session file that records samples of slow code offers a simple and effective way to document the performance problem. Each session file contains all of the necessary data (symbols, source, and — optionally — even program text, see Shark Preferences) needed to display and explore the session on any computer running Mac OS X, independent of that system’s hardware or software configuration. Because of this, you can freely share your session files with any other coworkers using Shark, without regard to what type of Mac they might have.
A session is saved to disk as a single, compressed file when you use the File→Save menu item (Command-S). The first time you save a session, you will need to name the new session. This name will be used to name the new session file and to replace the “Session #” part of the original window name. If you want to save the session again at any point in time using a new name, then just choose the File→Save as... menu item (Command-Shift-S).
You may even choose to have Shark email your session file to someone else at any time, using the File→Mail This Session menu item. When chosen, this will send your default email program a remote message asking it to start up a new email message for sending. Subsequently, Shark will automatically attach a session file of the current session (saving it first, if necessary). You may then finish composing your message and send it using the normal procedures for your email program.
Session Information Sheet
You can see many underlying details about the session by using File→Get Info (Command-I). This will drop down the sheet shown in Session Report over the top of your session window.
This panel contains four tabbed panes:
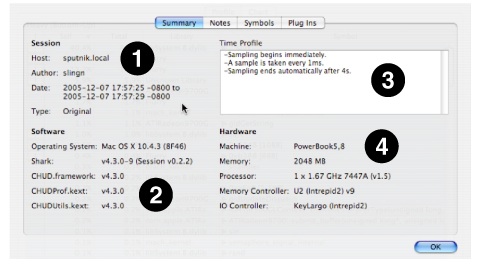
Summary— Because Shark records samples at a very low level, the configuration of the sampled system can often be critical when interpreting results. This pane, shown in Session Report, displays many facts about the system setup when the session was originally recorded. This is very useful if you send a session file to another person, as they can call up your system’s configuration with a single key combination. Four different types of information are presented in the four quadrants of the view:
Basic Statistics— This section of the pane contains basic information about the system at the time the session was recorded. The system’s name, the current user, date, and time are available here.
Software Configuration— This shows version information about Shark and the underlying Mac OS X and frameworks.
Sampling Configuration— This shows a text description of the configuration used for recording the session. This is the same sort of summary description that you can see in the upper right corner of the custom configuration window (as shown in The Config Editor).
Hardware Configuration— This shows key characteristics about the machine used for sampling and its underlying hardware components: processor, main memory, memory controller, I/O subsystem controller, and such.
Notes— This pane is just a text box. You can type any notes and messages that you want here, and they will be saved with the session file. This is helpful when you would like to record some additional information about how the session was recorded, making notes about insights gained by you during analysis, and the like.
Symbols— Here you can see a list of all binaries (application binaries, dynamic libraries, and the like) that were sampled during the session. It also provides controls for selecting and “symbolicating” (adding symbols to) samples taken from those binaries. See Manual Session Symbolication for instructions on how to do this.
Plug Ins— This pane displays a list of the Shark PlugIns that were used to record, analyze, and view the session. See Custom Configurations for more information on these.
Session Report
At any time, you may open a window containing a brief text summary of your session’s findings by using the File→Generate Report... menu item (Command-J). This report includes some information about what the configuration was, the underlying system configuration, and a brief summary of the recorded samples. If you need to give a quick overview of a session to someone who does not have Shark on their computer, then this can be a useful command. Otherwise, it is probably easier just to send them your entire session file.
Advanced Settings Drawer
Most session windows in Shark have a variety of settings that can modify how the information in that window is presented. For consistency, the controls for these settings are always presented in the Advanced Settings Drawer, a drawer that can slide in and out of the right side of the session window by choosing the Window→Show Advanced Settings menu item (Command-Shift-M). An example is depicted below in Main Window. The controls presented will vary depending upon the current session viewer visible in the window, and so instructions on how to use these controls are provided in sections following the descriptions of the session viewers themselves.
Shark Preferences
Shark’s global preferences are accessed from the Shark→Preferences... menu item. This window allows you to set some global options that Shark uses while recording and displaying all of your sessions. Shark’s preference panel is divided into four tabbed panes:
Appearance— The first tab lets you control the appearance of Shark’s main window (1–2) and session windows (3–5).
Sort Process Lists By— Choose whether you want the process menu in Shark’s main window to be sorted by name or process ID here.
Show Only Owned Processes— This option, selected by default, reduces clutter in the process menu by removing root (mostly daemon) processes and any processes from other users, on a multi-user system.
Alternating/Solid Table Background— For tabular session window views, such as the profile browsers and code browsers described in Profile Browser and Code Browser, Shark can use either a solid background color behind the text or alternate between a color and white on every row. Select the viewing option that you prefer here.
Background Color— Choose either the solid background color or the color to alternate with white by clicking on this color well.
Grid Color— Choose the color to use as a grid between rows in tabular session views by clicking on this color well. If it is the same as the background color, previous, then the grid will essentially disappear.
Figure 1-6 Shark Preferences — Appearance 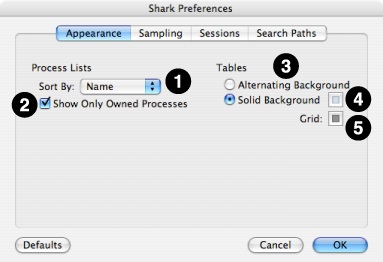
Sampling— The options in this tab let you vary some of Shark’s behaviors as it starts and stops sampling.
Play Alert Sound— Choose whether or not you want to have Shark play an alert sound when you start and stop sampling. This is on by default, but if you are sampling for a very short time or are testing out something like an audio application, you may want Shark to stay quiet, instead. If you choose to have Shark play these alert sounds, then you can choose any alert sound installed on your system using the popup menu.
Auto Hide/Unhide— When checked, this option causes Shark to automatically hide its windows whenever sampling starts and unhide them afterwards. It is useful if you need to see another application covering the entire screen during sampling. Because you cannot press the “Stop” button while Shark is hidden, this option is of most use if you use the “hot key” chosen below to start and stop Shark.
Remain in Background— Shark normally brings itself to the front when sampling completes. This means that it will be the main application while it analyzes samples and then displays a session window. Generally, this is the desirable behavior, because most users want to examine their sampled sessions immediately. However, if you want to quickly capture several sessions in a row, then this option will force Shark to stay in the background while it processes samples. Because you cannot press the “Stop” button without bringing Shark to the front first, this option is of most use if you use the “hot key” chosen below to start and stop Shark.
Hot Key Capture— The current “hot key” used to start Shark, as described in Perform Sampling, can be set here. Option-Esc is the default, because it is rarely used by other programs, but you may want to use a different key if this collides with one of your own key combinations. Press the Capture button and then press the new key combination immediately afterwards to change the setting.
Cache Options— Caching of Program Text, Source Files, and Exited Processes allows Shark to provide useful information for short-lived processes after they complete, but may require more memory usage and increase sample processing time. You can disable these features if your applications of interest will not normally exit during sampling.
Figure 1-7 Shark Preferences — Sampling 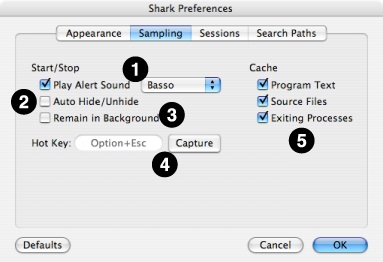
Sessions— This tab contains some options about the saving of source files.
Ask About Unsaved Sessions— With Shark, you can optionally disable the usual behavior of asking if you want to individually save each session file when closing it or quitting Shark. Some users tend to examine their data right after sampling, and therefore will rarely need to save Shark session files. If you tend to work this way, then you might find the default behavior annoying and wish to uncheck this box.
Embed Source Files— Shark allows you to optionally embed source information right into your sessions when you save them, as discussed in Session Files, allowing anyone who opens the session to see source code, even if the source files are not actually available on their system at the time. This is usually very convenient, but may be problematic if you have a large amount of source code — since the session file can become enormous — or if you may be sending the file to a person who does not have permission to see all of the source. In these situations, you can choose not to include source code. For your convenience, this preference lets you tell Shark to never embed source, to always embed source, or to ask each time if you want to embed source (the default).
Figure 1-8 Shark Preferences — Sessions 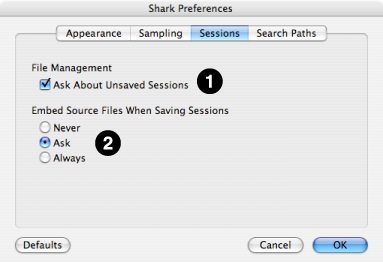
Search Paths— This tab lets you add (using the “+” button) or delete (using the “–” button) default directories where Shark will search for various types of files when it needs them. Shark lets you specify default paths for four different types of files:
Source— Shark will usually find source files automatically if they are not moved between compilation and session viewing times. If you must move the source at all, however, then you will need to specify a path to the new source location here so that Shark can find your source. Probably the most common reason why you might need to use this is if you compile the source on one system and then execute your code and examine your session on another.
Kext— This tells Shark where to look for kernel extension binaries in order to find debugging information for non-user code. By default, the standard system paths for kernel extensions are included here.
Symbol-Rich— Shark will use these paths when it looks for symbol-rich binary files during attempts at Symbolication of sessions, as described in Automatic Symbolication Troubleshooting.
UUID Server— Shark can use these paths to automatically look up symbol-rich binary files and libraries by matching the UUID information in the stripped version of the binary to the symbol-rich versions of the files located here.
Figure 1-9 Shark Preferences — Search Paths 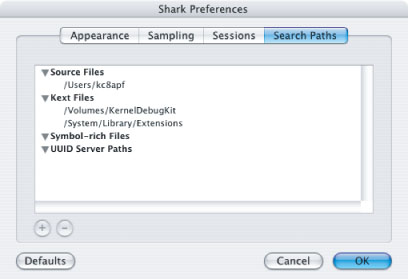
Copyright © 2012 Apple Inc. All Rights Reserved. Terms of Use | Privacy Policy | Updated: 2012-07-23