Retired Document
Important: This document may not represent best practices for current development. Links to downloads and other resources may no longer be valid.
New Features in Instruments 4.0
This chapter provides a summary of some of the new features in Instruments 4.0.
Data Mining Focus Options
In call tree data mining, you can now use Instruments to focus in on selected information in a call tree. You can choose the new focus options from the contextual menu for a call tree symbol.
To view the contextual menu for a symbol in a call tree:
Display the call tree.
Hold down the Control key.
Select the desired symbol.
The focus options all begin with the phrase “Focus on”, as shown in Figure 1-1.

You select one of five focus options to focus on specific parts of the call tree:
Focus on subtree
Displays only the subtree under the selected symbol.
Focus on calls made by <symbol name>
Displays only the subtrees with calls made by the selected symbol.
Focus on callers of <symbol name>
Displays only the subtrees with callers of the selected symbol.
Focus on calls made by <library name>
Displays only the subtrees with calls made by symbols in the selected symbol’s library.
Focus on callers of <library name>
Displays only the subtrees with callers of symbols in the selected symbol’s library.
DTPerformanceSession Framework
You can use the new DTPerformanceSession framework in your Mac app to gather performance data that can be opened and viewed in the Instruments application. The C API for DTPerformanceSession can use instruments such as Time Profiler, Allocations, Leaks, and Activity Monitor. Additional instruments will be added to the API in future releases. You can target your own process or other processes. You can use the API to write a custom tool that uses Core Foundation, such as a regression harness.
The DTPerformanceSession output format is a .dtps bundle that you can open in Instruments to create a full-featured trace document. The bundle itself contains no symbol information and is valid only until you rebuild the application. If you want to save the trace data in a .dtps bundle, open it in Instruments and save the trace document.
DTPerformanceSession is accompanied by a command-line tool called iprofiler. The iprofiler tool supports:
Attaching to a currently running process
Launching a process that will only run during the performance measurement
Profiling all currently running processes
For more information about iprofiler, see the iprofiler man page.
To use DTPerformanceSession, you must link your application to the framework. The DTPerformanceSession framework is located here:
/Library/Developer/4.0/Instruments/Frameworks/DTPerformanceSession.framework |
In your code, you need to import the API header file:
#import <DTPerformanceSession/DTPerformanceSession.h> |
Listing 1-1 contains an example that shows how to use DTPerformanceSession.
Listing 1-1 DTPerformanceSession example
CFStringRef process = CFStringCreateWithFormat(kCFAllocatorDefault, NULL, CFSTR("%d"), getpid()); |
CFErrorRef error = NULL; |
DTPerformanceSessionRef session = DTPerformanceSessionCreate(NULL, process, NULL, &error); |
DTPerformanceSessionAddInstrument(session, (CFStringRef)@DTPerformanceSession_TimeProfiler, NULL, NULL, &error); |
CFMutableArrayRef instrumentIDs = CFArrayCreateMutable(kCFAllocatorDefault, 0, &kCFTypeArrayCallBacks); |
CFArrayAppendValue(instrumentIDs, @DTPerformanceSession_TimeProfiler); |
DTPerformanceSessionStart(session, instrumentIDs, &error); |
// do something in your app |
DTPerformanceSessionStop(session, instrumentIDs, &error); |
DTPerformanceSessionSave(session, (CFStringRef)@"/tmp/myAppProfile", &error); |
DTPerformanceSessionDispose(session, &error); |
System Trace
System Trace is a new Instruments template that uses several instruments to profile aspects of OS X that could be affecting application performance. The instruments provide information on system calls, thread scheduling, and virtual memory (VM) operations. For example, game developers could use System Trace to find out why their application frame rate is dropping unexpectedly, or why their code is not executing on the CPU in a timely fashion.
System Trace introduces a new UI feature called the strategy control bar, located directly above the track pane. You can use the buttons at the left end of this bar to display the track view using one of two strategies:
Instruments strategy (selected by the first button) displays event density for each instrument in its own track. This is the default strategy.
Threads strategy (selected by the second button) displays scheduling state for individual threads, with markers for significant events.
Each instrument contributes information to each thread track. To show information about a specific event in the timeline, click its marker. The track color indicates the thread scheduling state. The button at the right end of the strategy bar displays a legend for these colors.
The detail view displays Trace Highlights, a set of useful graphs, in addition to sample data.
Figure 1-2 shows a trace document that uses the threads strategy. The threads strategy button is selected.

Launching from Xcode
Xcode 4 and Instruments 4 are integrated. Within Xcode, you can launch Instruments to profile a specific Xcode target by choosing the Product > Profile command or pressing Command-I. When you profile a target in a new project, by default Xcode builds the target for release using the DWARF with dSYM file format to generate debugging symbols.
When Instruments launches, it displays a dialog that allows you to choose a template for profiling your specific target, as shown in Figure 1-3.

The Profile dialog is similar in appearance to the dialog you see when you launch Instruments in the Finder. The list of templates displayed in the Profile dialog is filtered appropriately for the Xcode target. The Profile dialog also has a Document section with two choices: Open and Recent. Instruments remembers other recent documents used for the same target, allowing you to choose a different document in which the new profile is saved.
After recording trace data, if you leave the resulting trace document open and profile again, Instruments assumes you want to add a new run to the same trace document. The settings for the Profile command in Xcode can be modified by editing the active scheme in your Xcode project. For information about how to edit schemes and modify settings for the Profile command, seeBuilding and Running Your Code in Xcode Overview.
Flag Table
Instruments has always supported the use of various types of flags in the track pane. Instruments 4.0 introduces a new window that contains a table in which you can browse, search for, and display different types of flags. To display this flag table, choose View > Flag Table or press Shift-Command-T.

You can use the checkboxes to select which individual flags Instruments should display. You can also use the Displayed Flags menu to choose the types of flags to display.
The button located to the right of the Displayed Flags menu is the time filter button. When you click the time filter button, any two or more flags can be selected and used to span the interval from the time of the earliest selected flag to the time of the last selected flag. This filter allows you to find the data that was collected during this time interval.
In addition, the flag table has a contextual menu with options to support changing displayed flags and time-filter actions.
Signal Flags
Instruments 4.0 provides macros you can use in your source code to emit signal flags at precise times in the execution of your application. These macros are implemented in user space and are designed for ease of use. When you use Instruments to profile your application, Instruments records this data. To display signal flags in your trace document’s timeline, open the flag table and choose Signal Flags from the Displayed Flags menu.
The signal flag macros are defined in a header file in the DTPerformanceSession framework. You do not need to link your application to this framework in order to use the macros. However, if you do link to DTPerformanceSession, you can use the following directive to import the header in your code:
#import <DTPerformanceSession/DTSignalFlag.h> |
Listing 1-2 contains examples that show how to emit signal flags by calling the DTSendSignalFlag function. The flag names are user defined and appear in the flag table.
Listing 1-2 DTSignalFlag examples
// Point flag (just an event in time) |
DTSendSignalFlag("com.mycompany.mytracepoints.app.point", DT_POINT_SIGNAL, TRUE); |
// Start flag (to mark the start of something) |
DTSendSignalFlag("com.mycompany.mytracepoints.app.start", DT_START_SIGNAL, TRUE); |
// End flag (to mark the end of something) |
DTSendSignalFlag("com.mycompany.mytracepoints.app.end", DT_END_SIGNAL, TRUE); |
Find Field
Instruments has always provided a search field to filter textual data in the detail view. Filtering hides data that does not match the search criteria. The search field is located at the right end of the toolbar.
A new feature in Instruments 4.0 is the find field in the detail view, which highlights matching data in the context of the surrounding data. No data is hidden.
To display the find controls, choose Edit > Find > Find (or press Command-F). To specify a find term, type it into the find field. To find another instance, click one of the arrow buttons. To open a menu of find options, click the magnifying glass in the find field. You can specify the table columns to scan and other criteria, as shown in Figure 1-5.

When you’re finished using the find field, click Done to hide the find controls.
Copying of Rows in a Table
Instruments 4.0 allows you to select and copy arbitrary rows in tables such as sample lists and call trees in the detail view. This feature is useful when filing bug reports or sending email to draw attention to a selected set of data.
You use Command-Click to select each desired row. To copy the text in the selected rows to the Clipboard, you press Command-C. To copy a complete nested set of nodes in a call tree, you select the root node and press Shift-Command-C.
For example, Figure 1-6 shows a set of selected rows in a call tree. Some of the rows are not contiguous.

After copying and pasting this data into a text document, here is the result:
Running (Self) Symbol Name |
8.0ms 3.2% acquireColorWorld |
7.0ms 2.8% CMSTransformConvertComponents |
7.0ms 2.8% CGCMSInterfaceTransformConvertColorComponents |
7.0ms 2.8% ripc_Render |
7.0ms 2.8% CGContextFillRects |
7.0ms 2.8% DTGraphColorImage |
Drag Gestures to Zoom and Time Filter
Instruments 4.0 is capable of tracing events that occur on a nanosecond time scale. To make it easier to view events on small time scales, Instruments has increased the granularity of the track view and has added drag gestures to zoom in and out and define a time filter. When you open a new trace document, note the instructions that appear at the bottom of the track view:
Shift-drag to zoom in
Control-drag to zoom out
Option-drag to define a time filter
For example, Shift-drag means to hold down the Shift key, press and hold the mouse button near an area of interest, drag across the area you want to view, and release the mouse button. Instruments responds by zooming in on the area using a new time scale. As you drag, Instruments displays information about the new scale, such as the number of milliseconds, microseconds, or nanoseconds per pixel.
Similarly, Option-drag means to hold down the Option key, press and hold the mouse button near an area of interest, drag across the area you want to view, and release the mouse button. Instruments responds by defining a time filter. As you drag, Instruments displays the start time and duration of the filter. After you release the mouse button, the detail view contains the samples collected during that precise time interval.
Figure 1-7 shows using a drag gesture to define a time filter in a trace document.
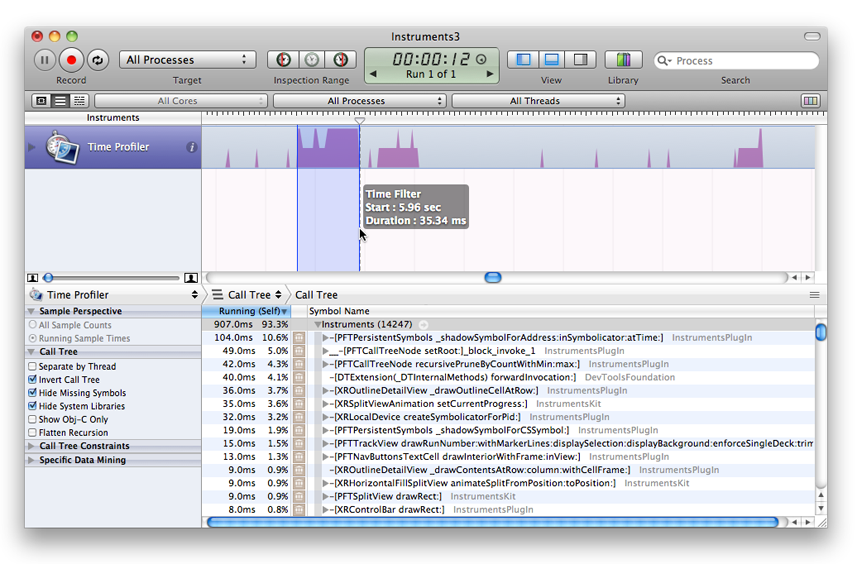
A typical workflow would be to zoom in on an area of interest and then define a time filter to see the call tree samples for that precise interval of the trace.
Source Code Annotation Table
When you use the Time Profiler instrument to find out where your application is spending its time, Instruments annotates your source code with usage information. A new feature in Instruments 4.0 is an annotation table in the extended detail view that’s available when you view your source code in the detail view. The annotation table allows you to view the annotations in ascending or descending order. This order makes it easier to compare source code annotations and find the code that uses the greatest amount of time. If you select an annotation in the table, Instruments displays the relevant code in the detail view.
Figure 1-8 shows using the annotation table to select an annotation and view the code to which it refers.

Copyright © 2012 Apple Inc. All Rights Reserved. Terms of Use | Privacy Policy | Updated: 2012-02-16