Retired Document
Important: This document may not represent best practices for current development. Links to downloads and other resources may no longer be valid.
Custom Configurations
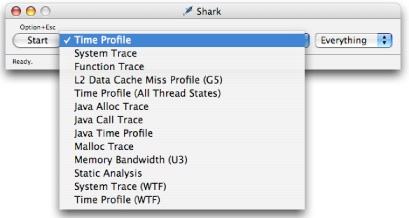
Up until now, you have been using the configuration menu in Shark’s main window (in Figure 7-1) to select from various built-in sampling methods. Each of these sampling methods is called a configuration (abbreviated as “configs"), and Shark saves each configuration as a separate configuration file (which is also often called a “config”). Each config file describes a variety of settings for Shark which enable it to sample or profile your application in a particular way, plus a summary of any hardware requirements that are necessary to use it.
Once you have gained some experience with Shark, you might want to change some of the settings or adjust some of the types of data Shark collects when a particular config is active. For example, you might adjust the default sample rate of the Time Profiling config to sample more often, if your examinations routinely need higher sampling resolution. This chapter gives an overview as to how this can be accomplished using Shark’s sophisticated Configuration Editor.
The Config Editor
The Configuration Editor lets you individually modify settings for any of Shark’s modules, which are called PlugIns. The properties available in each PlugIn differ depending on the nature of the work that particular PlugIn is designed to do. Shark uses three types of PlugIns:
Data Source – These are responsible for collecting and/or generating session data. Many user-modifiable parameters are typically available to control the sampling or profiling performed by these modules.
Analysis – These process raw data and produce intermediate results that are typically shared by more than one viewer. Only a few settings are available for these modules.
Viewer – These display analysis results and performance data. Because users typically want immediate feedback to viewer adjustments, options for these are set by interacting directly with the visible display or through the Advanced Settings Drawer (see Advanced Settings Drawer) attached to each analysis window, instead of here in the Configuration Editor.
Once you have decided that the built-in configs are not sufficient for the work that you are doing, the first step to creating or editing your own configurations is to start the Configuration Editor using one of two techniques:
Select the Config→New... (Command-N) command to start a new config from scratch.
Select Config→Edit... (Command-Option-Shift-C) to modify the current config.
Either technique will bring up the Configuration Editor dialog box, which allows you to examine and modify any part of a configuration. Adding Shortcut Equations points out the four main major parts of this editor:
The Config Listing — This contains an entry for every configuration Shark knows about. This includes documents stored in
/System/Library/Application Support/Shark/Configsfolder, and any custom config documents stored in$USER/Library/Application Support/Shark/Configsin your home folder. Some config file names may be dimmed in the list. This means they are not compatible with the system Shark is currently running on, and therefore cannot be enabled for sampling or profiling, but you can still select and modify them here in the Configuration Editor. The rest of the Configuration Editor controls always modify the selected entry in this list.Next to the main listing, various controls support basic file operations to manage these config files:
You can Duplicate any config in the list. This is usually the best way to begin making a custom config. In fact, selecting “New...“ from the Config Menu just makes a duplicate of the current config in order to provide a starting baseline.
You can Delete any custom config in the list, but not built-in config files. A verification message will appear when you click the Delete button. A deleted config will be erased from the appropriate Configs folder when you finally press the OK button.
You can Rename any custom config in the list, but not built-in config files. A renamed config will be changed in the appropriate Configs folder immediately.
You can Import any config that you may have saved on your system or a mounted fileserver. Imported configs are copied to your home
$USER/Library/Application Support/Shark/Configsfolder. You can also perform this function without invoking the Configuration Editor by using the Config→Import... menu command.You can Export any listed config to an arbitrary file on your system or a fileserver. This is a great way to share configs between computers or user accounts. You can also perform this function without invoking the Configuration Editor by using the Config→Export... menu command.
The Summary — Explains the details of the selected config and all the PlugIn settings that will be used to collect data.
The PlugIn List — Each PlugIn type in the configuration may optionally provide an editor for its properties in the configuration. You can select the PlugIn to edit by clicking on the desired PlugIn name here. You can also enable or disable PlugIns using the checkboxes.
The order of the plugins has a different meaning depending upon on the type of plugin. For data source plugins, the vertical order of the enabled plugins indicates the order in which data sources will be started and stopped. Analysis plugin order indicates the order of their creation, and viewer plugin order determines the order of viewer tabs in the resulting Shark session window. The position of a plugin can be changed using the Up and Down arrow buttons to the lower left of the PlugIn List.
The PlugIn Property Editor — This displays user-tunable options, if any, for the PlugIn currently selected in the PlugIn List. Some PlugIns have no or only a few controls, while other PlugIns (such as the “Timed Samples & Counters” Data Source plugin) have many properties, and require multiple tabbed window panes to organize all the various settings available.
The Property View Pop-up: Each plugin’s property editor can optionally support two modes of operation: Simple (the default) and Advanced. This menu allows you to select between them, if they are both present. In addition, this control modifies the PlugIn List as follows:
In Simple mode, only plugins enabled by the currently selected config that have property editors are listed.
In Advanced mode, all of the available plugins are listed with a checkbox next to each indicating whether or not it is enabled in the current config.

The remainder of this chapter describes Shark’s wide variety of PlugIn editors that are controllable through the Configuration Editor. In addition, because it is very complex, the “Advanced” mode of the “Timed Samples and Counters” config editor is described in Hardware Counter Configuration.
Simple Timed Samples and Counters Config Editor
The Timed Samples and Counters data source is used for collecting system-wide time and performance count profiles. This is used for several default configurations, including the Time Profiling one described in Time Profiling. In Simple mode, there are two types of settings that can be modified in the editor:
Sampling Tab – The controls on this tab (see Figure 7-3) determine when to start and stop recording samples.
Windowed Time Facility— If enabled, Shark will collect samples until you explicitly stop it. However, it will only store the last N samples, where N is the number entered into the sample history field (10,000 by default). This mode is also described in Windowed Time Facility (WTF).
Start Delay— Amount of time to wait after the user selects “Start” before data collection actually begins. This helps prevent Shark from sampling itself.
Time Limit— The maximum amount of time to record samples. This is ignored if WTF mode is enabled.
Sample Interval— Determines the sampling rate. The interval can be a time period (1 ms default), CPU performance event count, or OS performance event count . If no performance counters (CPU or OS) are configured as triggers, the sample interval is assumed to be a time interval, and hence only the time entry field is enabled.
Figure 7-3 Simple Timed Samples and Counters Data Source - Sampling Tab 
Counters Tab— This tab (see Figure 7-4) presents a fast and simple way to search and configure the Processor (CPU), Operating System (OS), and Northbridge (MEM) performance counters. Enter an event keyword or partial description in the search field to see a list of matching counter events. Use the Mode column to select the performance counter mode (None, Counter, or Trigger). Only a small subset of possible counter options are available here. For more, you will have to use the Advanced settings, described in Hardware Counter Configuration.
Figure 7-4 Simple Timed Samples and Counters Data Source - Counter Settings 
Malloc Data Source PlugIn Editor
The Malloc data source is used for the Malloc Trace config described in Malloc Trace. It is used for collecting a memory allocation profile from a particular executable. All of its configurable controls are contained in a single tab (see Figure 7-5), which modifies the timing of starting and stopping of memory allocation recording behavior:

Record Only Active Blocks— If enabled, Shark will collect samples only in memory regions that were allocated during a profile and not released. Otherwise, any allocation or deallocation that takes place is recorded.
Time Limit— The maximum amount of time to record samples.
Start Delay— Amount of time to wait after the user selects “Start” before data collection actually begins.
Static Analysis Data Source PlugIn Editor
The Static Analysis data source is used by the Static Analysis default configuration, described in Static Analysis. It is used to search for potential performance issues by looking for problems that might crop up through some other (as yet untested) code path. All of its configurable controls are contained in a single tab (see Figure 7-6), which modifies the type and severity of potential problems that can be identified using the mechanism:

Target Selection— These options allow you to narrow down the area of memory examined by Shark.
Application— Looks for potential performance issues in the main text segment of the target process
Frameworks— Looks for potential performance issues in the frameworks that are dynamically loaded by the target process.
Dyld Stubs— Looks for any potential performance or behavior anomalies in the glue code inserted into the binary by the link phase of application building.
Analysis Options— These allow you to enable or disable analysis.
Browse Functions— Gives each function in the text image of a process a reference count of one. This allows you to browse all of the functions of a given process with Shark’s code browser. No analysis (or problem weighting) is performed.
Look For Problems — search all functions in the text image of a process for problems of at least the level of severity specified by the Problem Severity slider. Any address with a problem instruction or code is given a reference count equivalent to its severity.
Problem Severity Slider— This slider acts as a filter, adjusting the minimum “importance” of problems to report using a predefined problem weighting built into Shark. The further to the right the slider, the less output is generated, as more and more potential problems are ignored because their “importance” is not high enough.
Processor Settings— Shark needs to know which model of processor is your target before it can examine code and find potential problems. Separate menus are provided for PowerPC and Intel processors because it can analyze for one model of each processor family simultaneously.
PowerPC Model— Selects the PowerPC model to use when searching for and assigning problem severities .
Intel Model— Selects the Intel model to use when searching for and assigning problem severities .
Java Trace Data Source PlugIn Editor
The Java Trace data source supports three types of Java tracing: Time, Alloc, and Method. All of these have default configurations described in Java Tracing Techniques. These types of tracing only work on a single Java process at a time, as there is no systemwide Java tracing. The controls on the tab (see Figure 7-7) determine what type of Java Tracing to perform, and the time between samples for a Java Time Trace.

Trace Type PopUp Menu— Chooses one of the four types of Java tracing available:
Timed Samples— Selects the Java Time Trace mode. This is similar to a regular Time Profile. It periodically stops the Java process and takes samples of the running threads.
Memory Allocations— Selects the Java Alloc Trace mode. Memory allocations and the sizes of the objects allocated are recorded.
Method Trace— This type of Java tracing is still under development, and should not be used yet.
Call Trace— Selects the Java Call Trace mode. This records each entry into every method during the execution of your program. Hence, this is an exact trace of the methods called (within the limitations of the Java VM).
Interval field— Enter the time between samples here, for the Timed Samples mode.
Sampler Data Source PlugIn Editor
The Sampler data source provides the same functionality as the separate Sampler application and command-line tool. It is not used for any of the default configurations provided with Shark, as most of its functionality has been superseded by features of the much more sophisticated “Timed Samples and Counters” PlugIn. All configurable features can be modified on a single tab (see Figure 7-8), which adjusts basic timing parameters:

Sample Interval— Determines the sampling rate. The interval is a time period (10 ms default).
Start Delay— Amount of time to wait after the user selects “Start” before data collection actually begins.
Time Limit— The maximum amount of time to record samples.
Sample Limit — The maximum number of samples to record. Specifying a maximum of N samples will result in at most N samples being taken, even on a multi-processor system, so this should be scaled up as larger systems are sampled.
System Trace Data Source PlugIn Editor
This data source collects data for the System Trace default configuration, described in System Tracing. All configurable features can be modified on a single tab (see Figure 7-9), which adjusts basic timing parameters:

Sample Limit — The maximum number of samples to record. Specifying a maximum of N samples will result in at most N samples being taken, even on a multi-processor system, so this should be scaled up as larger systems are sampled. On the other hand, you may need to reduce the sample limit if Shark runs out of memory when you attempt to start a system trace, because it must be able to allocate a buffer in RAM large enough to hold this number of samples. When the sample limit is reached, data collection automatically stops, unless the Windowed Time Facility is enabled (see below). The Sample Limit is always enforced, and cannot be disabled.
Time Limit— The maximum amount of time to record samples. This is ignored if Windowed Time Facility is enabled, or if Sample Limit is reached before the time limit expires.
Start Delay— Amount of time to wait after the user selects “Start” before data collection actually begins.
Record Callstacks— When enabled, Shark will collect the function backtrace along with the program counter value for each sample. This should normally be enabled, but can be disabled if you need to record longer traces with a limited amount of memory or if the performance impact of recording the callstacks is too high.
Windowed Time Facility— If enabled, Shark will collect samples until you explicitly stop it. However, it will only store the last N samples, where N is the number entered into the Sample Limit field. This mode is also described in Windowed Time Facility (WTF).
All Thread States Data Source PlugIn Editor
This data source collects data for the Time Profile (All Thread States) default configuration, described in Time Profile (All Thread States), which samples the callstacks of all threads on the system simultaneously, whether they are running or blocked. All configurable features can be modified on a single tab (see Figure 7-10), which adjusts basic timing parameters:

Sample Interval— Determine the trigger for taking a sample. The interval is a time period (10 ms default).
Start Delay— Amount of time to wait after the user selects “Start” before data collection actually begins.
Time Limit— The maximum amount of time to record samples. This is ignored if Sample Limit is enabled and reached before the time limit expires.
Sample Limit — The maximum number of samples to record. Specifying a maximum of N samples will result in at most N samples being taken, even on a multi-processor system, so this should be scaled up as larger systems are sampled. When the sample limit is reached, data collection automatically stops. This is ignored if the Time Limit is enabled and expires first.
Prefer User Callstacks— When enabled, Shark will ignore and discard any samples from threads running exclusively in the kernel. This can eliminate spurious samples from places such as idle threads and interrupt handlers, if your program is not affected by these.
Trim Supervisor Callstacks— When enabled, Shark will automatically trim the recorded callstacks for threads calling into the kernel down to the kernel entry points, and discarding the parts of the stack from within the kernel itself. These shortened stacks are usually sufficient, since most performance problems in your programs can be debugged without knowing about how the kernel is running internally. You just need to know how and when your code is blocking, and not how Mac OS X is actually processing the blocking operation itself.
Analysis and Viewer PlugIn Summary
All Data Source PlugIns include configuration editors. However, most of the analysis and viewer editors do not. While you generally will not need to spend much time worrying about these plugins during the configuration process, you will still need to enable or disable the correct PlugIns in your configuration in order to be able to see your results in the way you expect. The lists in this section give you an overview of when to enable or disable various PlugIns.
There are only a few analysis PlugIns. They just need to be matched to the data source and viewer PlugIns used before and after them, since they connect these PlugIns together:
Standard Profile and Counters— This should be enabled for all configurations except ones that use “System Trace” or “Timed Samples and Counters” configurations that only use the “Counter Spreadsheet” viewer.
Counter Spreadsheet— This can only be used with the “Timed Samples and Counters” data source and the matching “Counter Spreadsheet” viewer. Unlike the rest of the analysis and viewer PlugIns, it actually has an editor for configuring a preset list of “shortcut equations.” See Counter Spreadsheet Analysis PlugIn Editor, below, for details.
System Trace— This can only be used with the “System Trace” data source and any of the four “System Trace” viewers.
There are several viewer PlugIns. When these are enabled, the matching tabs will appear across the top of any session windows made with these configurations, in the order that the configurations are listed in the Configuration Editor. Like the analysis PlugIns, you can only enable these usefully when other PlugIns are also enabled, as we note below.
Standard Profile Browser— This is the standard tabular browser view of symbols and sample counts used by most configurations, as is described in Profile Browser. To use it, you need to enable the “Standard Profile and Counters” analysis PlugIn.
Callstack & Counters Chart— This is the the Chart View used by many configurations to graphically display the callstacks of samples over time, as is described in Chart View . To use it, you need to enable the “Standard Profile and Counters” analysis PlugIn.
Counter Spreadsheet— This presents the counter spreadsheet view described in Timed Counters: The Performance Counter Spreadsheet. To use it, you must have the “Timed Samples and Counters” data source enabled and the “Counter Spreadsheet” analysis PlugIn enabled.
System Trace: Summary— This can only be used with the “System Trace” data source and analysis PlugIns. It displays the Summary tab used by System Trace and described in Summary View In-depth.
System Trace: Trace— This can only be used with the “System Trace” data source and analysis PlugIns. It displays the Trace tab used by System Trace and described in Trace View In-depth.
System Trace: Timeline— This can only be used with the “System Trace” data source and analysis PlugIns. It displays the Timeline tab used by System Trace and described in Timeline View In-depth.
System Trace: Raw— This can only be used with the “System Trace” data source and analysis PlugIns. It displays raw and unprocessed samples recorded by System Trace, and is normally not used by end users.
Counter Spreadsheet Analysis PlugIn Editor
When PMCs are active during sampling, this analysis plugin can be enabled. The controls on this editor allow you to create new results equations called shortcuts. The shortcuts will show up in the counter spreadsheet as extra columns of data that you can plot in the counter spreadsheet’s chart view. With these shortcuts, you can effectively create new types of results data that use the event counts from the sampling to derive new information about the way the event counts may relate to each other, without forcing you to first export the data into another application, such as a spreadsheet. These derivative results can then be viewed just as if they were any other bit of “raw” counter data sampled by Shark.
Using the Editor
When using the editor, you will first be presented with the view shown in Figure 7-11:

This view contains the following constituent parts:
PMC Sumary Table – This table summarizes all the performance counters (PMCs) that are currently selected and enabled in the Timed Samples and Counters data source.
PMC column— This is a short description of the counter and the device in which this performance monitor counter is found.
Mode column— The counter’s current mode. This is typically counter, because unused and trigger PMCs are filtered out and not listed in this table.
Symbol column— This display’s the counter’s term. This is the algebraic symbol that represents the counter in the shortcut equations .
PMC Description column— The name of the event type currently being counted by the selected PMC, which is also used as the header for the results column for this PMC in the Counter Spreadsheet.
Shortcut Equation Table – This table will list any equations that you have defined to generate extra results in the counter spreadsheet viewer. You can edit the names of the shortcut equations in the left column, and their formulas in the right.
Add Button – Creates a new shortcut equation.
Delete Button– Erases the existing shortcut equation that you are currently editing.
If you decide that you would like to combine the existing counter results into a new, derivative result, then simply click the Add button. A new line will be added to the Shortcut Equation Table, where you can type a name in the left column and the equation itself in the right. The name can be whatever you like, but the equation must follow a proscribed format consisting of input terms (using the notation in the table below) combined together using basic four-function math symbols (+ for addition, - for subtraction, * for multiplication, and / for division) and using parenthesis to order the operations, if necessary. You may also include numeric constants at any point in an equation. These are most often used when you need to convert between different types of units.
Once created, each shortcut equation is applied to each row of results (i.e. on a per-sample basis). Shark adds a new column titled with the shortcut name to its “spreadsheet” of counter results in order to hold the newly calculated values.
Shortcut Equation Terms | Description |
|---|---|
pXcY | Represents processor-X, counter-Y. For example: X = CPU number, numbered 1, 2, 3, ... Y = PMC number, numbered 1, 2, 3, ... |
pNcY | Represents a summation of results from all processors on counter-Y. For example: Y = PMC number, numbered 1, 2, 3, ... |
mXcY | Represents memory Controller-X, counter-Y. For example: X = Memory controller number, numbered 1, 2, 3, ... (At present, there are no Macs with more than one memory controller.) Y = PMC number, numbered 1, 2, 3, ... |
oXcY | Represents operating System-X, counter-Y. For example: X = OS image number, numbered 1, 2, 3, ... (At present, there are no Macs with multiple operating system images.) Y = PMC number, numbered 1, 2, 3, ... |
aXcY | Represents apple Processor Interface-X, counter-Y. For example: X = Apple Processor Interface (API) number, numbered 1, 2, 3, ... (At present, there are no Macs with multiple APIs.) Y = PMC number, numbered 1, 2, 3, ... |
tbX | Represents timebase Register in core X. For example: X = Core to take the timebase from, numbered 1, 2, 3, ... |
eqX | Represents equation-X . For example: |
Spreadsheet Configuration Example
Because this editor is very flexible and powerful, an example can be helpful to illustrate how it might be used. Starting with a predefined config, we will add some performance counter events, and activate the Performance Counter Spreadsheet plugins. Last, we will add some shortcut equations to the analysis.
Select the configuration named “Processor Bandwidth (Intel Core 2)” (Figure 7-12).

Click the Duplicate button. Change the name of the new configuration to be “Core CPI (Intel Core 2).”
Make sure that “Simple” is selected in the View popup. Now click the Counters tab in the Config Editor window. Add the following two performance counter events to the profile config:
Find the entry in the performance counter event list that reads “CPU_CLK_UNHALTED.CORE.” Select “Counter” in the Mode column. The event name will change color (blue) to indicate that the selected event is to be used as a counter.
Next search the list by typing “INST” into the search field, as is shown in Figure 7-13. Select the “INST_RETIRED” entry and change the mode to “Counter” as with the first event.
Figure 7-13 Enabling two performance counters 
Click on the Counter Spreadsheet line in the list of PlugIns to see the Performance Counter Spreadsheet. You will see the editor described previously in Using the Editor. To add a new equation to the Shortcut Equation table click the Add button. Enter a shortcut name (e.g. “CPI” – this equation will compute the average number of CPU cycles per instruction for each sample).
Next, enter the equation pNc3/pNc2, as is shown in Figure 7-14. This will automatically calculate the number of cycles per completed instruction, or CPI, and allow you to display it alongside the “raw” counts of CPU cycles, instructions completed, and the bus bandwidths already calculated by the original “Processor Bandwidth” configuration.

Copyright © 2012 Apple Inc. All Rights Reserved. Terms of Use | Privacy Policy | Updated: 2012-07-23