Instruments Analysis Tool
This appendix provides a brief introduction to the Instruments analysis tool to help you understand the data displays used in the best practices described in Best Practices for Developing Cellular Apps.
Main Features of Instruments
Instruments is one of the Xcode developer tools, available through the Open Developer Tools menu. This appendix describes how you can use the Instruments analysis tool to monitor problem areas by checking an app’s efficiency both on the network and on the device.
Although Instruments should be familiar to most iPhone developers, it’s worth reviewing some of the features that are important to testing cellular apps. The Instruments analysis tool:
Is easy to use
Allows you to identify issues and outliers quickly, without having to learn a lot of details about the underlying data-pipe mechanisms
Identifies the device-side impact as well as the impact on the network
Measures a few seconds’ worth of data or logs over multiple days
Provides appropriate granularity in whatever timescale is being measured
Has little to no impact on the device and app behavior while the tool is in use
The Instruments analysis tool includes a suite of individual instruments that you can use to identify unusual patterns of network activity. The Connections tool and the App Profiling tool are particularly useful in recognizing the types of network problems that inefficient apps can cause.
An overview of the Instruments user interface is available in Touring Instruments in Instruments User Guide.
This document specifically refers to the Track Pane in the upper half of the view, the Navigation Bar in the middle, and the Detail Pane in the lower half of the view, as shown in Figure A-1.

This document is not intended to be a tutorial in using the Instruments tool. This description is meant to familiarize you with Instruments enough to understand the example displays in Best Practices for Developing Cellular Apps.
Quick Tour of Instruments Views
The Connections instrument shows many activities that should be familiar to developers. It has three views: Interfaces, Connections, and Processes.
Interfaces View
The Connections tool’s Interfaces view (Figure A-2) monitors traffic on cellular and Wi-Fi interfaces.

The Interfaces Detail pane shows metrics and other details for each interface. Each interface that you select will be graphed in the Track pane, showing data volume over time.
Connections View
The Connections tool’s Connections view (Figure A-3) monitors all TCP and UDP connections as the app triggers them.

The Connections Detail pane shows metrics and other details for each connection and the selected connections are graphed in the Track pane, showing data volume over time.
Processes View
The Connections tool’s Processes view (Figure A-4) monitors data traffic connections for each process that the app is running.
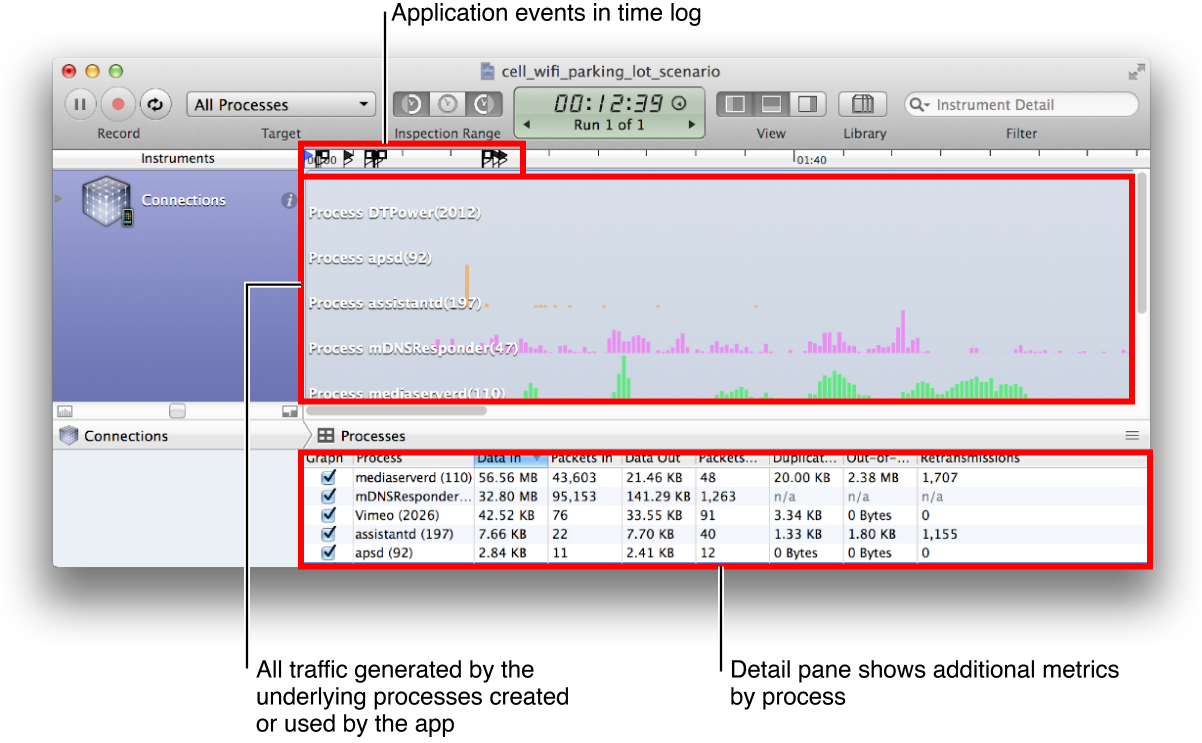
The Processes view shows the traffic for each process created or used by the app. Select which processes are graphed using the checkboxes in the Detail pane. All traffic related to other processes is shown in the bottom line of the Detail pane, identified as *Other*. To protect the user’s privacy, you can only individually monitor apps that you have developed.
Combined View
The Connections tool supports creating combined views that allow you to have interfaces, connections, and processes graphed in time-aligned combination (Figure A-5).

Use the Combined view to identify which process was active, what interface the traffic used, and what connections the activity generated. All checked items from all three Detail lists will be graphed in the Track pane.
Combining with Other Instruments Views
The Connections instrument is only one of the individual instruments available in the Instruments tool. You can combine a Connections view with other instruments. For example, Figure A-6 shows a time-aligned view of the Connections, Network Activity, Energy Usage, Display Brightness, and CPU Activity instruments.

A combined view allows you to compare multiple factors in a time-aligned view to help identify problems.
Identifying Outliers
The Instruments tool can help identify outliers, those instances that are outside the overall normal range of an app’s operation. These outliers can have the greatest impact on the cellular data network.
To find outliers, open the Connection tool’s Interfaces view and locate the Additional Details button (![]() ) for the interface (Figure A-7). The button appears when you select a specific interface or when you hover your cursor over an interface entry. Click that button to generate a histogram of the app’s connections inactivity.
) for the interface (Figure A-7). The button appears when you select a specific interface or when you hover your cursor over an interface entry. Click that button to generate a histogram of the app’s connections inactivity.

Many Instruments tools have a button like this that provides additional details, depending on the tool. For Interfaces, it generates a histogram showing the inactive time between every two consecutive packets (Figure A-8).

This interface inactivity histogram is used in many of the following best practices.
In general, best practice is to avoid connection idle time values that fall in the middle area (10 seconds to 15 minutes between connections). Instead, operate your app either in continuous connection (the left end) or where the timing is not critical (the right end). If your app requires frequent new connections to the cellular physical layer infrastructure (the middle area), this behavior can both degrade performance and increase user and carrier costs.
Understanding the Instruments Log File
Complete instructions on creating an Instruments log file (also called a trace file) are beyond the scope of this guide. Please see “Collecting Data on Your App” for more details.
To understand the examples in Best Practices for Developing Cellular Apps, it will be useful to know that Instruments has two methods for creating log files for analysis (Figure A-9):
With your device tethered to your workstation, view the results in real time in Instruments.
With your device untethered, save the log on your device, view the log file in Instruments later.

Seeing your device’s activities in real time can be useful for some situations, such as seeing the results of user actions. Being able to operate untethered allows you to test scenarios such a moving from a Wi-Fi area to an area with only cellular service.
Understanding Testing
Typical tests of any app include two modes: active tests and background tests.
To accurately evaluate an app’s performance, first run a test without the app to be profiled, to understand the traffic generated by the basic usage of the device. Then do a second run, with the app to be profiled, to understand the additional traffic generated by the app.
To run an active test, record the app while it is in foreground mode for anywhere from a few seconds up to 15 or 20 minutes.
For background tests, run the app in background mode; the screen can be either on or off. You can see the impact of the app on cellular performance by looking at the number of connections made (cellular control plane as well as TCP/UDP), the amount of data transferred, the data transfer patterns, and other metrics.
Instruments can monitor these tests for however long you want to run them, from a few minutes to a couple of days. Use longer-duration tests to understand the keepalive patterns generated by apps. Some apps generate more connections when they are freshly set up (out of the box) than when they have been running for a few days.
Copyright © 2014 Apple Inc. All Rights Reserved. Terms of Use | Privacy Policy | Updated: 2014-04-09