Retired Document
Important: OpenGL ES was deprecated in iOS 12. To create high-performance code on GPUs, use the Metal framework instead. See Metal.
Tuning Your OpenGL ES App
The performance of OpenGL ES apps in iOS differs from that of OpenGL in OS X or other desktop operating systems. Although powerful computing devices, iOS–based devices do not have the memory or CPU power that desktop or laptop computers possess. Embedded GPUs are optimized for lower memory and power usage, using algorithms different from those a typical desktop or laptop GPU might use. Rendering your graphics data inefficiently can result in a poor frame rate or dramatically reduce the battery life of an iOS-based device.
Later chapters describe many techniques to improve your app’s performance; this chapter covers overall strategies. Unless otherwise labeled, the advice in this chapter pertains to all versions of OpenGL ES.
Debug and Profile Your App with Xcode and Instruments
Don’t optimize your app until you test its performance in a variety of scenarios on a variety of devices. Xcode and Instruments include tools to help you identify performance and correctness problems in your app.
Monitor the Xcode debug gauges for a general overview of performance. These gauges are visible whenever you run your app from Xcode, making it easy to spot changes in performance while developing your app.
Use the OpenGL ES Analysis and OpenGL ES Driver tools in Instruments for a deeper understanding of run-time performance. Get detailed information on your app’s resource use and conformance to OpenGL ES best practices, and selectively disable portions of the graphics pipeline so you can determine which part is a significant bottleneck in your app. For more information, see Instruments User Guide.
Use the OpenGL ES Frame Debugger and Performance Analyzer tools in Xcode for pinpoint troubleshooting of performance and rendering issues. Capture all OpenGL ES commands used to render and present a single frame, then walk through those commands to see the effect of each on the OpenGL ES state, bound resources, and the output framebuffer. You can also view shader source code, edit it, and see how your changes affect the rendered image. On OpenGL ES 3.0–capable devices, the Frame Debugger also indicates which draw calls and shader instructions contribute most to rendering time. For more information about these tools, see Xcode OpenGL ES Tools Overview.
Watch for OpenGL ES Errors in Xcode and Instruments
OpenGL ES errors occur when your app uses the OpenGL ES API incorrectly (for example, by requesting operations that the underlying hardware is not capable of performing). Even if your content renders correctly, these errors may indicate performance problems. The traditional way to check for OpenGL ES errors is to call the glGetError function; however, repeatedly calling this function can significantly degrade performance. Instead, use the tools described above to test for errors:
When profiling your app in Instruments, see the detail pane for OpenGL ES Analyzer tool to view any OpenGL ES errors reported while recording.
While debugging your app in Xcode, capture a frame to examine the drawing commands used to produce it, as well as any errors encountered while performing those commands.
You can also configure Xcode to stop program execution when an OpenGL ES error is encountered. (See Adding an OpenGL ES Error Breakpoint.)
Annotate Your OpenGL ES Code for Informative Debugging and Profiling
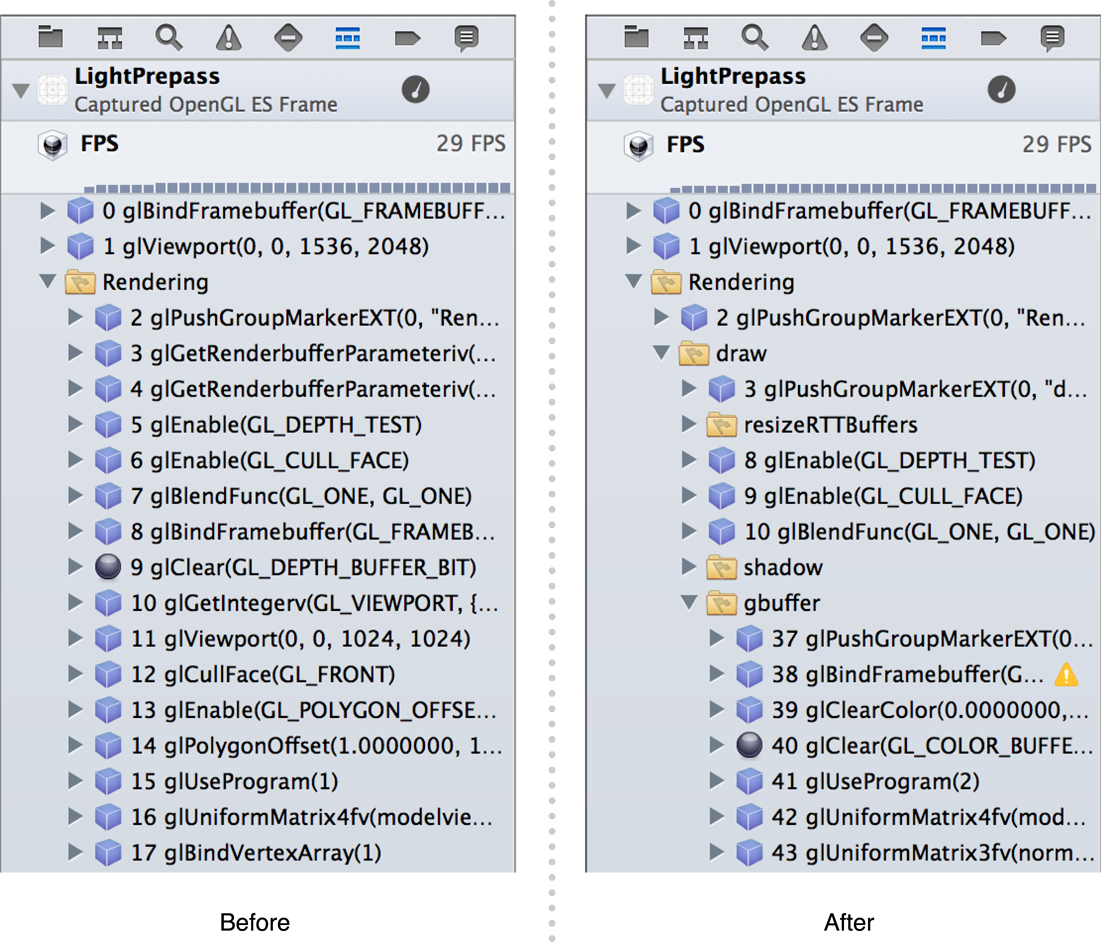
You can make debugging and profiling more efficient by organizing your OpenGL ES commands into logical groups and adding meaningful labels to OpenGL ES objects. These groups and labels appear in OpenGL ES Frame Debugger in Xcode as shown in Figure 7-1, and in OpenGL ES Analyzer in Instruments. To add groups and labels, use the EXT_debug_markerEXT_debug_label
When you have a sequence of drawing commands that represent a single meaningful operation—for example, drawing a game character—you can use a marker to group them for debugging. Listing 7-1 shows how to group the texture, program, vertex array, and draw calls for a single element of a scene. First, it calls the glPushGroupMarkerEXT function to provide a meaningful name, then it issues a group of OpenGL ES commands. Finally, it closes the group with a call to the glPopGroupMarkerEXT function.
Listing 7-1 Using a debug marker to annotate drawing commands
glPushGroupMarkerEXT(0, "Draw Spaceship"); |
glBindTexture(GL_TEXTURE_2D, _spaceshipTexture); |
glUseProgram(_diffuseShading); |
glBindVertexArrayOES(_spaceshipMesh); |
glDrawElements(GL_TRIANGLE_STRIP, 256, GL_UNSIGNED_SHORT, 0); |
glPopGroupMarkerEXT(); |
You can use multiple nested markers to create a hierarchy of meaningful groups in a complex scene. When you use the GLKView class to draw OpenGL ES content, it automatically creates a “Rendering” group containing all commands in your drawing method. Any markers you create are nested within this group.
Labels provide meaningful names for OpenGL ES objects, such as textures, shader programs, and vertex array objects. Call the glLabelObjectEXT function to give an object a name to be shown when debugging and profiling. Listing 7-2 illustrates using this function to label a vertex array object. If you use the GLKTextureLoader class to load texture data, it automatically labels the OpenGL ES texture objects it creates with their filenames.
Listing 7-2 Using a debug label to annotate an OpenGL ES object
glGenVertexArraysOES(1, &_spaceshipMesh); |
glBindVertexArrayOES(_spaceshipMesh); |
glLabelObjectEXT(GL_VERTEX_ARRAY_OBJECT_EXT, _spaceshipMesh, 0, "Spaceship"); |
General Performance Recommendations
Use common sense to guide your performance tuning efforts. For example, if your app draws only a few dozen triangles per frame, changing how it submits vertex data is unlikely to improve its performance. Look for optimizations that provide the most performance improvement for your effort.
Redraw Scenes Only When the Scene Data Changes
Your app should wait until something in the scene changes before rendering a new frame. Core Animation caches the last image presented to the user and continues to display it until a new frame is presented.
Even when your data changes, it is not necessary to render frames at the speed the hardware processes commands. A slower but fixed frame rate often appears smoother to the user than a fast but variable frame rate. A fixed frame rate of 30 frames per second is sufficient for most animation and helps reduce power consumption.
Disable Unused OpenGL ES Features
The best calculation is one that your app never performs. For example, if a result can be precalculated and stored in your model data, you can avoid performing that calculation at runtime.
If your app is written for OpenGL ES 2.0 or later, do not create a single shader with lots of switches and conditionals that performs every task your app needs to render the scene. Instead, compile multiple shader programs that each perform a specific, focused task.
If your app uses OpenGL ES 1.1, disable any fixed-function operations that are not necessary to render the scene. For example, if your app does not require lighting or blending, disable those functions. Similarly, if your app draws only 2D models, it should disable fog and depth testing.
Simplify Your Lighting Models
These guidelines apply both to fixed-function lighting in OpenGL ES 1.1 and shader-based lighting calculations you use in your custom shaders in OpenGL ES 2.0 or later.
Use the fewest lights possible and the simplest lighting type for your app. Consider using directional lights instead of spot lighting, which require more calculations. Shaders should perform lighting calculations in model space; consider using simpler lighting equations in your shaders over more complex lighting algorithms.
Pre-compute your lighting and store the color values in a texture that can be sampled by fragment processing.
Use Tile-Based Deferred Rendering Efficiently
All GPUs used in iOS devices use tile-based deferred rendering (TBDR). When you call OpenGL ES functions to submit rendering commands to the hardware, the commands are buffered until a large list of commands is accumulated. The hardware does not begin processing vertices and shading pixels until you present the renderbuffer or flush the command buffer. It then renders these commands as a single operation by dividing the framebuffer into tiles and then drawing the commands once for each tile, with each tile rendering only the primitives that are visible within it. (The GLKView class presents the renderbuffer after your drawing method returns. If you create your own renderbuffer for display using the CAEAGLLayer class, you present it using the OpenGL ES context’s presentRenderbuffer: method. The glFlush or glFinish function flushes the command buffer.)
Because tile memory is part of the GPU hardware, parts of the rendering process such as depth testing and blending are much more efficient—in both time and energy usage—than on a traditional stream-based GPU architecture. Because this architecture processes all vertices for an entire scene at once, the GPU can perform hidden surface removal before fragments are processed. Pixels that are not visible are discarded without sampling textures or performing fragment processing, significantly reducing the calculations that the GPU must perform to render the tile.
Some rendering strategies that are useful on traditional stream-based renderer have a high performance costs on iOS graphics hardware. Following the guidelines below can help your app perform well on TBDR hardware.
Avoid Logical Buffer Loads and Stores
When a TBDR graphics processor begins rendering a tile, it must first transfer the contents of that portion of the framebuffer from shared memory to the tile memory on the GPU. This memory transfer, called a logical buffer load, takes time and energy. Most often, a framebuffer’s previous contents are not necessary for drawing the next frame. Avoid the performance cost of loading previous buffer contents by calling glClear whenever you begin rendering a new frame.
Similarly, when the GPU finishes rendering a tile, it must write the tile’s pixel data back to shared memory. This transfer, called a logical buffer store, also has a performance cost. At least one such transfer is necessary for each frame drawn—the color renderbuffer displayed on the screen must be transferred to shared memory so it can be presented by Core Animation. Other framebuffer attachments used in your rendering algorithm (for example, depth, stencil, and multisampling buffers) need not be preserved, because their contents will be recreated on the next frame drawn. OpenGL ES automatically stores these buffers to shared memory—incurring a performance cost—unless you explicitly invalidate them. To invalidate a buffer, use the glInvalidateFramebuffer command in OpenGL ES 3.0 or the glDiscardFramebufferEXT command in OpenGL ES 1.1 or 2.0. (For more details, see Discard Unneeded Renderbuffers.) When you use the basic drawing cycle provided by GLKView class, it automatically invalidates any drawable depth, stencil, or multisampling buffers it creates.
Logical buffer store and load operations also occur if you switch rendering destinations. If you render to a texture, then to a view’s framebuffer, then to the same texture again, the texture’s contents must be repeatedly transferred between shared memory and the GPU. Batch your drawing operations so that all drawing to a rendering destination is done together. When you do switch framebuffers (using the glBindFramebuffer or glFramebufferTexture2D function or bindDrawable method), invalidate unneeded framebuffer attachments to avoid causing a logical buffer store.
Use Hidden Surface Removal Effectively
A TBDR graphics processor automatically uses the depth buffer to perform hidden surface removal for the entire scene, ensuring that only one fragment shader is run for each pixel. Traditional techniques for reducing fragment processing are not necessary. For example, sorting objects or primitives by depth from front to back effectively duplicates the work done by the GPU, wasting CPU time.
The GPU cannot perform hidden surface removal when blending or alpha testing is enabled, or if a fragment shader uses the discard instruction or writes to the gl_FragDepth output variable. In these cases, the GPU cannot decide the visibility of a fragment using the depth buffer, so it must run the fragment shaders for all primitives covering each pixel, greatly increasing the time and energy required to render a frame. To avoid this performance cost, minimize your use of blending, discard instructions, and depth writes.
If you cannot avoid blending, alpha testing, or discard instructions, consider the following strategies for reducing their performance impact:
Sort objects by opacity. Draw opaque objects first. Next draw objects requiring a shader using the
discardoperation (or alpha testing in OpenGL ES 1.1). Finally, draw alpha-blended objects.Trim objects requiring blending or
discardinstructions to reduce the number of fragments processed. For example, instead of drawing a square to render a 2D sprite texture containing mostly empty space, draw a polygon that more closely approximates the shape of the image, as shown in Figure 7-2. The performance cost of additional vertex processing is much less than that of running fragment shaders whose results will be unused.Figure 7-2 Trim transparent objects to reduce fragment processing 
Use the
discardinstruction as early as possible in your fragment shader to avoid performing calculations whose results are unused.Instead of using alpha testing or
discardinstructions to kill pixels, use alpha blending with alpha set to zero. The color framebuffer is not modified, but the graphics hardware can still use any Z-buffer optimizations it performs. This does change the value stored in the depth buffer and so may require back-to-front sorting of the transparent primitives.If your performance is limited by unavoidable discard operations, consider a “Z-Prepass” rendering strategy. Render your scene once with a simple fragment shader containing only your discard logic (avoiding expensive lighting calculations) to fill the depth buffer. Then, render your scene again using the
GL_EQUALdepth test function and your lighting shaders. Though multipass rendering normally incurs a performance penalty, this approach can yield better performance than a single-pass render that involves a large number of discard operations.
Group OpenGL ES Commands for Efficient Resource Management
The memory bandwidth and computational savings described above perform best when processing large scenes. But when the hardware receives OpenGL ES commands that require it to render smaller scenes, the renderer loses much of its efficiency. For example, if your app renders batches of triangles using a texture and then modifies the texture, the OpenGL ES implementation must either flush out those commands immediately or duplicate the texture—neither option uses the hardware efficiently. Similarly, any attempt to read pixel data from a framebuffer requires that preceding commands be processed if they would alter that framebuffer.
To avoid these performance penalties, organize your sequence of OpenGL ES calls so that all drawing commands for each rendering target are performed together.
Minimize the Number of Drawing Commands
Every time your app submits primitives to be processed by OpenGL ES, the CPU prepares the commands for the graphics hardware. If your app uses many glDrawArrays or glDrawElements calls to render a scene, its performance may be limited by CPU resources without fully utilizing the GPU.
To reduce this overhead, look for ways to consolidate your rendering into fewer draw calls. Useful strategies include:
Merging multiple primitives into a single triangle strip, as described in Use Triangle Strips to Batch Vertex Data. For best results, consolidate primitives that are drawn in close spatial proximity. Large, sprawling models are more difficult for your app to efficiently cull when they are not visible in the frame.
Creating texture atlases to draw multiple primitives using different portions of the same texture image, as described in Combine Textures into Texture Atlases.
Using instanced drawing to render many similar objects, as described below.
Use Instanced Drawing to Minimize Draw Calls
Instanced drawing commands allow you to draw the same vertex data multiple times using a single draw call. Instead of using CPU time to set up the variations between different instances of a mesh—such as a position offset, transformation matrix, color or texture coordinates—and issuing a draw command for each, instanced drawing moves the processing of instance variations into shader code run on the GPU.
Vertex data that is reused multiple times is a prime candidate for instanced drawing. For example, the code in Listing 7-3 draws an object at multiple positions within a scene. However, the many glUniform and glDrawArrays calls add CPU overhead, reducing performance.
Listing 7-3 Drawing many similar objects without instancing
for (x = 0; x < 10; x++) { |
for (y = 0; y < 10; y++) { |
glUniform4fv(uniformPositionOffset, 1, positionOffsets[x][y]); |
glDrawArrays(GL_TRIANGLES, 0, numVertices); |
} |
} |
Adopting instanced drawing requires two steps: first, replace loops like the above with a single call to glDrawArraysInstanced or glDrawElementsInstanced. These calls are otherwise identical to glDrawArrays or glDrawElements, but with an additional parameter indicating the number of instances to draw (100 for the example in Listing 7-3). Second, choose and implement one of the two strategies OpenGL ES provides for using per-instance information in your vertex shader.
With the shader instance ID strategy, your vertex shader derives or looks up per-instance information. Each time the vertex shader runs, its gl_InstanceID built-in variable contains a number identifying the instance currently being drawn. Use this number to calculate a position offset, color, or other per-instance variation in shader code, or to look up per-instance information in a uniform array or other bulk storage. For example, Listing 7-4 uses this technique to draw 100 instances of a mesh positioned in a 10 x 10 grid.
Listing 7-4 OpenGL ES 3.0 vertex shader using gl_InstanceID to compute per-instance information
#version 300 es |
in vec4 position; |
uniform mat4 modelViewProjectionMatrix; |
void main() |
{ |
float xOffset = float(gl_InstanceID % 10) * 0.5 - 2.5; |
float yOffset = float(gl_InstanceID / 10) * 0.5 - 2.5; |
vec4 offset = vec4(xOffset, yOffset, 0, 0); |
gl_Position = modelViewProjectionMatrix * (position + offset); |
} |
With the instanced arrays strategy, you store per-instance information in a vertex array attribute. Your vertex shader can then access that attribute to make use of per-instance information. Call the glVertexAttribDivisor function to specify how that attribute advances as OpenGL ES draws each instance. Listing 7-5 demonstrates setting up a vertex array for instanced drawing, and Listing 7-6 shows the corresponding shader.
Listing 7-5 Using a vertex attribute for per-instance information
#define kMyInstanceDataAttrib 5 |
glGenBuffers(1, &_instBuffer); |
glBindBuffer(GL_ARRAY_BUFFER, _instBuffer); |
glBufferData(GL_ARRAY_BUFFER, sizeof(instData), instData, GL_STATIC_DRAW); |
glEnableVertexAttribArray(kMyInstanceDataAttrib); |
glVertexAttribPointer(kMyInstanceDataAttrib, 2, GL_FLOAT, GL_FALSE, 0, 0); |
glVertexAttribDivisor(kMyInstanceDataAttrib, 1); |
Listing 7-6 OpenGL ES 3.0 vertex shader using instanced arrays
#version 300 es |
layout(location = 0) in vec4 position; |
layout(location = 5) in vec2 inOffset; |
uniform mat4 modelViewProjectionMatrix; |
void main() |
{ |
vec4 offset = vec4(inOffset, 0.0, 0.0) |
gl_Position = modelViewProjectionMatrix * (position + offset); |
} |
Instanced drawing is available in the core OpenGL ES 3.0 API and in OpenGL ES 2.0 through the EXT_draw_instancedEXT_instanced_arrays
Minimize OpenGL ES Memory Usage
Your iOS app shares main memory with the system and other iOS apps. Memory allocated for OpenGL ES reduces the memory available for other uses in your app. With that in mind, allocate only the memory that you need and deallocate it as soon as your app no longer needs it. Here are a few ways you can save memory:
After loading an image into an OpenGL ES texture, free the original image.
Allocate a depth buffer only when your app requires it.
If your app does not need all of its resources at once, load only a subset of the items. For example, a game might be divided into levels; each loads a subset of the total resources that fits within a more strict resource limit.
The virtual memory system in iOS does not use a swap file. When a low-memory condition is detected, instead of writing volatile pages to disk, the virtual memory frees up nonvolatile memory to give your running app the memory it needs. Your app should strive to use as little memory as possible and be prepared to dispose of objects that are not essential to your app. Responding to low-memory conditions is covered in detail in the App Programming Guide for iOS.
Be Aware of Core Animation Compositing Performance
Core Animation composites the contents of renderbuffers with any other layers in your view hierarchy, regardless of whether those layers were drawn with OpenGL ES, Quartz or other graphics libraries. That’s helpful, because it means that OpenGL ES is a first-class citizen to Core Animation. However, mixing OpenGL ES content with other content takes time; when used improperly, your app may perform too slowly to reach interactive frame rates.
For the absolute best performance, your app should rely solely on OpenGL ES to render your content. Size the view that holds your OpenGL ES content to match the screen, make sure its opaque property is set to YES (the default for GLKView objects) and that no other views or Core Animation layers are visible.
If you render into a Core Animation layer that is composited on top of other layers, making your CAEAGLLayer object opaque reduces—but doesn’t eliminate—the performance cost. If your CAEAGLLayer object is blended on top of layers underneath it in the layer hierarchy, the renderbuffer’s color data must be in a premultiplied alpha format to be composited correctly by Core Animation. Blending OpenGL ES content on top of other content has a severe performance penalty.
Copyright © 2018 Apple Inc. All Rights Reserved. Terms of Use | Privacy Policy | Updated: 2018-06-04