Throughout the development process, verify that your app is running efficiently by regularly monitoring, testing, and retesting its performance. A variety of tools and utilities can help you analyze your app's energy impact.
Activity Monitor
Activity Monitor is installed in the /Applications/Utilities folder on every Mac. It provides a running list of active processes, along with various metrics.
Assess Energy Usage
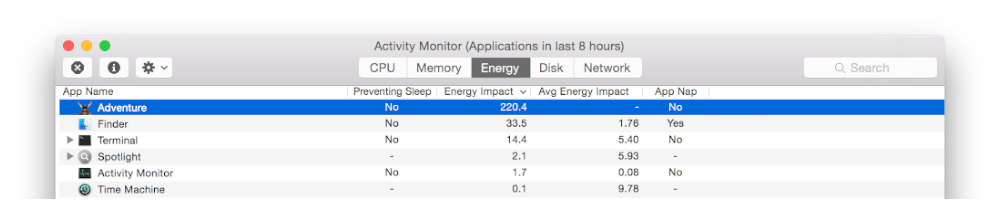
Metrics that relate to energy use and can be viewed in the Energy pane of Activity Monitor (see Figure 16-1). Use the View > Columns menu to enable or customize the metrics displayed.
Figure 16-1Energy columns in Activity Monitor
As shown in Figure 16-2, graphs denoting overall energy impact and battery statistics are displayed at the bottom of the Energy pane.
Figure 16-2Energy statistic graphs in Activity Monitor
The Energy pane in Activity Monitor displays the following columns:
Preventing Sleep. Indicates when an app is preventing the system from sleeping, perhaps because it has initiated activity that has disabled sleep (see Determine When Your App Is Preventing Sleep).
Energy Impact. Assigns an energy impact score to your app, based on how efficiently it is operating. A variety of factors are taken into account when this score is assigned, including CPU usage, network activity, disk I/O, and more.
Avg Energy Impact. Indicates the average energy impact score over the past 8 hours, or since the time the Mac was restarted.
App Nap. Indicates when an app has been placed in App Nap (see Extend App Nap). You can use this column to monitor your running app and make sure App Nap activates when it’s placed in the background and hidden or fully obscured by another app.
Assess CPU Usage
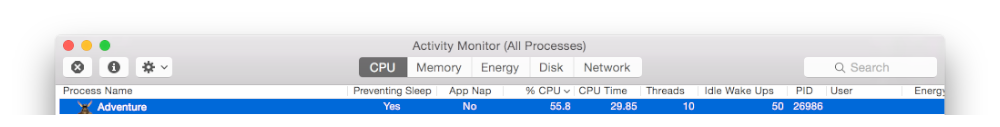
High CPU usage is a major contributing factor to high energy consumption, and Activity Monitor implements a variety of features that can help assess the amount of CPU your app is utilizes. The CPU pane shows the percentage of CPU your app is using at any given time, in relation to the other active processes on the system, as shown in Figure 16-3. When your app isn’t active, the number in this column should be 0.0. High values here, especially consistent ones, indicate that your app may not be as energy efficient as it could be. You should look carefully at your app for ways to reduce its CPU requirements.
Figure 16-3CPU columns in Activity Monitor
Graphs and statistics related to overall system CPU usage are displayed at he bottom of the CPU pane. See Figure 16-4.
Figure 16-4CPU statistic graphs in Activity Monitor
Activity Monitor also includes provides graphical displays of historical and current state CPU core utilization.
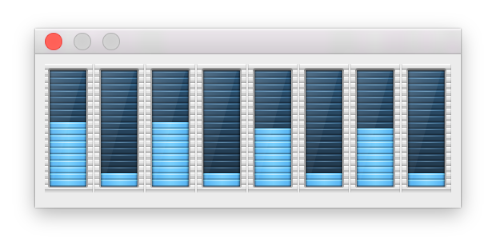
CPU Usage. Represents system-wide usage across all CPU cores. To display this window, choose Window > CPU Usage. See Figure 16-5.
Figure 16-5The CPU Usage dialog in Activity Monitor
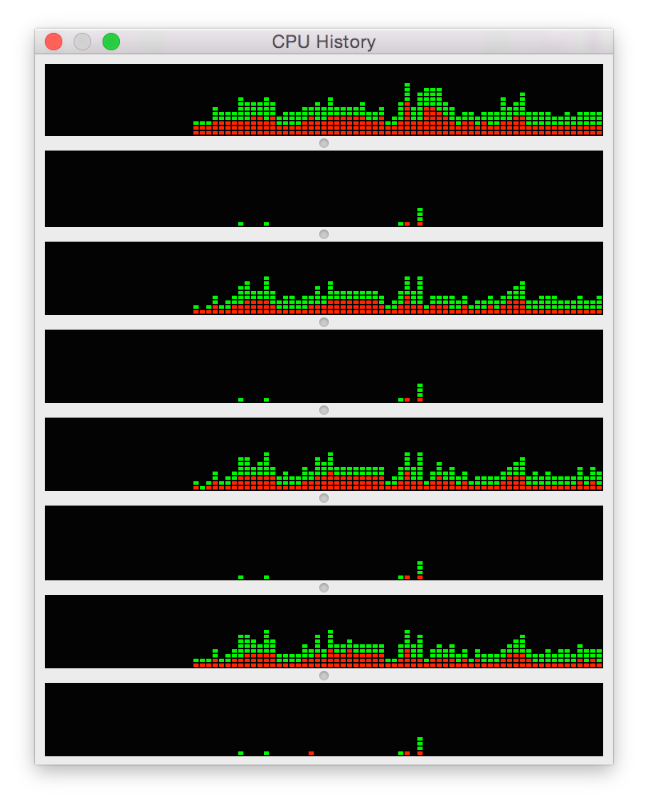
CPU History. Represents system-wide usage across all CPU cores over a period of time. It begins to capture usage once the window is displayed, and updates as usage fluctuates. To display this window, choose Window > CPU History. See Figure 16-5.
Figure 16-6The CPU History dialog in Activity Monitor
Xcode
There’s no better time to diagnose your app’s energy footprint than when you are in the process of developing your app. Xcode includes a number of features that can help.
Debugging Gauges
The debug navigator in Xcode (choose View > Navigators > Show Debug Navigator) provides a series of gauges that allow you to analyze the energy impact of your app while testing it within Xcode. These gauges are displayed when your app has been launched by Xcode and is actively running or paused.
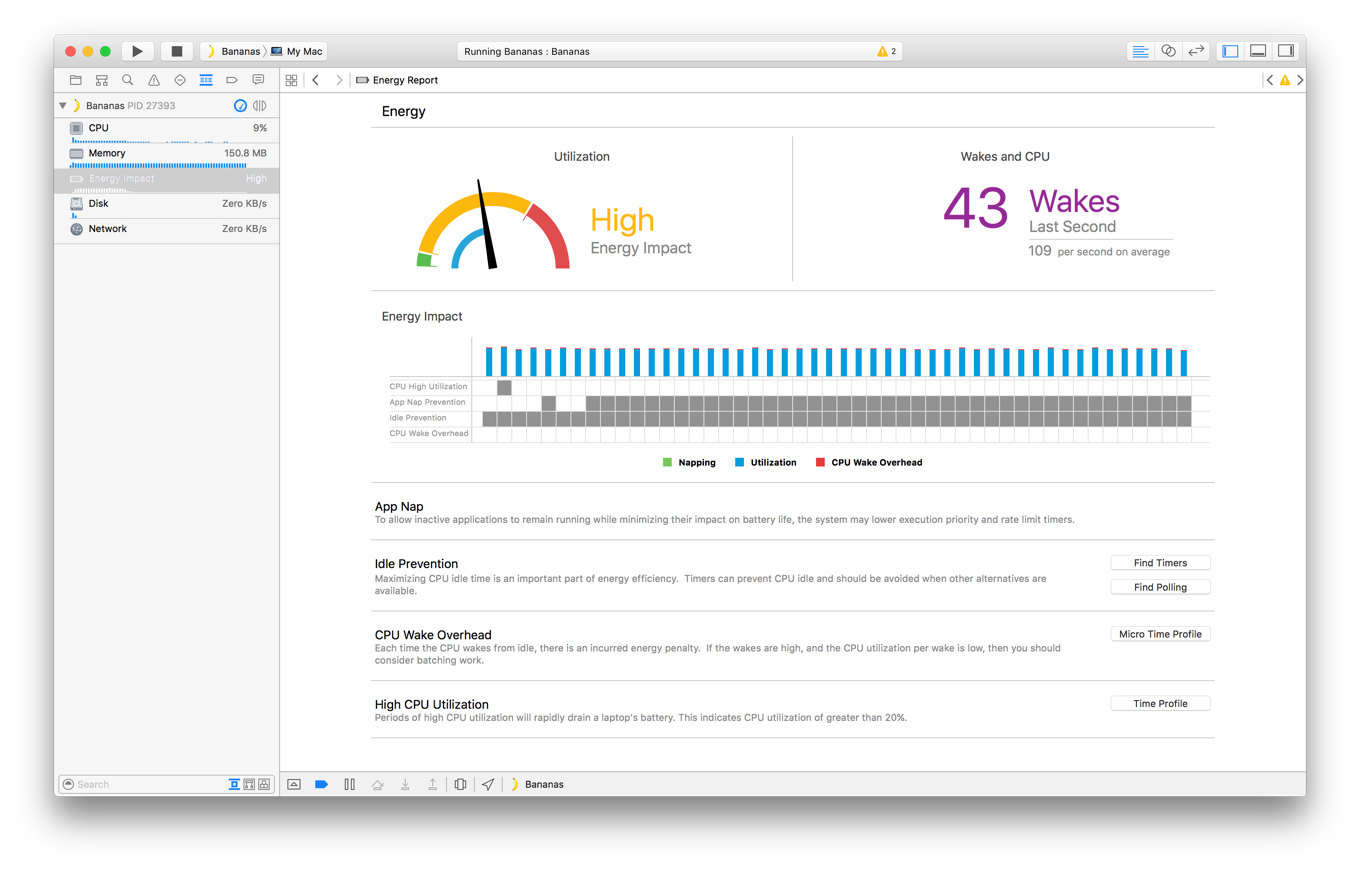
Energy impact gauge. Displays a report of your app’s current energy impact and a bar graph of its recent impact. When users interact with your app, it should have a low energy impact. When users aren’t interacting with your app, it should have zero energy impact.
Figure 16-7Monitoring energy impact in Xcode
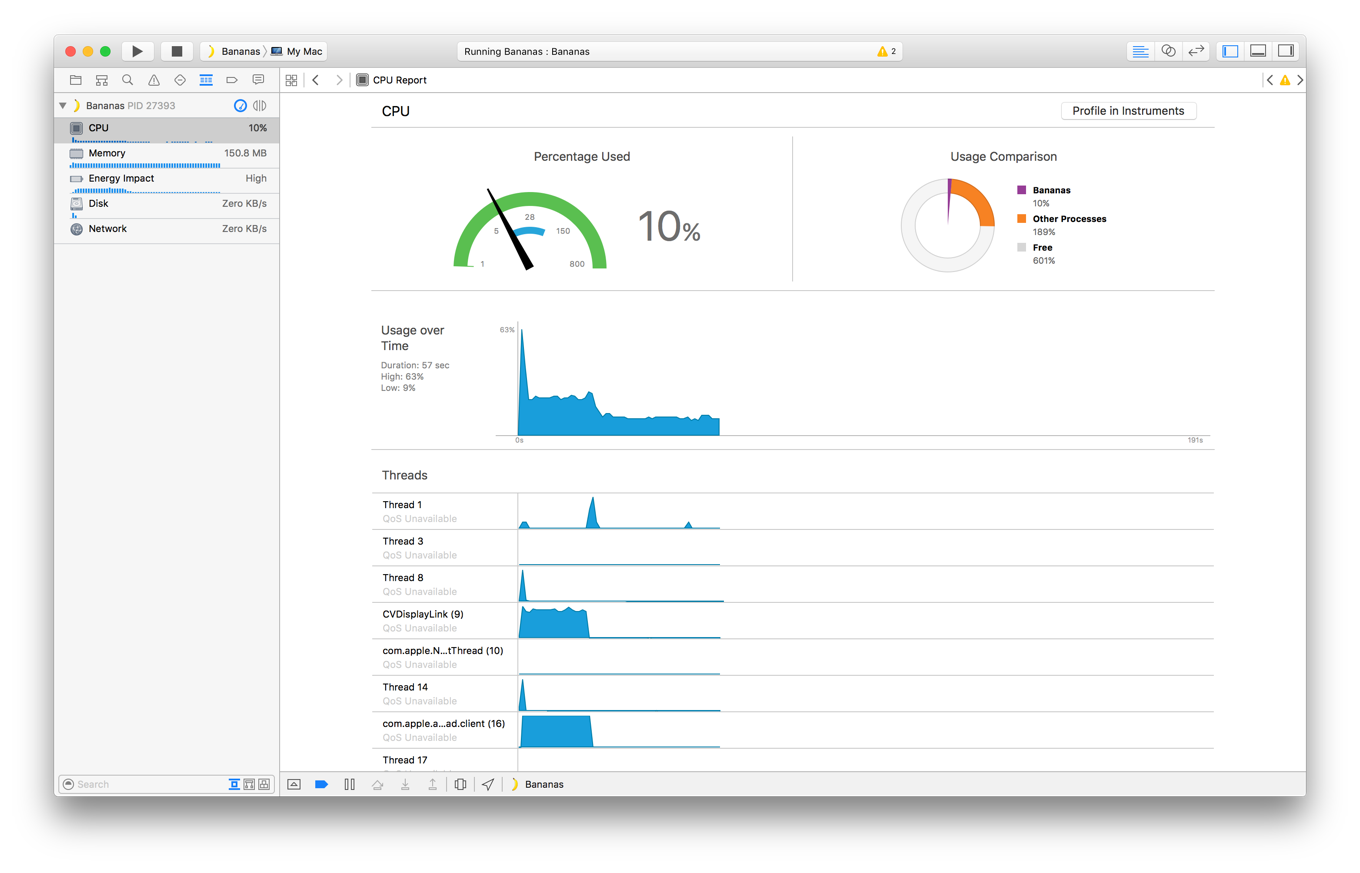
CPU gauge. Monitors your app and reports on its current and historical CPU usage. Spikes when your app is supposed to have low CPU activity or when your app is idle may indicate problem areas where optimizations can be made.
Figure 16-8Monitoring CPU usage in Xcode
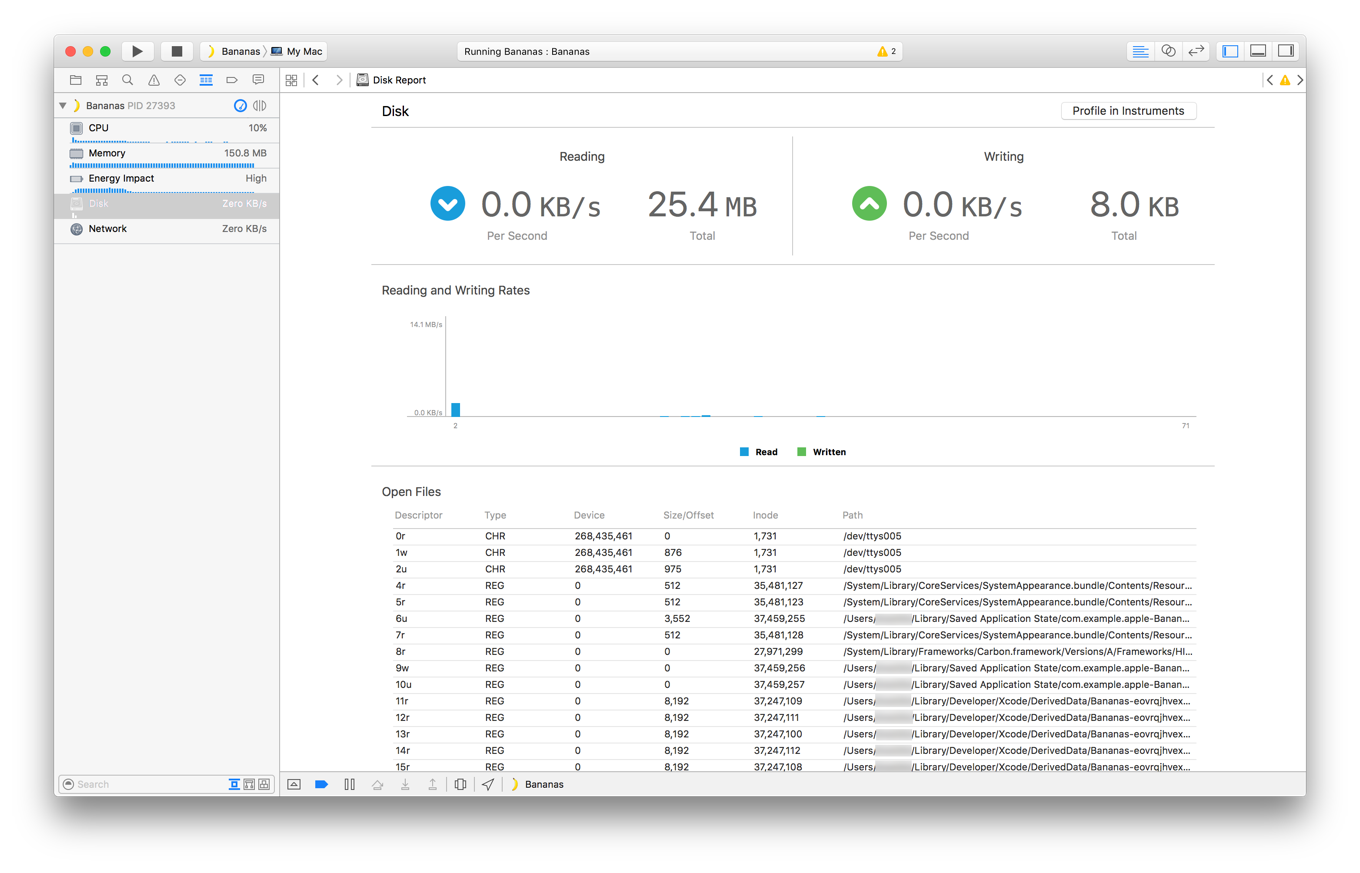
Disk usage gauge. Alerts you to disk read and write activity and files your app has opened. Use this gauge to identify unexpected or recurring small I/O activity.
Figure 16-9Monitoring disk I/O in Xcode
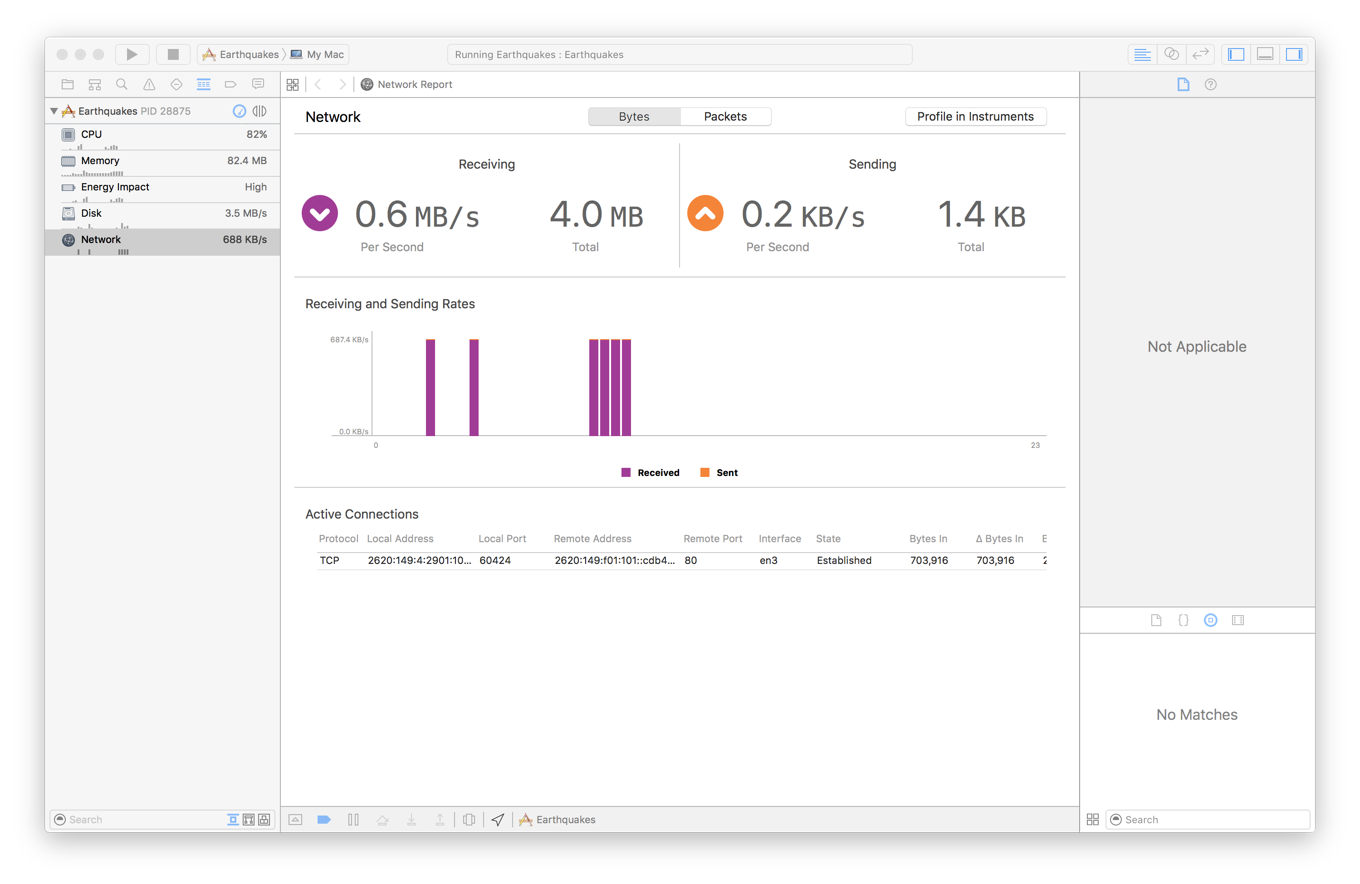
Network usage gauge. Accounts for all inbound and outbound network traffic. Look for discretionary activity that your app performs directly, and consider updating it to be performed by the system at more energy optimal times.
Figure 16-10Monitoring network activity in Xcode
Debugging
Knowing how to test and debug your app can go a long way toward helping you identify potential energy problems and areas for improvement. Debug Your App in Xcode Overview and Testing with Xcode describe common debugging techniques. If your app performs tasks asynchronously using GCD, NSOperationQueue, or XPC, debugging can be a little harder. There are, however, techniques that can help you debug your app even in these complex situations.
Queue debugging. If your app uses GCD dispatch queues to perform operations, use queue debugging techniques to ensure that work is being performed as expected. To learn about GCD, dispatch queues, and queue debugging, watch the session WWDC 2013: Debugging with Xcode, and review the Concurrency Programming Guide and Grand Central Dispatch (GCD) Reference.
Activity tracing. This technology makes finding bugs faster and easier by logging trace messages as your app runs. When a problem occurs, follow these messages to identify the code that produced the failure. For information on activity tracing, see the session WWDC 2014: Fix Bugs Faster Using Activity Tracing.
Instruments
The Instruments app, which is included with Xcode, gathers data from your running app and presents it in a graphical timeline. You gather data about such performance areas as your app’s CPU usage, disk activity, network activity, and graphics operations. By viewing the data together, you can analyze different aspects of your app’s performance to identify potential areas of improvement.
Instruments provides a variety of preconfigured profiling templates, which help you analyze your app and ensure that it is performing efficiently. Some of these relate directly to energy.
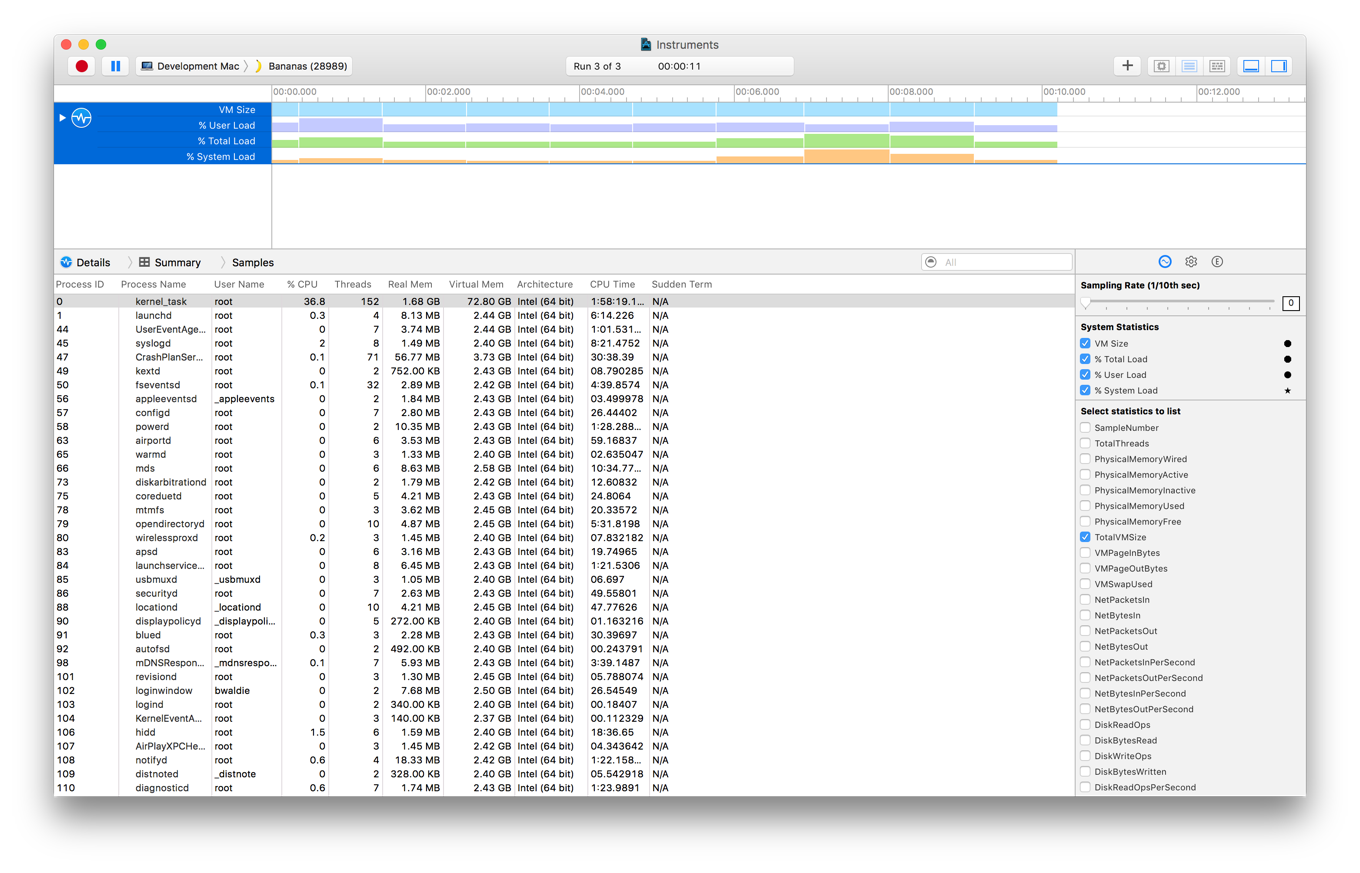
Activity Monitor template. Monitors the CPU, memory, disk, and network usage statistics of your app. Results are graphically represented at a high level in a timeline. If you prefer, you can dive deeper into detailed statistics for more comprehensive analysis.
Figure 16-11Activity monitoring with Instruments
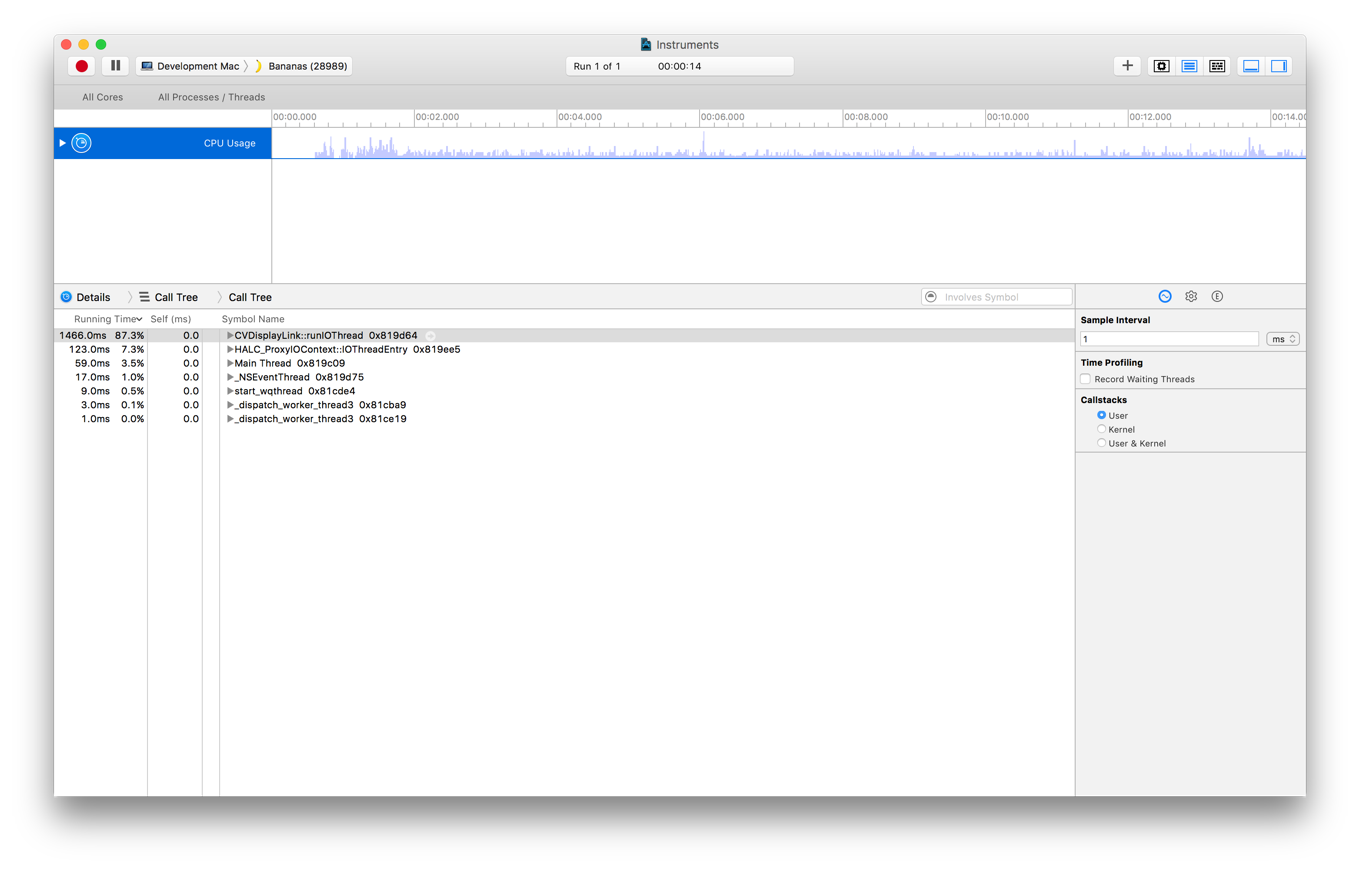
Time Profiler template. Captures stack trace information at prescribed intervals, while displaying a timeline of the percentage of CPU being used.
Figure 16-12Time profiling with Instruments
Command-Line Tools
Command-line tools can be useful if you are already working in command-line mode or if you are building scripts to monitor your apps.
dtrace. Access low-level information about the operating system kernel and the user processes running on your computer. To learn about DTrace and the D scripting language, see the Solaris Dynamic Tracing Guide, available from the Oracle Technology Network, and the dtrace(1) Mac OS X Manual Page.
fs_usage. Get a running list of system calls related to activity in the file system. Use fs_usage command options to specify a timeout, filtering, and more. See fs_usage in Minimize I/O or refer to the fs_usage(1) Mac OS X Manual Page.
pmset. Adjust system-wide power management settings, such as idle sleep timing, automatic restart on power loss, and more. It can also be used to put the device to sleep, and to determine whether any power assertions are in place. See pmset(1) Mac OS X Manual Page.
powermetrics. Monitor CPU usage and determine how much CPU time is being allocated to different quality of service classes. This can be helpful for ensuring that quality of service classes are properly implemented. See powermetrics in Prioritize Work at the Task Level or the powermetrics(1) Mac OS X Manual Page.
sample. Gather information about your app at specified intervals and produce a report of functions occurring at those intervals. This information helps you diagnose responsiveness problems, high CPU use problems, and more. See sample(1) Mac OS X Manual Page.
spindump. Use this tool with the -timeline option to sample and profile your app in order to determine which QoS class applies to a thread as a specific portion of code executes at a given time. spindump in Prioritize Work at the Task Level demonstrates usage. See spindump(8) Mac OS X Manual Page.
top. Get CPU usage information, as shown in Listing 16-1.
Listing 16-1Using top to identify CPU usage for a specified process
$ top -pid 68041
PID COMMAND %CPU
68041 Adventure 18.1
Quartz Debug Utility
The Quartz Debug utility (part of the Graphics Tools for Xcode package in the Developer site Downloads section) helps you debug graphics-related issues in your apps. See Detect Extraneous Updates.