SpriteKit Debugging Guide
Common SpriteKit issues and general debugging tips for SpriteKit app developers.
Introduction
This document is a SpriteKit troubleshooting guide that supplements the SpriteKit framework references located within the Developer Library. See the SpriteKit developer splash page for the complete suite of SpriteKit documentation. When troubleshooting an issue, start there first to ensure you're using the APIs properly.
This guide provides additional troubleshooting information that applies to SpriteKit as a whole and also covers individual problems that SpriteKit developers have encountered in the Common Issues and Debugging Tips sections.
Common Issues
The following are a list of topics and issues SpriteKit game developers frequently discuss along with known solutions. If a specific problem is not listed here, continue to the Debugging Tips section for general strategies to troubleshoot SpriteKit issues.
Use SpriteKit objects within the ordained callbacks
SpriteKit is largely a single threaded game engine and as such the API provides developers with callbacks to implement your custom game logic. The primary callback for your game logic is update( _ : ). Other examples are didMoveToView() and didSimulatePhysics(). Modifying SpriteKit objects outside of the ordained callbacks (a background queue or anything else non-main-thread) can result in concurrency related problems. Even dispatching work on the main thread asynchronously or at a later time is risky because the closure is likely to be done outside of the timeframe SpriteKit expects. If you're experiencing a segmentation fault or other type of crash occurring deep within the SpriteKit framework, there's a good chance your code is modifying a SpriteKit object outside of the normal callbacks.
Tips:
Use
DispatchQueue.asyncandasyncAfterto set flags and do not interact with SpriteKit objects (e.g., SKTexture, SKNode, SKShader, etc.). Check flags within your scene's update callback to operate on SpriteKit objects at that time.See the SKScene API reference > Figure 3 - Frame processing in a scene for the complete list of callbacks.
How to animate the stroking of a path
SKShapeNode's path can be animated by supplying a custom strokeShader that outputs based on a few SKShader properties, v_path_distance and u_path_length. Note that within the shader supplied below, u_current_percentage is added by us and refers to the current point within the path we want stroked up to. By that, the scene determines the pace of the animated stroking. Also note since strokeShader is a fragment shader, it outputs an RGB at every step which allows the stroke to be a gradient color if desired, which is demonstrated by the use of u_color_start and u_color_end.
The shader is defined in a text file named "gradientStroke.fsh" added to the Xcode project:
void main() |
{ |
if(u_path_length == 0.0) { |
// error as u_path_length should never be zero, draw magenta |
gl_FragColor = vec4(1.0, 0.0, 1.0, 1.0); |
} |
else if(v_path_distance / u_path_length <= u_current_percentage) { |
float c = v_path_distance / u_path_length; |
float v = 1.0 - c; |
vec4 l = u_color_start; |
vec4 r = u_color_end; |
gl_FragColor = vec4(clamp( l.r*v + r.r*c, 0.0, 1.0), |
clamp(l.g*v + r.g*c, 0.0, 1.0), |
clamp(l.b*v + r.b*c, 0.0, 1.0), |
clamp(l.a*v + r.a*c, 0.0, 1.0)); |
} |
else { |
gl_FragColor = vec4(0.0, 0.0, 0.0, 0.0); |
} |
} |
Sample SKScene subclass using the stroke shader:
import SpriteKit |
import GameplayKit |
class GameScene: SKScene { |
var strokeShader: SKShader! |
var strokeLengthUniform: SKUniform! |
// define the start and end colors here |
var startColorUniform = SKUniform(name: "u_color_start", |
vectorFloat4: vector_float4([1.0, 1.0, 0.0, 1.0])) |
var endColorUniform = SKUniform(name: "u_color_end", |
vectorFloat4: vector_float4([1.0, 0.0, 0.0, 1.0])) |
var _strokeLengthFloat: Float = 0.0 |
var strokeLengthKey: String! |
var strokeLengthFloat: Float { |
get { |
return _strokeLengthFloat |
} |
set(newStrokeLengthFloat) { |
_strokeLengthFloat = newStrokeLengthFloat |
strokeLengthUniform.floatValue = newStrokeLengthFloat |
} |
} |
override func didMove(to view: SKView) { |
// percentage is the only variable uniform since start and end color don't change |
strokeLengthUniform = SKUniform(name: "u_current_percentage", float: 0.0) |
// pass all uniforms to the shader |
strokeShader = SKShader(fileNamed: "gradientStroke.fsh") |
strokeShader.uniforms = [strokeLengthUniform, startColorUniform, endColorUniform] |
strokeLengthFloat = 0.0 |
let cameraNode = SKCameraNode() |
self.camera = cameraNode |
let path = CGMutablePath() |
path.addRoundedRect(in: CGRect(x: 0, y: 0, width: 200, height: 150), |
cornerWidth: 35, |
cornerHeight: 35, |
transform: CGAffineTransform.identity) |
let shapeNode = SKShapeNode(path: path) |
shapeNode.lineWidth = 17.0 |
addChild(shapeNode) |
shapeNode.addChild(cameraNode) |
shapeNode.strokeShader = strokeShader |
// center camera over the rounded rectangle |
let rect = shapeNode.calculateAccumulatedFrame() |
cameraNode.position = CGPoint(x: rect.size.width/2.0, y: rect.size.height/2.0) |
} |
override func update(_ currentTime: TimeInterval) { |
// The amount incremented determines the pace of the animation. |
strokeLengthFloat += 0.01 |
if strokeLengthFloat > 1.0 { |
strokeLengthFloat = 0.0 |
} |
} |
} |
Zooming nodes about an arbitrary screen point
Zooming a node on a particular screen point can be challenging in SpriteKit. An intuitive thought is to use anchorPoint and scale to do so, however, a few caveats make it challenging:
Changing a node's scale does not change its size (therefore, nor does it change its underlying coordinate system). That can be an unintuitive fact and it complicates point conversion by requiring you to factor out the scale yourself.
Not every SKNode derivative has an anchorPoint on which
scalesizes about, and for those that do, adjusting the anchorPoint changes its visual location in the scene. This can be an unintuitive fact and it complicates the use of anchorPoint for zooming because it requires the unintended translation to be undone.
A simple alternative approach is to use position and size instead. The following code snippets demonstrate zooming in and out around the mouse pointer.
Convert screen coordinates of the mouse to coordinates of the node and create a custom anchor point:
class GameScene: SKScene {...
func setAnchorPointBasedOnMousePosition() {// get mouse location of the previous-most mouseMoved event
let locationInScene = mouseEvent.location(in: self)
// convert its screen location to its location within the frogSprite
var locationInFrogSprite = convert(locationInScene, to: frogSprite)
// bounds check to ensure the custom anchor point does not lie outside the frogSprite.
locationInFrogSprite.x = clamp(locationInFrogSprite.x, 0.0, frogSprite.size.width)
locationInFrogSprite.y = clamp(locationInFrogSprite.y, 0.0, fromSprite.size.height)
// create a percentage-based anchor point (values between 0..1)
tempAnchorPoint = CGPoint(x: locationInFrogSprite.x / frogSprite.size.width,
y: locationInFrogSprite.y / frogSprite.size.height)
}
func clamp<T: Comparable>(_ value: T, _ lower: T, _ upper: T) -> T {return min( max(value, lower), upper)
}
Set the new zoom scale and do so about the custom anchor point:
var zoomScale: CGFloat {get {return _zoomScale
}
set(newZoomScale) {_zoomScale = newZoomScale
let newSize = CGSize(width: frogSpriteInitialSize.width * _zoomScale,
height: frogSpriteInitialSize.height * _zoomScale)
let oldSize = frogSprite.size
let sizeDiff = CGSize(width: oldSize.width - newSize.width,
height: oldSize.height - newSize.height)
// updating size instead of scale changes its coordinate system which helps point conversion on subsequent zooms
frogSprite.size = newSize
// the position changes on zoom. Use the custom anchor point made above
frogSprite.position.x += sizeDiff.width * tempAnchorPoint.x
frogSprite.position.y += sizeDiff.height * tempAnchorPoint.y
}
}
Finally, to zoom, call both methods in succession:
func zoom(_ factor: CGFloat) {setAnchorPointBasedOnMousePosition()
zoomScale *= factor // calls the zoomScale setter above
}
Figure 2 - zooming nodes with the above code using mouse location as the anchor point.
SKShader limitations
The following are known limitations of SKShader in addition to debugging tips.
Limitations of SKShader
Custom shader code supplied to SKShader must be written in the OpenGL ES 2.0 shading language (also known as GLSL ES or ESSL). Metal shading language is not supported. See the SKShader API reference for more information. The ESSL specification is maintained by the Khronos Group, and is linked here for your reference when writing shaders for use with SKShader.
GL extension checking within shader code supplied to SKShader is not supported.
SKShader compilation failure logging is off when using the convenience initializer. See Enable shader compilation failure logging for steps to turn it on.
Debugging Tips
The following list of topics are helpful in troubleshooting general SpriteKit development issues.
Choosing the renderer
Originally, SpriteKit was implemented in OpenGL and then moved to Metal in iOS 9 & OS X 10.11. It's important to be mindful of this for debugging purposes because some issues exhibit in one renderer but not the other. If you're experiencing what you believe to be a SpriteKit bug, switch the renderer and check for different results. While one renderer might offer a temporary workaround, you must file a bug report for renderer differences so the real underlying issue can be assessed for a fix.
To choose the renderer, see:
To confirm which renderer is active, use the code:
let defaults = UserDefaults.standard
var dict = [String:Any]()
dict["debugDrawStats_SKContextType"] = true
defaults.set( dict, forKey: "SKDefaults" )
This will print "Metal" or "OpenGL" in the bottom corner of the SKView depending on which renderer is active.
Debugging SpriteKit memory problems
Problems with ever-increasing memory are not isolated to SpriteKit games but this section speaks to a few instances that commonly arise.
Tab-based SpriteKit apps and SKScene caching
Apps that show SpriteKit scenes in a tab format can fill up memory quickly if prior scenes are not released while changing from one tab to another. For more imformation, see QA1889 - Tab-based SpriteKit Apps and Scene Caching.
General memory problems
The following list are general techniques to troubleshoot memory issues and their example use with SpriteKit games.
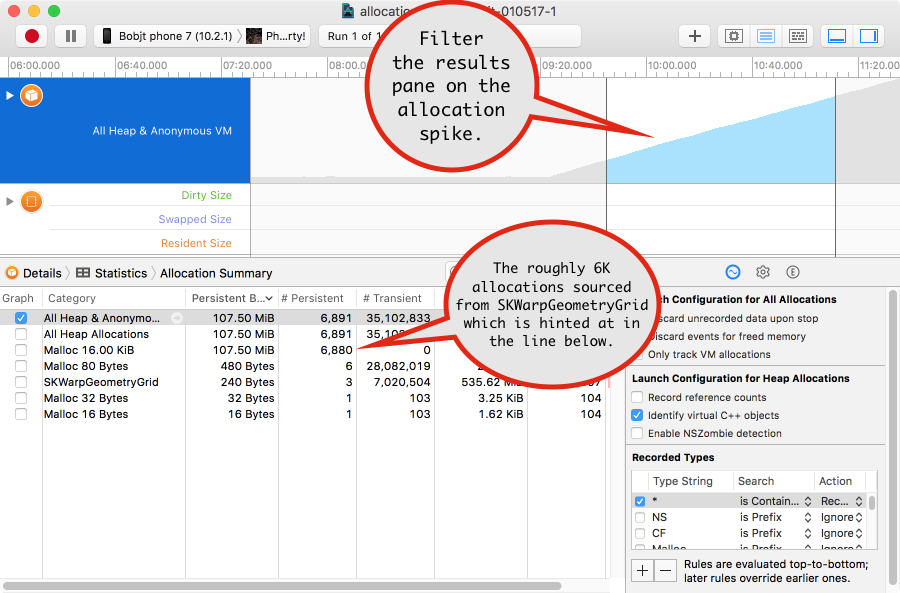
Use the Allocations instrument to troubleshoot memory allocation anomalies like runaway memory use. See TN2434 - Minimizing your app's Memory Footprint for a complete walkthrough. An example scenario of how the Allocations instrument was used to resolve a SpriteKit memory issue is depicted in Figure 3.
Figure 3 - the Allocations instrument lead straight to an app coding problem in which a SpriteKit game occasionally entered in infinite loop that created SKWarpGeometryGrids.
Use Xcode's memory graph tool to check why certain objects are still in memory and their number of repetitions. This tool was added to Xcode 8 and introduced in WWDC '16 session 410 - Visual Debugging with Xcode. An example scenario of how Xcode's memory graph was used to resolve a SpriteKit memory issue is depicted in Figure 4.
Figure 4 - Xcode's memory graph revealed the culprit of unreleased scenes in one app was due to a bug in SKPerformSelector. Its mistaken strong reference created a retain cycle with its owner, GameScene. While the bug was being fixed, the memory incline was worked around by temporarily omitting the use of
SKAction'sperformSelector.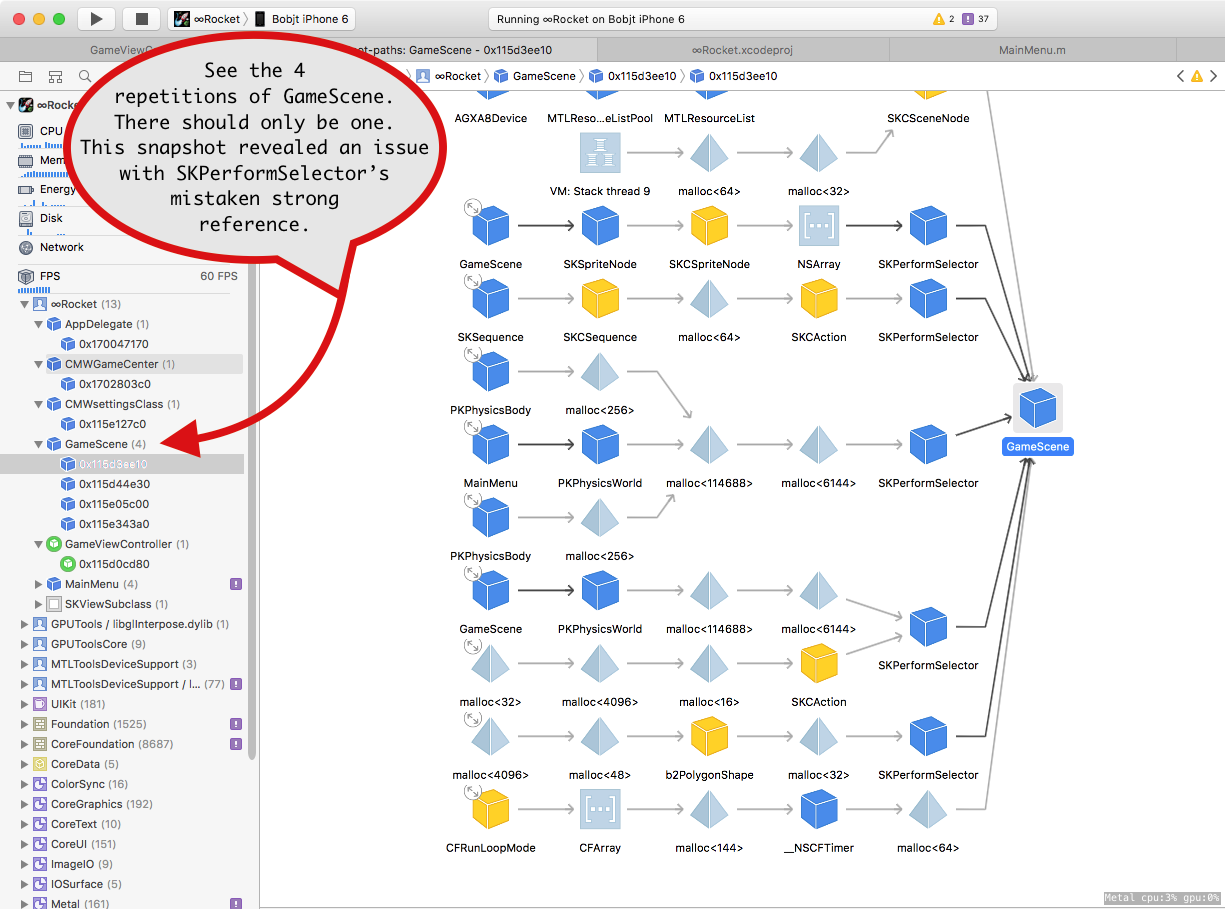
Tip: use the left-sidebar to find objects by class name and select it to display its retains in the center pane.
Debugging SpriteKit performance issues
This section covers tips to debug performance issues in SpriteKit games.
Use Time Profiler to track down gameplay hiccups
The Time Profiler instrument shows which APIs are spending the most time. An example scenario of how Time Profiler was used to solve a SpriteKit performance issue is depicted in Figure 5.
Figure 5 - this Time Profiler run revealed that a noticeable hiccup in gameplay was due to the decoding on an image from disk on-the-fly. This is known to be an expensive operation. The hint the image was from an Assets Catalog led to the app's use of
SKSpriteNode( imageNamed: ). Because sprite images were being reused, the problem was solved by allocating an SKTexture one time at the start of the scene and sharing it throughout gameplay by allocating sprites withSKSpriteNode( texture:, color:, size: )instead.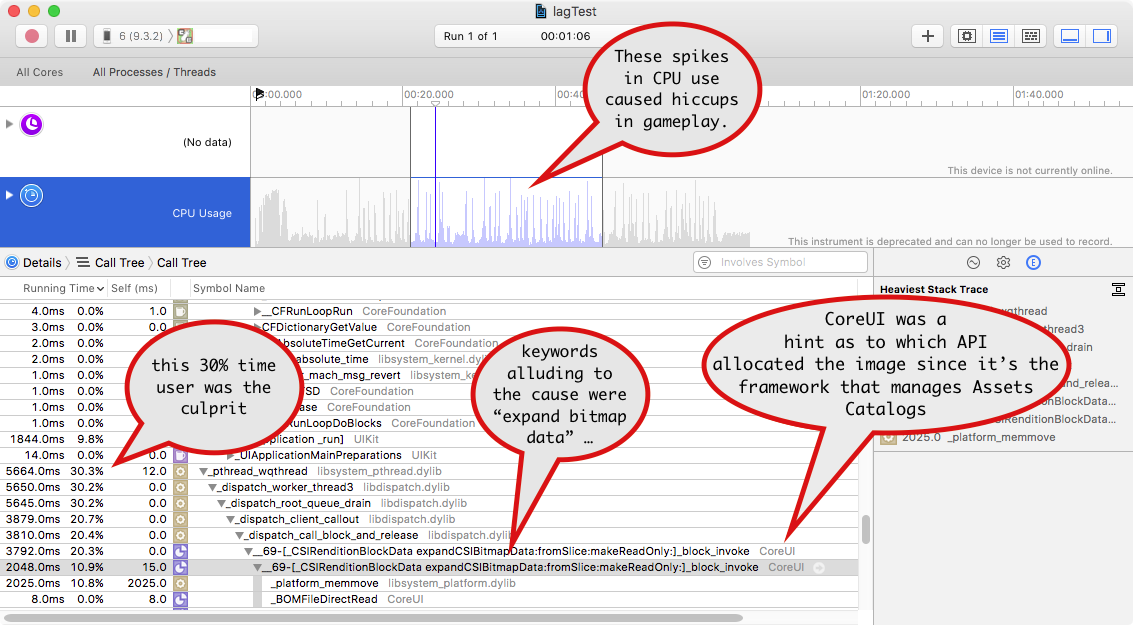
By default, Time Profiler sorts its results descending by largest time using APIs. The coding optimization made here was the second largest time user on the list (the first was SpriteKit's rendering) so we didn't have to look far to find the problem.
Enable shader compilation failure logging
If an SKShader is not working and you're unsure why, check for compilation errors in Xcode's console. Note that error handling is encapsulated when using SKShader's convenience initializer init( fileNamed: ) (see the signature comments in SKShader.h). To enable compilation failure logging, use SKShader( source:, uniforms: ) instead. Here's an example:
func shaderWithFileNamed( _ filename: String?, |
fileExtension: String?, |
uniforms: [SKUniform]? = nil) -> SKShader? { |
let path = Bundle.main.path( forResource: filename, ofType: fileExtension ) |
guard let source = try? NSString(contentsOfFile: path!, encoding: String.Encoding.utf8.rawValue) else { |
return nil |
} |
let shader: SKShader |
if let uniforms = uniforms { |
shader = SKShader( source: source as String, uniforms: uniforms) |
} |
else { |
shader = SKShader( source: source as String) |
} |
return shader |
} |
Create a focused sample
Often times when troubleshooting a SpriteKit issue, isolating the problem in a new smaller Xcode project can lead to a resolution. That's because isolating the problematic behavior with minimal code distills the issue to the handful of APIs that could be responsible. Another benefit is that alternative options become more clear which can increase the chances of finding a workaround. Remember to file a bug using the online Bug Reporter for any issues that you think might be a bug in an Apple framework.
Document Revision History
| Date | Notes |
|---|---|
| 2017-02-21 | New document that covers common issues encountered when developing SpriteKit games and general tips specific to debugging SpriteKit apps. |
Copyright © 2017 Apple Inc. All Rights Reserved. Terms of Use | Privacy Policy | Updated: 2017-02-21