Retired Document
Important: This document may not represent best practices for current development. Links to downloads and other resources may no longer be valid.
New Features in Instruments 4.1
This chapter provides a summary of some of the new features in Instruments 4.1.
DTPerformanceSession and System Trace
The DTPerformanceSession framework in Instruments 4.1 supports profiling with System Trace. The command-line tool iprofiler, which is implemented using DTPerformanceSession, also supports profiling with System Trace.
DTPerformanceSession was introduced in Instruments 4.0 to allow Mac apps to record performance data using a C API. For more information, see DTPerformanceSession Framework.
Deferred Display Mode
Instruments 4.1 can be configured to always use deferred display mode. In this mode, the analysis and display of data in a trace document is deferred until the recording of trace data is complete. Deferred display mode is useful when measuring your application’s performance because it minimizes the overhead of the Instruments application itself during the recording phase.
To always use deferred display mode, choose Instruments > Preferences and select “Always use deferred mode” in the General pane.
Time Profiler Strategies
The Time Profiler instrument in Instruments 4.1 displays the strategy control bar. The strategy control bar is a UI feature that was introduced in Instruments 4.0 for System Trace.
In Time Profiler, you use the buttons at the left end of this bar to display the track view pane using one of three strategies:
CPU strategy (leftmost button) displays CPU activity on each active core. This strategy can help you determine if your application has achieved concurrency.
Instruments strategy (middle button) displays CPU activity in a single track. This is the default strategy.
Threads strategy (rightmost button) displays CPU activity per individual thread.
Figure 2-1 shows a trace document with the CPU strategy selected.

If you’re developing applications that run on iPad 2, you can use the CPU strategy in Time Profiler to measure activity on each CPU core. An application that supports concurrency should show evidence of activity on both iPad 2 cores at the same time.
The CPU strategy is currently available only in Time Profiler.
Settings to Limit Processor Cores
Instruments 4.1 can be configured to limit the number of active processor cores. In this way you can model the performance of your application on similar systems with fewer cores. For example, if your MacBook Pro has four active cores, you can limit the number of active cores to two before profiling to model a MacBook Pro with two cores.
If your CPU supports hardware multithreading (also called Hyper-Threading), each physical core has a second logical core. For example, if hardware multithreading is active, a system with four physical cores has a total of eight cores.
To configure the number of active processor cores, you choose Instruments > Preferences. In the General pane, you select or deselect “Hardware Multi-Threading” if the feature is supported. Then you use the slider to select the desired number of active cores.
These settings persist until you change the preferences again or reboot the system.
Setting to Resize Tracks
Instruments 4.1 can be configured to automatically resize tracks to fit the width of the track pane. The resize action occurs at the end of a run.
To enable this option, choose Instruments > Preferences. In the Display pane, select “Always snap track to fit at end of run”.
Note that to use this feature manually, you can always select a track and choose View > Snap Track to Fit.
Cocoa Layout
Cocoa Layout is a new instrument that allows you to observe changes to NSLayoutConstraint objects at runtime. You use this instrument as one part of the workflow for debugging issues with the new Cocoa Autolayout system. The Autolayout system is available in OS X v10.7. For more information about Autolayout, see Auto Layout Guide.
Full Screen
Instruments 4.1 supports the new full-screen presentation option in OS X v10.7.
To enter full-screen mode, choose View > Full Screen or click the Enter Full Screen button in the upper-right corner of the trace document. To exit full-screen mode, choose View > Full Screen again to deselect it or click the Exit Full Screen button at the right end of the menu bar.
Flag Table Menu Command
To display the flag table, the menu command has been changed to Window > Manage Flags. The keyboard equivalent for this command remains Shift-Command-T.
Signpost Events
Even with all of the system-level instrumentation included in the Instruments application, you might find that it is helpful or even necessary to further instrument your code. Instruments supports the insertion of signposts in your code to emit system-level events. For example, you could use signposts to orient yourself within a long trace or to time certain operations. Signposts are more useful than signal flags if you want to emit high-rate events or emit events in a kernel extension.
Instruments supports two types of signposts:
Point events (no duration)
Interval events (with beginning and ending points)
Use point events to orient yourself within a larger trace. For example, if you are developing an application that operates on video frames, you can insert a point event whenever the processing of a new frame has begun. Use interval events to time operations, such as the length a particular lock is held, or how long it takes to decode a frame of video.
To record signposts, the System Calls instrument must be in your trace document. To create a trace document with the System Calls instrument, use the System Trace template. Signpost events are displayed in the System Calls event list.
To find your signposts in the event list, you must first make Instruments aware of your custom signpost definitions. Do so by filling in the Signposts table in the System Calls instrument. Add one signpost definition per line. Each line should contain an event code followed by an event name, as illustrated in Figure 2-2.
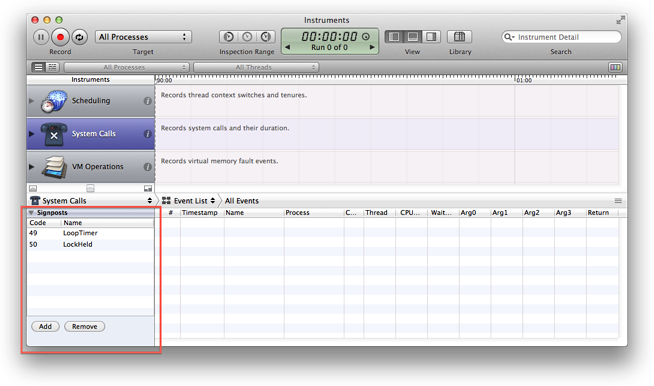
Signpost event codes can take any integer value from 0 to 16383, inclusive.
After you’ve added signpost definitions to a trace document, you can add signposts to your source code. There are two ways to do this, depending on where your code runs:
User applications. OS X and iOS applications create signposts using explicit system calls. You need to include
<sys/syscall.h>and<sys/kdebug.h>, and then use the following call (with a signpost-type suffix ofNONEfor a point signpost,STARTfor begin interval, andENDfor end interval):syscall(SYS_kdebug_trace, APPSDBG_CODE(DBG_MACH_CHUD, <your event code>) | DBG_FUNC_<type>, arg1, arg2, arg3, arg4);
Kernel extensions. OS X kernel extensions must call the
kernel_debugfunction directly, using theAPPSDBG_CODEmacro as thedebugidargument. You need to include<sys/kdebug.h>, and then make a call like this (the signpost-type suffixes are the same as in thesyscallcase):KERNEL_DEBUG(APPSDBG_CODE(DBG_MACH_CHUD, <your event code>) | DBG_FUNC_<type>, arg1, arg2, arg3, arg4, 0);
In both cases, the caller can record up to four user-defined data values with each signpost. These values are displayed in the System Calls event list.
When using interval events, the start and end points are coalesced into one signpost with a duration equal to the elapsed time between the two events. You must ensure that the same code value is given for both the start and end points. It is possible to nest signposts—just be sure you match the code value for each start and end point.
Listing 2-1 shows how to create an interval signpost that times a loop in an application.
Listing 2-1 Signpost example
#include <sys/syscall.h> |
#include <sys/kdebug.h> |
#define LOOP_TIMER 49 |
#define ITERATIONS 1000 |
/* the last 4 arguments are user-defined data */ |
syscall(SYS_kdebug_trace, APPSDBG_CODE(DBG_MACH_CHUD, LOOP_TIMER) | DBG_FUNC_START, ITERATIONS, 0, 0, 0); |
for (int ii = 0; ii < ITERATIONS; ii++) { |
do_some_stuff(); |
do_more_stuff(); |
} |
/* notice that the code value used here matches that used above */ |
syscall(SYS_kdebug_trace, APPSDBG_CODE(DBG_MACH_CHUD, LOOP_TIMER) | DBG_FUNC_END, ITERATIONS, 0, 0, 0); |
Copyright © 2012 Apple Inc. All Rights Reserved. Terms of Use | Privacy Policy | Updated: 2012-02-16