Mac OS X Debugging Magic
Mac OS X contains a number of 'secret' debugging facilities, including environment variables, preferences, routines callable from GDB, and so on. This technotes describes these facilities. If you're developing for Mac OS X, you should look through this list to see if you're missing out on something that will make your life easier.
Introduction
All Apple systems include debugging facilities added by Apple engineering teams to help develop and debug specific subsystems. Many of these facilities remain in released system software and you can use them to debug your code. This technote describes some of the more broadly useful ones. In cases where a debugging facility is documented in another place, there's a short overview of the facility and a link to the existing documentation.
Many of the details covered in this technote vary from platform to platform and release to release. As such, you may encounter minor variations between platforms, and on older or newer systems. Known significant variations are called out in the text.
This technote was written with reference to Mac OS X 10.6.
This technote covers advanced debugging techniques. If you're just getting started, you should consult the following material:
GDB is the system's primary debugging tool. For a full description of GDB, see Debugging with GDB.
Xcode is Apple's integrated development environment (IDE). It includes a sophisticated graphical debugger, implemented as a wrapper around GDB. For more information about Xcode, see the "Tools & Languages" section of the Apple developer Reference Library.
This technote does not cover performance debugging. If you're trying to debug a performance problem, the best place to start is the Getting Started with Performance document.
Basics
The later sections of this technote describe the debugging facilities in detail. Many of these facilities use similar techniques to enable and disable the facility, and to see its output. This section describes these common techniques.
Enabling Debugging Facilities
Some debugging facilities are enabled by default. However, most facilities must be enabled using one of the techniques described in the following sections.
Environment Variables
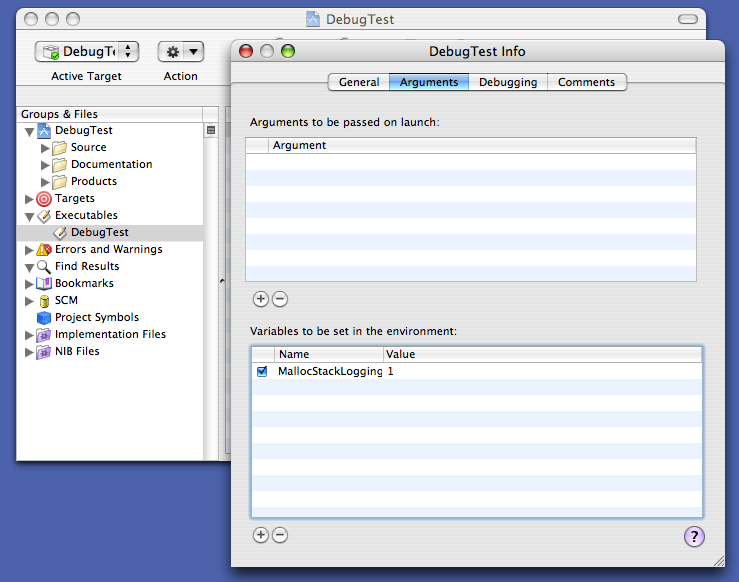
In many cases you can enable a debugging facility by setting a particular environment variable. You can do this using the executable inspector in Xcode. Figure 1 shows an example of this.
In addition, there are a numerous other ways to set an environment variable. The first involves running your application from Terminal and specifying the environment variable on the command line. Listing 1 shows how to set an environment variable in the sh shell; Listing 2 shows the equivalent in csh.
Listing 1 Setting an environment variable in an sh-compatible shell
$ MallocScribble=1 /Applications/TextEdit.app/Contents/MacOS/TextEdit TextEdit(13506) malloc: enabling scribbling to detect mods to free blocks […] |
Listing 2 Setting an environment variable in a csh-compatible shell
% env MallocScribble=1 /Applications/TextEdit.app/Contents/MacOS/TextEdit TextEdit(13512) malloc: enabling scribbling to detect mods to free blocks […] |
In addition, you can set environment variables in GDB, as shown in Listing 3.
Listing 3 Setting an environment variable in GDB
$ gdb /Applications/TextEdit.app GNU gdb 6.3.50-20050815 […] (gdb) set env MallocScribble 1 (gdb) r Starting program: /Applications/TextEdit.app/Contents/MacOS/TextEdit bash(13587) malloc: enabling scribbling to detect mods to free blocks […] |
Technical Q&A QA1067, 'Setting environment variables for user processes' describes a mechanism for setting environment variables for all processes launched by a specific user.
Finally, you can use launchctl to set environment variables inherited by all processes run by launchd; see launchd for details.
Preferences
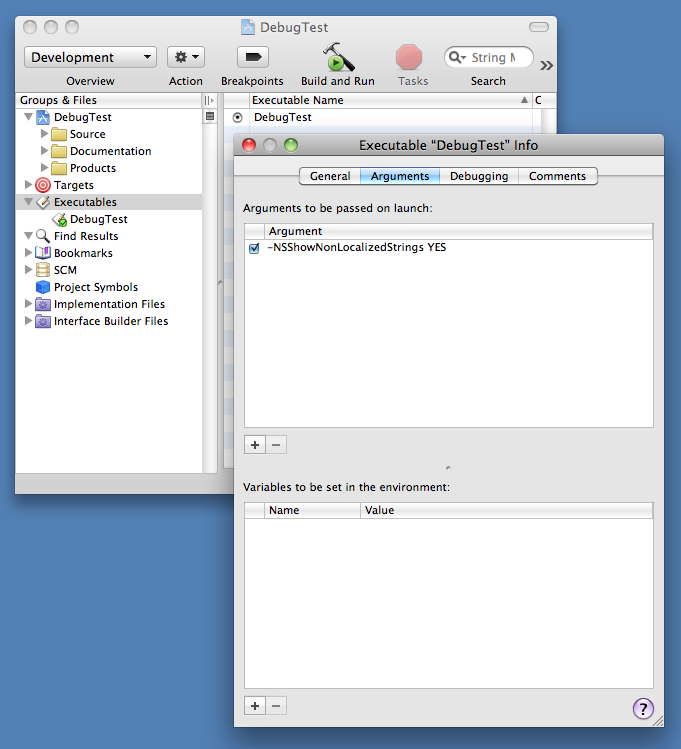
Some debugging facilities are enabled by setting a special preference. You can set such a debugging preference by configuring a command line argument in Xcode. Figure 2 shows how this is done.
You can also do this by running your program from the command line, and supplying the preference in the arguments. Listing 4 shows an example.
Listing 4 Temporarily setting a preference
$ /Applications/TextEdit.app/Contents/MacOS/TextEdit -NSTraceEvents YES 2004-10-25 17:28:41.143 TextEdit[5774] timeout = 62993575878.857864 seco… 2004-10-25 17:28:41.179 TextEdit[5774] got apple event of class 61657674… […] |
In addition to the temporary techniques described above, you can set preferences permanently using the defaults command line tool. Listing 5 shows how to do this. This listing sets the NSTraceEvents preference for the TextEdit application (whose bundle identifier is com.apple.TextEdit) to YES.
Listing 5 Setting a preference using defaults
$ defaults write com.apple.TextEdit NSTraceEvents YES $ /Applications/TextEdit.app/Contents/MacOS/TextEdit 2010-02-01 13:32:36.260 TextEdit[18687:903] timeout = 62827180043.739540 seconds[…] 2010-02-01 13:32:36.273 TextEdit[18687:903] got apple event of class 61657674, I[…] […] |
Once you're finished debugging, you should delete the preference, also using defaults, as shown in Listing 6.
Listing 6 Deleting a preference using defaults
$ defaults delete com.apple.TextEdit NSTraceEvents |
For more information about defaults, consult its man page.
Callable Routines
Many system frameworks include routines that print debugging information to stderr. These routines may be specifically designed to be callable from within GDB, or they may just be existing API routines that are useful while debugging. Listing 7 shows an example of how to call a debugging routine from GDB; specifically, it calls CFBundleGetAllBundles to get a list of all the bundles loaded in the application, and then prints that list by calling the CFShow routine.
Listing 7 Calling a debugging routine from GDB
(gdb) call (void)CFShow((void *)CFBundleGetAllBundles())
<CFArray 0x10025c010 [0x7fff701faf20]>{type = mutable-small, count = 59, values = (
    0 : CFBundle 0x100234d00 </System/Library/Frameworks/CoreData.framework> …
    […]
    12 : CFBundle 0x100237790 </System/Library/Frameworks/Security.framework> …
    […]
    23 : CFBundle 0x100194eb0 </System/Library/Frameworks/CoreFoundation.framework> …
    […]
)} |
If you don't see the output from the routine, you may need to look at the console log, as described in the Seeing Debug Output section.
In practice, this only affects Intel 32-bit code.
Files
Certain debugging facilities are enabled by the existence of specific files within the file system. Listing 8 shows an example of this: creating the file /var/log/do_dnserver_log causes the CFNotificationCenter server (distnoted) to record information about all notifications to the system log.
Listing 8 Create a specific file to enable debugging
$ # IMPORTANT: This example is for Mac OS X 10.6 and later. $ # See the "CFNotificationCenter" section for details on how $ # to do this on earlier systems. $ $ sudo touch /var/log/do_dnserver_log [… now restart …] $ tail -f /var/log/system.log Virtual-Victim:~ quinn$ tail -f /var/log/system.log […] distnoted[16]: checking_client "quicklookd" [43] […] distnoted[16]: checking_client "Dock" [43] […] distnoted[16]: checking_client "mds" [1] […] distnoted[16]: checking_client "mDNSResponder" [1] […] distnoted[16]: checking_client "fontd" [43] […] |
For more information about this specific example, see CFNotificationCenter.
Signals
Many Mac OS X subsystems, especially those with a BSD heritage, implement debugging facilities that you access via signals. For example, if you send the SIGINFO signal to mDNSResponder, it will dump its current state to the system log.
You can send signals programmatically or from the command line. To send a signal programmatically, use the kill routine. To send a signal from the command line, use either the kill command (if you know the process ID) or the killall command (if you know the process name).
When using these commands line tools, be aware that this technote uses the signal identifier (for example, SIGINFO) whereas these commands line tools use the signal name (INFO). So, to send a SIGINFO to mDNSResponder, you would use the command shown in Listing 9.
Listing 9 Sending a signal
$ sudo killall -INFO mDNSResponder |
Seeing Debug Output
Programs that generate debug output generally do so using one of following mechanisms:
NSLogprinting to
stderrsystem log
kernel trace facility
NSLog is a high-level API for logging which is used extensively by Objective-C code. The exact behaviour of NSLog is surprisingly complex, and has changed significantly over time, making it beyond the scope of this document. However, it's sufficient to know that NSLog prints to stderr, or logs to the system log, or both. So, if you understand those two mechanisms, you can see anything logged via NSLog.
Printing to stderr is one of the most commonly used output mechanism. Given this topic's importance, it is covered in depth in the next section.
You can view the system log using the Console application (in /Applications/Utilities). You can learn more about the system log facility in the syslog man pages (asl, syslog, syslog.conf, and syslogd).
The kernel trace facility is a specialized low-latency, high-availability logging mechanism. In most cases a program that logs to the kernel trace facility also includes a way to view the log (for example, the fs_usage tool both enables file system usage logging and prints the results).
Console Output
Many programs, and indeed many system frameworks, print debugging messages to stderr. The destination for this output is ultimately controlled by the program: it can redirect stderr to whatever destination it chooses. However, in most cases a program does not redirect stderr, so the output goes to the default destination inherited by the program from its launch environment. This is typically one of the following:
If you launch a GUI application as it would be launched by a normal user, the system redirects any messages printed on
stderrto the system log. You can view these messages using the techniques described earlier.If you run a program from within Xcode, you can see its
stderroutput in Xcode's debugger Console window (choose the Console menu item from the Run menu to see this window).Finally, if you run a program (be it GUI or non-GUI) from within Terminal, its
stderris connected to your Terminal window; anything the program prints will appear in this window. This also applies to programs run from GDB within a Terminal window.
Console messages (that is, system log records created in response to an application printing to stderr) are specially tagged to make them easy to find in the system log. There are two techniques for viewing these messages:
In the Console application (in
/Applications/Utilities), there's a side bar item labelled Console Messages. If you select that item, the window displays only this type of message.You can query ASL for console messages with the command shown in Listing 10.
Listing 10 Querying ASL for console messages
$ # This command just does a query and prints the results. $ syslog -C […] […].com.apple.TextEdit[4373] <Notice>: Hello Cruel World! $ # This command does the query, prints the results, and then waits $ # for any new results. Press ^C to stop it. $ syslog -w -C […] […].com.apple.TextEdit[4373] <Notice>: Hello Cruel World! […].com.apple.TextEdit[4373] <Notice>: Goodbye Cruel World! ^C |
Listing 11 Viewing console messages prior to Mac OS X 10.5
$ # This command prints the entire console log. $ cat /Library/Logs/Console/`id -u`/console.log […] Hello Cruel World! $ # This command prints the last few lines of the console log $ # and then waits for any new results. Press ^C to stop it. $ tail -f /Library/Logs/Console/`id -u`/console.log […] Hello Cruel World! Goodbye Cruel World! ^C |
Attaching to a running program (using Xcode's Attach to Process menu, or the attach command in GDB) does not automatically connect the program's stderr to your GDB window. You can do this from within GDB using the trick described in the "Seeing stdout and stderr After Attaching" section of Technical Note TN2030, 'GDB for MacsBug Veterans'.
Some Assembly Required
While it's very unusual to write a significant amount of code in assembly language these days, it's still useful to have a basic understanding of that dark art. This is particularly true when you're debugging, especially when you're debugging crashes that occur in libraries or frameworks for which you don't have the source code. This section covers some of the most basic techniques necessary to debug programs at the assembly level. Specifically, it describe how to set breakpoints, access parameters, and access the return address on all supported architectures.
All the assembly-level debugging examples shown in this technote are from 64-bit programs running on an Intel-based Macintosh computer. However, it's relatively easy to adapt these examples to other architectures. The most significant differences are:
accessing parameters
getting the return address
And these are exactly the items covered by the following architecture-specific sections.
In this context, standard parameters are integers (that fit in a single register), enumerations, and pointers (including pointers to arrays and pointers to functions). Non-standard parameters are floating point numbers, vectors, structures, integers bigger than a register, and any parameter after the last fixed parameter of a routine that takes a variable number of arguments.
For a detailed description of the calling conventions for all Mac OS X architectures, see Mac OS X ABI Function Call Guide.
Before you read the following sections, it's critical that you understand one GDB subtlety. Because GDB is, at heart, a source-level debugger, when you set a breakpoint on a routine, GDB does not set the breakpoint on the first instruction of the routine; rather, it sets the breakpoint at the first instruction after the routine's prologue. From a source-level debugging point of view this make perfect sense. In a source-level debugger you never want to step through the routine's prologue. However, when doing assembly-level debugging, it's easier to access parameters before the prologue runs. That's because the location of the parameters at the first instruction of a routine is determined by the function call ABI, but the prologue is allowed to shuffle things around at its discretion. Moreover, each prologue can do this in a slightly different way. So the only way to access parameters after the prologue has executed is to disassemble the prologue and work out where everything went. This is typically, but not always, quite easy, but it's still extra work.
The best way to tell GDB to set a breakpoint at the first instruction of a routine is to prefix the routine name with a "*". Listing 12 shows an example of this.
Listing 12 Before and after the prologue
$ gdb GNU gdb 6.3.50-20050815 (Apple version gdb-1346) […] (gdb) attach Finder […] (gdb) b CFStringCreateWithFormat Breakpoint 1 at 0x7fff86098290 (gdb) info break Num Type Disp Enb Address What 1 breakpoint keep y 0x00007fff86098290 <CFStringCreateWithFormat+32> (gdb) # The breakpoint is not at the first instruction. (gdb) # Disassembling the routine shows that GDB has skipped the prologue. (gdb) x/7i CFStringCreateWithFormat 0x7fff86098270 <CFStringCreateWithFormat>: push %rbp 0x7fff86098271 <CFStringCreateWithFormat+1>: mov %rsp,%rbp 0x7fff86098274 <CFStringCreateWithFormat+4>: sub $0xd0,%rsp 0x7fff8609827b <CFStringCreateWithFormat+11>: mov %rcx,-0x98(%rbp) 0x7fff86098282 <CFStringCreateWithFormat+18>: mov %r8,-0x90(%rbp) 0x7fff86098289 <CFStringCreateWithFormat+25>: mov %r9,-0x88(%rbp) 0x7fff86098290 <CFStringCreateWithFormat+32>: movzbl %al,%ecx (gdb) # So we use a "*" prefix to disable GDB's 'smarts'. (gdb) b *CFStringCreateWithFormat Breakpoint 2 at 0x7fff86098270 (gdb) info break Num Type Disp Enb Address What 1 breakpoint keep y 0x00007fff86098290 <CFStringCreateWithFormat+32> 2 breakpoint keep y 0x00007fff86098270 <CFStringCreateWithFormat> |
Finally, if you're looking for information about specific instructions, be aware that the Help menu in Shark (included in the Xcode developer tools) has an instruction set reference for ARM, Intel and PowerPC architectures.
Intel 64-Bit
In 64-bit Intel programs the first six parameters are passed in registers. The return address is on the stack, but keep in mind that it is a 64-bit value. Table 1 shows how to access these values from GDB when you've stopped at the first instruction of the function.
What | GDB Syntax |
|---|---|
return address | *(long*)$esp |
first parameter | $rdi |
second parameter | $rsi |
third parameter | $rdx |
fourth parameter | $rcx |
fifth parameter | $r8 |
sixth parameter | $r9 |
On return from a function the result is in register RAX ($rax).
Because parameters are passed in registers, there's no straightforward way to access parameters after the prologue.
Listing 13 shows an example of how to use this information to access parameters in GDB.
Listing 13 Parameters on Intel 64-Bit
$ # Use the -arch x86_64 argument to GDB to get it to run the $ # 64-bit Intel binary. Obviously this will only work on 64-bit capable $ # hardware. $ gdb -arch x86_64 /Applications/TextEdit.app GNU gdb 6.3.50-20050815 (Apple version gdb-1346) […] (gdb) fb CFStringCreateWithFormat Breakpoint 1 at 0x624dd2f1959290 (gdb) r Starting program: /Applications/TextEdit.app/Contents/MacOS/TextEdit Reading symbols for shared libraries […] Breakpoint 1, 0x00007fff86098290 in CFStringCreateWithFormat () (gdb) # We've stopped after the prologue. (gdb) p/a $pc $1 = 0x7fff86098290 <CFStringCreateWithFormat+32> (gdb) # We have to check whether the prologue (gdb) # has messed up the locations of the parameters. (gdb) x/7i $pc-32 0x7fff86098270 <CFStringCreateWithFormat>: push %rbp 0x7fff86098271 <CFStringCreateWithFormat+1>: mov %rsp,%rbp 0x7fff86098274 <CFStringCreateWithFormat+4>: sub $0xd0,%rsp 0x7fff8609827b <CFStringCreateWithFormat+11>: mov %rcx,-0x98(%rbp) 0x7fff86098282 <CFStringCreateWithFormat+18>: mov %r8,-0x90(%rbp) 0x7fff86098289 <CFStringCreateWithFormat+25>: mov %r9,-0x88(%rbp) 0x7fff86098290 <CFStringCreateWithFormat+32>: movzbl %al,%ecx (gdb) # Prologue hasn't messed up parameter registers, (gdb) # so we can just print them directly. (gdb) # (gdb) # first parameter is "alloc" (gdb) p/a $rdi $2 = 0x7fff70b8bf20 <__kCFAllocatorSystemDefault> (gdb) # second parameter is "formatOptions" (gdb) p/a $rsi $3 = 0x0 (gdb) # third parameter is "format" (gdb) call (void)CFShow($rdx) %@ (gdb) # return address is at RBP+8 (gdb) p/a *(long*)($rbp+8) $4 = 0x7fff8609a474 <__CFXPreferencesGetNamedVolatileSourceForBundleID+36> (gdb) # Now clear the breakpoint and set a new one before the prologue. (gdb) del 1 (gdb) b *CFStringCreateWithFormat Breakpoint 2 at 0x7fff86098270 (gdb) c Continuing. Breakpoint 2, 0x00007fff86098270 in CFStringCreateWithFormat () (gdb) # We're at the first instruction. We can (gdb) # access parameters without checking the prologue. (gdb) p/a $pc $5 = 0x7fff86098270 <CFStringCreateWithFormat> (gdb) # first parameter is "alloc" (gdb) p/a $rdi $6 = 0x7fff70b8bf20 <__kCFAllocatorSystemDefault> (gdb) # second parameter is "formatOptions" (gdb) p/a $rsi $7 = 0x0 (gdb) # third parameter is "format" (gdb) call (void)CFShow($rdx) managed/%@/%@ (gdb) # return address is on top of the stack (gdb) p/a *(long*)$rsp $8 = 0x7fff8609806a <__CFXPreferencesGetManagedSourceForBundleIDAndUser+74> (gdb) # Set a breakpoint on the return address. (gdb) b *0x7fff8609806a Breakpoint 3 at 0x7fff8609806a (gdb) c Continuing. Breakpoint 3, 0x00007fff8609806a in __CFXPreferencesGetManagedSourceForBundleIDAndUser () (gdb) # function result (gdb) p/a $rax $9 = 0x10010b490 (gdb) call (void)CFShow($rax) managed/com.apple.TextEdit/kCFPreferencesCurrentUser |
Intel 32-Bit
In 32-bit Intel programs, parameters are passed on the stack. At the first instruction of a routine the top word of the stack contains the return address, the next word contains the first (leftmost) parameter, the next word contains the second parameter, and so on. Table 2 shows how to access these values from GDB.
What | GDB Syntax |
|---|---|
return address | *(int*)$esp |
first parameter | *(int*)($esp+4) |
second parameter | *(int*)($esp+8) |
... and so on |
|
After the routine's prologue you can access parameters relative to the frame pointer (register EBP). Table 3 shows the syntax.
What | GDB Syntax |
|---|---|
previous frame | *(int*)$ebp |
return address | *(int*)($ebp+4) |
first parameter | *(int*)($ebp+8) |
second parameter | *(int*)($ebp+12) |
... and so on |
|
On return from a function the result is in register EAX ($eax).
Listing 14 shows an example of how to use this information to access parameters in GDB.
Listing 14 Parameters on Intel 32-Bit
$ # Use the -arch i386 argument to GDB to get it to run the $ # 32-bit Intel binary. $ gdb -arch i386 /Applications/TextEdit.app GNU gdb 6.3.50-20050815 (Apple version gdb-1346) […] (gdb) fb CFStringCreateWithFormat Breakpoint 1 at 0x31ec6d6 (gdb) r Starting program: /Applications/TextEdit.app/Contents/MacOS/TextEdit Reading symbols for shared libraries […] Breakpoint 1, 0x940e36d6 in CFStringCreateWithFormat () (gdb) # We've stopped after the prologue. (gdb) p/a $pc $1 = 0x940e36d6 <CFStringCreateWithFormat+6> (gdb) # However, for 32-bit Intel we don't need to inspect (gdb) # the prologue because the parameters are on the stack. (gdb) # We can access them relative to EBP. (gdb) # (gdb) # first parameter is "alloc" (gdb) p/a *(int*)($ebp+8) $2 = 0xa0473ee0 <__kCFAllocatorSystemDefault> (gdb) # second parameter is "formatOptions" (gdb) p/a *(int*)($ebp+12) $3 = 0x0 (gdb) # third parameter is "format" (gdb) call (void)CFShow(*(int*)($ebp+16)) %@ (gdb) # return address is at EBP+4 (gdb) p/a *(int*)($ebp+4) $4 = 0x940f59fb <__CFXPreferencesGetNamedVolatileSourceForBundleID+59> (gdb) # Now clear the breakpoint and set a new one before the prologue. (gdb) del 1 (gdb) b *CFStringCreateWithFormat Breakpoint 2 at 0x940e36d0 (gdb) c Continuing. Breakpoint 2, 0x940e36d0 in CFStringCreateWithFormat () (gdb) # We're at the first instruction. We must access (gdb) # the parameters relative to ESP. (gdb) p/a $pc $6 = 0x940e36d0 <CFStringCreateWithFormat> (gdb) # first parameter is "alloc" (gdb) p/a *(int*)($esp+4) $7 = 0xa0473ee0 <__kCFAllocatorSystemDefault> (gdb) # second parameter is "formatOptions" (gdb) p/a *(int*)($esp+8) $8 = 0x0 (gdb) # third parameter is "format" (gdb) call (void)CFShow(*(int*)($esp+12)) managed/%@/%@ (gdb) # return address is on the top of the stack (gdb) p/a *(int*)$esp $9 = 0x940f52cc <__CFXPreferencesGetManagedSourceForBundleIDAndUser+76> (gdb) # Set a breakpoint on the return address. (gdb) b *0x940f52cc Breakpoint 3 at 0x940f52cc (gdb) c Continuing. Breakpoint 3, 0x940f52cc in __CFXPreferencesGetManagedSourceForBundleIDAndUser () (gdb) # function result (gdb) p/a $eax $10 = 0x1079d0 (gdb) call (void)CFShow($eax) managed/com.apple.TextEdit/kCFPreferencesCurrentUser |
PowerPC
In PowerPC programs, be their 32- or 64-bit, the first eight parameters are passed in registers. The return address is in register LR. Table 4 shows how to access these values from GDB when you've stopped at the first instruction of the function.
What | GDB Syntax |
|---|---|
return address | $lr |
first parameter | $r3 |
second parameter | $r4 |
third parameter | $r5 |
fourth parameter | $r6 |
fifth parameter | $r7 |
sixth parameter | $r8 |
seventh parameter | $r9 |
eight parameter | $r10 |
On return from a function the result is in register GPR3 ($r3).
Because parameters are passed in registers, there's no straightforward way to access parameters after the prologue.
Listing 15 shows an example of how to use this information to access parameters in GDB. This example shows a 32-bit PowerPC; however, the 32- and 64-bit PowerPC function call ABIs are so similar that the procedure is virtually identical for 64-bit programs.
Listing 15 Parameters on PowerPC
$ gdb /Applications/TextEdit.app GNU gdb 6.3.50-20050815 (Apple version gdb-754) […] (gdb) fb CFStringCreateWithFormat Breakpoint 1 at 0x8b1bc (gdb) r Starting program: /Applications/TextEdit.app/Contents/MacOS/TextEdit Reading symbols for shared libraries […] Breakpoint 1, 0x90e871e8 in CFStringCreateWithFormat () (gdb) # We've stopped after the prologue. (gdb) p/a $pc $1 = 0x90e871e8 <CFStringCreateWithFormat+44> (gdb) # Let's see what the prologue has done to the registers (gdb) # holding our parameters. (gdb) x/12i $pc-44 0x90e871bc <CFStringCreateWithFormat>: mflr r0 0x90e871c0 <CFStringCreateWithFormat+4>: stw r0,8(r1) 0x90e871c4 <CFStringCreateWithFormat+8>: stwu r1,-96(r1) 0x90e871c8 <CFStringCreateWithFormat+12>: addi r0,r1,132 0x90e871cc <CFStringCreateWithFormat+16>: stw r6,132(r1) 0x90e871d0 <CFStringCreateWithFormat+20>: mr r6,r0 0x90e871d4 <CFStringCreateWithFormat+24>: stw r0,56(r1) 0x90e871d8 <CFStringCreateWithFormat+28>: stw r7,136(r1) 0x90e871dc <CFStringCreateWithFormat+32>: stw r8,140(r1) 0x90e871e0 <CFStringCreateWithFormat+36>: stw r9,144(r1) 0x90e871e4 <CFStringCreateWithFormat+40>: stw r10,148(r1) 0x90e871e8 <CFStringCreateWithFormat+44>: bl 0x90e871a4 […] (gdb) # Hey, the prologue hasn't modified GPR3..5, so we're OK. (gdb) # (gdb) # first parameter is "alloc" (gdb) p/a $r3 $2 = 0xa019e174 <__kCFAllocatorSystemDefault> (gdb) # second parameter is "formatOptions" (gdb) p/a $r4 $3 = 0x0 (gdb) # third parameter is "format" (gdb) call (void)CFShow($r5) %@ (gdb) # It turns out the prologue has left LR intact as well. (gdb) # So we can get our return address. (gdb) p/a $lr $4 = 0x90ebe604 <__CFXPreferencesGetNamedVolatileSourceForBundleID+60> (gdb) # However, things aren't always this easy. If the prologue (gbb) # has munged LR, you can the return address out of the frame. (gdb) p/a *(int*)($r1+96+8) $8 = 0x90ebe604 <__CFXPreferencesGetNamedVolatileSourceForBundleID+60> (gdb) # Now clear the breakpoint and set a new one before the prologue. (gdb) del 1 (gdb) b *CFStringCreateWithFormat Breakpoint 2 at 0x90e871bc (gdb) c Continuing. Breakpoint 2, 0x90e871bc in CFStringCreateWithFormat () (gdb) # We're at the first instruction. The parameters are guaranteed (gdb) # to be in the right registers. (gdb) p/a $pc $9 = 0x90e871bc <CFStringCreateWithFormat> (gdb) # first parameter is "alloc" (gdb) p/a $r3 $10 = 0xa019e174 <__kCFAllocatorSystemDefault> (gdb) # second parameter is "formatOptions" (gdb) p/a $r4 $11 = 0x0 (gdb) # third parameter is "format" (gdb) call (void)CFShow($r5) managed/%@/%@ (gdb) # return address is in LR (gdb) p/a $lr $12 = 0x90ebe938 <__CFXPreferencesGetManagedSourceForBundleIDAndUser+80> (gdb) # Set a breakpoint on the return address. (gdb) b *0x90ebe938 Breakpoint 3 at 0x90ebe938 (gdb) c Continuing. Breakpoint 3, 0x90ebe938 in __CFXPreferencesGetManagedSourceForBundleIDAndUser () (gdb) # function result (gdb) p/a $r3 $13 = 0x10e550 (gdb) call (void)CFShow($r3) managed/com.apple.TextEdit/kCFPreferencesCurrentUser |
Architecture Gotchas
The following sections describe a couple of gotchas you might encounter when debugging at the assembly level.
Extra Parameters
When looking at parameters at the assembly level, keep in mind the following:
If the routine is a C++ member function, there is an implicit first parameter for
this.If the routine is an Objective-C method, there are two implicit first parameters (see Objective-C for details on this).
On PowerPC, a 64-bit integer is passed in either one register (for 64-bit programs) or two registers (for 32-bit programs).
If the compiler can find all the callers of a function, it can choose to pass parameters to that function in a non-standard way. This is very uncommon on architectures that have an efficient register-based ABI, but it's reasonably common for Intel 32-bit programs. So, if you set a breakpoint on a routine that isn't exported in an Intel 32-bit program, watch out for this very confusing behavior.
Endianness and Unit Sizes
When examining memory in GDB, things go smoother if you use the correct unit size. Table 5 is a summary of the unit sizes supported by GDB.
Size | C Type | GDB Unit | Mnemonic |
|---|---|---|---|
1 byte | char | b | byte |
2 bytes | short | h | half word |
4 bytes | int | w | word |
8 bytes | long or long long | g | giant |
This is particularly important in the following cases:
When debugging a 64-bit program, many quantities (for example, all pointers, including a routine's return address) will be 64 bits. GDB's default unit size ('w') will only show you 32 bits. You will need to specify 'g' in order to see all 64 bits.
When debugging on a little-endian system (that is, everything except PowerPC-based Macintosh computers), you get confusing results if you specify the wrong unit size. Listing 16 shows an example of this. The second and third parameters of
CFStringCreateWithCharactersspecify an array of Unicode characters. Each element is aUniChar, which is a 16-bit number in native-endian format. As we're running on a little-endian system, you have to dump this array using the correct unit size, otherwise everything looks messed up.
Listing 16 Using the right unit size
$ gdb GNU gdb 6.3.50-20050815 (Apple version gdb-1346) […] (gdb) attach Finder Attaching to process 4732. Reading symbols for shared libraries . done Reading symbols for shared libraries […] 0x00007fff81963e3a in mach_msg_trap () (gdb) b *CFStringCreateWithCharacters Breakpoint 1 at 0x7fff86070520 (gdb) c Continuing. Breakpoint 1, 0x00007fff86070520 in CFStringCreateWithCharacters () (gdb) # The third parameter is the number of UniChars (gdb) # in the buffer pointed to by the first parameter. (gdb) p (int)$rdx $1 = 18 (gdb) # Dump the buffer as shorts. Everything makes sense. (gdb) # This is the string "Auto-Save Recovery". (gdb) x/18xh $rsi 0x10b7df292: 0x0041 0x0075 0x0074 0x006f 0x002d 0x0053 0x0061 0x0076 0x10b7df2a2: 0x0065 0x0020 0x0052 0x0065 0x0063 0x006f 0x0076 0x0065 0x10b7df2b2: 0x0072 0x0079 (gdb) # Now dump the buffer as words. Most confusing. (gdb) # It looks like "uAotS-va eeRocevyr"! (gdb) x/9xw $rsi 0x10b7df292: 0x00750041 0x006f0074 0x0053002d 0x00760061 0x10b7df2a2: 0x00200065 0x00650052 0x006f0063 0x00650076 0x10b7df2b2: 0x00790072 (gdb) # Now dump the buffer as bytes. This is a little less (gdb) # confusing, but you still have to remember that it's big (gdb) # endian data. (gdb) x/36xb $rsi 0x10b7df292: 0x41 0x00 0x75 0x00 0x74 0x00 0x6f 0x00 0x10b7df29a: 0x2d 0x00 0x53 0x00 0x61 0x00 0x76 0x00 0x10b7df2a2: 0x65 0x00 0x20 0x00 0x52 0x00 0x65 0x00 0x10b7df2aa: 0x63 0x00 0x6f 0x00 0x76 0x00 0x65 0x00 0x10b7df2b2: 0x72 0x00 0x79 0x00 |
Finally, be aware that many BSD-level routines have different variants depending on the OS that you're running on, the SDK used to link the program, and the MACOSX_DEPLOYMENT_TARGET build setting. This can get very confusing when debugging at the assembly level. For example, Listing 17 apparently shows curl downloading a URL without ever calling connect!
Listing 17 Download without connect
$ gdb -arch i386 /usr/bin/curl GNU gdb 6.3.50-20050815 (Apple version gdb-1346) […] (gdb) # Run it once, for reasons that are just too hard to explain. (gdb) r http://apple.com Starting program: /usr/bin/curl http://apple.com Reading symbols for shared libraries […] <head><body> This object may be found <a HREF="http://www.apple.com/">here</a> </body> Program exited normally. (gdb) # Set a breakpoint and run it again. (gdb) b *connect Breakpoint 1 at 0x94bb7583 (gdb) r Starting program: /usr/bin/curl http://apple.com <head><body> This object may be found <a HREF="http://www.apple.com/">here</a> </body> Program exited normally. (gdb) # Huh!?! We downloaded the web page without every calling connect! |
The reason for this is that curl was linked with the Mac OS X 10.6 SDK with a deployment target of 10.6 and later. Therefore it calls a decorated version of connect, connect$UNIX2003. To see curl call connect, you have a set a breakpoint on that decorated symbol, as shown in Listing 18.
Listing 18 Breaking on the decorated connect
$ gdb -arch i386 /usr/bin/curl GNU gdb 6.3.50-20050815 (Apple version gdb-1346) […] (gdb) # Run it once, for reasons that are just too hard to explain. (gdb) r http://apple.com Starting program: /usr/bin/curl http://apple.com Reading symbols for shared libraries […] <head><body> This object may be found <a HREF="http://www.apple.com/">here</a> </body> Program exited normally. (gdb) # Set the breakpoint on the decorated symbol. Note the user of (gdb) # single quotes to escape the dollar sign. (gdb) b *'connect$UNIX2003' Breakpoint 1 at 0x94b5636c (gdb) r Starting program: /usr/bin/curl http://apple.com Breakpoint 1, 0x94b5636c in connect$UNIX2003 () (gdb) # Much better. |
Controlled Crash
In some cases it's useful to crash your program in a controlled manner. One common way to do this is to call abort. Another option is to use the __builtin_trap intrinsic function, which generates a machine-specific trap instruction. Listing 19 shows how this is done.
Listing 19 Crashing via __builtin_trap
int main(int argc, char **argv) { __builtin_trap(); return 1; } |
If you run the program in the debugger, you will stop at the line immediately before the __builtin_trap call. Otherwise the program will crash and generate a crash report.
Instruments
Instruments is an application for dynamically tracing and profiling code. It runs on Mac OS X and allows you to target programs running on Mac OS X, iOS devices, and the iPhone Simulator.
While Instruments is primarily focused on performance debugging, you can also use it for debugging errors. For example, the ObjectAlloc instrument can help you track down both over- and under-release bugs.
One particularly nice feature of Instruments is that it gives you easy access to zombies. See the Instruments User Guide for details on this and other Instruments features.
CrashReporter
CrashReporter is an invaluable debugging facility that logs information about all programs that crash. It is enabled all the time; all you have to do is look at its output.
CrashReporter is described in detail in Technical Note TN2123, 'CrashReporter'.
BSD
The BSD subsystem implements process, memory, file, and network infrastructure, and thus is critical to all programs on the system. BSD implements a number of neat debugging facilities that you can take advantage of.
Memory Allocator
The default memory allocator includes a number of debugging facilities that you can enable via environment variables. These are fully documented in the manual page. Table 6 lists some of the more useful ones.
Variable | Summary |
|---|---|
MallocScribble | Fill allocated memory with 0xAA and scribble deallocated memory with 0x55 |
MallocGuardEdges | Add guard pages before and after large allocations |
MallocStackLogging | Record stack logs for each memory block to assist memory debugging tools |
MallocStackLoggingNoCompact | Record stack logs for all operations to assist memory debugging tools |
The default memory allocator also logs messages if it detects certain common programming problems. For example, if you free a block of memory twice, or free memory that you never allocated, free may print the message shown in Listing 20. The number inside parentheses is the process ID.
Listing 20 A common message printed by free
DummyPhone(1839) malloc: *** error for object 0x826600: double free *** set a breakpoint in malloc_error_break to debug |
You can debug this sort of problem by running your program within GDB and putting a breakpoint on malloc_error_break. Once you hit the breakpoint, you can use GDB's backtrace command to determine the immediate caller.
Finally, you can programmatically check the consistency of the heap using the malloc_zone_check routine (from <malloc.h>).
Standard C++ Library
The standard C++ library supports a number of debugging features:
Set the
_GLIBCXX_DEBUGcompile-time variable to enable debug mode in the standard C++ library.In versions prior to GCC 4.0, set the
GLIBCPP_FORCE_NEWenvironment variable to 1 to disable memory caching in the standard C++ library. This allows you to debug your C++ allocations with the other memory debugging tools.In GCC 4.0 and later this is the default behavior.
Dynamic Linker (dyld)
The dynamic linker (dyld) supports a number of debugging facilities that you can enable via environment variables. These are fully documented in the manual page. Table 7 lists some of the more useful variables.
Variable | Summary |
|---|---|
DYLD_IMAGE_SUFFIX | Search for libraries with this suffix first |
DYLD_PRINT_LIBRARIES | Log library loads |
DYLD_PRINT_LIBRARIES_POST_LAUNCH | As above, but only after main has run |
DYLD_PREBIND_DEBUG | Print prebinding diagnostics |
DYLD_PRINT_OPTS [1] | Print launch-time command line arguments |
DYLD_PRINT_ENV [1] | Print launch-time environment variables |
DYLD_IGNORE_PREBINDING [1] | Disable prebinding for performance testing |
DYLD_PRINT_APIS [1] | Log dyld API calls (for example, dlopen) |
DYLD_PRINT_BINDINGS [1] | Log symbol bindings |
DYLD_PRINT_INITIALIZERS [1] | Log image initialization calls |
DYLD_PRINT_SEGMENTS [1] | Log segment mapping |
DYLD_PRINT_STATISTICS [1] | Print launch performance statistics |
Notes:
Available on Mac OS X 10.4 and later.
On Mac OS X DYLD_IMAGE_SUFFIX is the most useful dyld environment variable because you can use it to enable the debug libraries, as described in Debug Libraries.
Finally, if you're loading code dynamically and the code fails to load, you can use the dynamic linker routine NSLinkEditError to get information about what went wrong error. NSLinkEditError works even if you're using a high-level API, like CFBundle, to load the code. Similarly, if you're loading code using dlopen, you can call dlerror to get information about load errors.
Core Dumps
Core dumps have an undeserved reputation as a primitive debugging facility. In reality they can be very helpful when debugging difficult problems, especially when you can't reproduce the problem locally.
You can enable core dumps on a system-wide basis by adding the line limit core unlimited to your /etc/launchd.conf file, creating it if necessary, and then restarting. For more information about this, see the launchd.conf man page.
Alternatively, if you run your program from Terminal, you can simply raise the core dump size limit in the shell beforehand. Listing 21 shows an example of this.
Listing 21 Unlimited core dump size
$ ulimit -c unlimited $ /Applications/TextEdit.app/Contents/MacOS/TextEdit […] |
Listing 22 Unlimited core dump size in a csh-compatible shell
% limit coredumpsize unlimited |
Core dumps are written to the directory /cores. On modern systems this directory is created by default. If it's not present on your system, you should create it with the commands shown in Listing 23.
Listing 23 Creating the /cores directory
$ sudo mkdir /cores $ sudo chown root:admin /cores $ sudo chmod 1775 /cores |
The /cores must be writable by the program that's dumping core. By default, it is only writable by root and by users in the admin group. If you need normal users to be able to dump a core, you can make the directory world writable with the command shown in Listing 24.
Listing 24 Creating the /cores directory
$ sudo chmod o+w /cores |
To test the core dump facility, send your program a SIGABRT signal using the killall command, as demonstrated by Listing 25.
Listing 25 Testing core dumps by sending a SIGABRT
$ killall -ABRT TextEdit |
Your application will then quit with a "Abort trap (core dumped)" message. You can find the core dump in /cores. You can work out which core dump is which using the otool command. Finally, you can debug the core dump using GDB with the -c argument. Listing 26 shows an example of this process.
Listing 26 Using core dumps
Abort trap (core dumped)
$ ls -lh /cores
total 924200
-r-------- 1 quinn  admin   451M Feb  1 14:25 core.180
$ otool -c /cores/core.180
/cores/core.180:
Argument strings on the stack at: 00007fff5fc00000
    /Applications/TextEdit.app/Contents/MacOS/TextEdit

    […]
    /Applications/TextEdit.app/Contents/MacOS/TextEdit
    TERM_PROGRAM=Apple_Terminal
    TERM=xterm-color
    SHELL=/bin/bash
    TMPDIR=/var/folders/3y/3yhwfA4XHhCpyl9B3eaPfk+++TM/-Tmp-/
    Apple_PubSub_Socket_Render=/tmp/launch-TvHq05/Render
    TERM_PROGRAM_VERSION=272
    USER=quinn
    COMMAND_MODE=unix2003
    SSH_AUTH_SOCK=/tmp/launch-xYN0cJ/Listeners
    __CF_USER_TEXT_ENCODING=0x1F6:0:0
    PATH=/usr/bin:/bin:/usr/sbin:/sbin:/usr/local/bin:/usr/X11/bin
    PWD=/Users/quinn
    LANG=en_US.UTF-8
    SHLVL=1
    HOME=/Users/quinn
    LOGNAME=quinn
    DISPLAY=/tmp/launch-NaLgZ1/:0
    _=/Applications/TextEdit.app/Contents/MacOS/TextEdit
$ gdb -c /cores/core.180
GNU gdb 6.3.50-20050815 (Apple version gdb-1344) […]
#0  0x00007fff8071fefa in mach_msg_trap ()
(gdb) bt
#0  0x00007fff8071fefa in mach_msg_trap ()
#1  0x00007fff8072056d in mach_msg ()
#2  0x00007fff83865ce2 in CFRunLoopRunSpecific ()
#3  0x00007fff8386503f in CFRunLoopRunSpecific ()
#4  0x00007fff80223c4e in BlockUntilNextEventMatchingListInMode ()
#5  0x00007fff80223a53 in BlockUntilNextEventMatchingListInMode ()
#6  0x00007fff8022390c in BlockUntilNextEventMatchingListInMode ()
#7  0x00007fff86466570 in _NSSafeOrderFront ()
#8  0x00007fff86465ed9 in _NSSafeOrderFront ()
#9  0x00007fff8642bb29 in _NSKitBundle ()
#10 0x00007fff86424844 in NSApplicationMain ()
#11 0x0000000100000fb8 in ?? () |
Enabling Core Dumps For Your Process
If you want to enable core dumps for your program programmatically, you can call setrlimit to change the value for RLIMIT_CORE. The system ships with a soft limit of zero but a hard limit of infinity. Thus, core dumps aren't generated by default, but you can enable them for your process by raising the soft limit, as shown in Listing 27.
Listing 27 Enabling core dumps programmatically
#include <sys/resource.h>

static bool EnableCoreDumps(void)
{
    struct rlimit   limit;

    limit.rlim_cur = RLIM_INFINITY;
    limit.rlim_max = RLIM_INFINITY;
    return setrlimit(RLIMIT_CORE, &limit) == 0;
} |
This does not, however, obviate the need for a writable /cores directory.
Generating a Core Dump From GDB
If you want at generate a core dump from within GDB, just turn GDB's unwindonsignal setting off and force GDB to call abort. Listing 28 shows an example of this.
Listing 28 Generating a core from within GDB
$ # Core dumps are enabled. $ ulimit -c unlimited $ # Look ma, no cores! $ ls -lh /cores $ gdb /Applications/TextEdit.app GNU gdb 6.3.50-20050815 (Apple version gdb-1344) […] (gdb) r Starting program: /Applications/TextEdit.app/Contents/MacOS/TextEdit Reading symbols for shared libraries […] ^C Program received signal SIGINT, Interrupt. 0x00007fff8071fefa in mach_msg_trap () (gdb) set unwindonsignal off (gdb) call (void)abort() Program received signal SIGABRT, Aborted. 0x00007fff8076e096 in __kill () The program being debugged was signaled while in a function called from GDB. GDB remains in the frame where the signal was received. To change this behavior use "set unwindonsignal on" Evaluation of the expression containing the function (abort) will be abandoned. (gdb) c Continuing. Program received signal SIGABRT, Aborted. 0x00007fff8076e096 in __kill () (gdb) c Continuing. Program terminated with signal SIGABRT, Aborted. The program no longer exists. (gdb) quit $ # And lo, we have a core. $ ls -l /cores $ ls -lh /cores total 925128 -r-------- 1 quinn admin 452M Feb 1 14:43 core.273 |
Enabling Core Dumps Retroactively
You can take a core dump even if you forgot to enable core dumps when you launched your process. The trick is to use GDB to enable core dumps programmatically. Listing 29 shows how to do this.
Listing 29 Using GDB to enable core dumps retroactively
$ gdb GNU gdb 6.3.50-20050815 (Apple version gdb-1344) […] (gdb) # Attach to the process. (gdb) attach TextEdit.300 Attaching to process 300. Reading symbols for shared libraries […] 0x00007fff8071fefa in mach_msg_trap () (gdb) # Allocate a buffer for a (struct limit). (gdb) set $limit=(long long *)malloc(16) (gdb) # Set both rlim_cur and rlim_max to RLIM_INFINITY. (gdb) set $limit[0]=0x7fffffffffffffff (gdb) set $limit[1]=0x7fffffffffffffff (gdb) # Call setrlimit. Note that 4 is RLIMIT_CORE. (gdb) call (int)setrlimit(4, $limit) $1 = 0 (gdb) # Detach from the process. (gdb) detach Detaching from process 300. (gdb) q $ # Nothing in /cores yet. $ ls -lh /cores $ # Tell TextEdit to dump core. $ killall -ABRT TextEdit $ # And lo, we have a core. $ ls -lh /cores total 925144 -r-------- 1 quinn admin 452M Feb 1 14:57 core.300 |
Generating a Core Dump of a Running Process
There are times when it's handy to generate a core dump of a running process without killing it. On other UNIX-based platforms you can do this with the gcore utility. Mac OS X does not currently have this utility built-in
(r. 3909440)
. However, there is a third party version that you might find helpful.
Core Dumps Prior to Mac OS X 10.5
Prior to Mac OS X 10.5 the backtrace you get from a core dump (as shown in Listing 26) contained no symbolic information. However, if you have a symbol file handy, you can tell GDB to consult it using the add-symbol-file command. Listing 30 shows how to do this for the system frameworks used by a TextEdit backtrace.
Listing 30 Adding symbols
(gdb) # on 10.4.x the backtrace has no symbols (gdb) bt #0 0x900075c8 in ?? () #1 0x90007118 in ?? () #2 0x901960bc in ?? () #3 0x927d5ecc in ?? () #4 0x927dc640 in ?? () #5 0x927fe6d0 in ?? () #6 0x92dd2a80 in ?? () #7 0x92de93fc in ?? () #8 0x92dfd730 in ?? () #9 0x92eb9a1c in ?? () #10 0x00007d98 in ?? () #11 0x00007c0c in ?? () (gdb) # add symbols from a bunch of frameworks (gdb) add-symbol-file /System/Library/Frameworks/AppKit.framework/AppKit […] (gdb) add-symbol-file /System/Library/Frameworks/CoreFoundation.framework\ /CoreFoundation […] (gdb) add-symbol-file /System/Library/Frameworks/System.framework/System […] #12 0x00007c0c in ?? () (gdb) add-symbol-file /System/Library/Frameworks/Carbon.framework/\ Frameworks/HIToolbox.framework/HIToolbox […] (gdb) # and lo, symbols! (gdb) bt #0 0x900075c8 in mach_msg_trap () #1 0x90007118 in mach_msg () #2 0x90191930 in __CFRunLoopRun () #3 0x901960bc in CFRunLoopRunSpecific () #4 0x927d5ecc in RunCurrentEventLoopInMode () #5 0x927dc640 in ReceiveNextEventCommon () #6 0x927fe6d0 in BlockUntilNextEventMatchingListInMode () #7 0x92dd2a80 in _DPSNextEvent () #8 0x92de93fc in -[NSApplication nextEventMatchingMask:untilDate:inMode:… #9 0x92dfd730 in -[NSApplication run] () #10 0x92eb9a1c in NSApplicationMain () #11 0x00007d98 in ?? () #12 0x00007c0c in ?? () |
This technique assumes that you're looking at the core file on the machine that create it, immediately after creating it. If the core file was created on a different machine, even an identical machine with the same system software installed, or if the system software has been updated since the core file was created, you will get inaccurate results.
Also, prior to Mac OS X 10.5, GDB had a bug in its handling of core files such that you couldn't look at a PowerPC core file on an Intel-based computer, or vice versa (r. 4280384) . In addition, GDB had a bug that prevents you from debugging Intel core files properly (r. 4677738) .
The aforementioned restrictions make core dumps much less useful on pre-10.5 systems. However, they can still be helpful. Keep in mind that, if your program crashes infrequently at a specific customer's site, a core dump may be the only way to discover the state of your program at the time of the crash.
MallocDebug and ObjectAlloc
Mac OS X includes two GUI applications for memory allocation debugging, MallocDebug and ObjectAlloc. For more information about these tools, see the Memory Usage Performance Guidelines document.
Guarded Memory Allocator
Mac OS X includes a guarded memory allocator, libgmalloc, that you can use during debugging to catch common memory problems, such as buffer overruns and use-after-free. The easiest way to enable the guarded memory allocator is by checking Enable Guard Malloc in the Run menu in Xcode.
Alternatively, if you're running the program directly from GDB, you can enable it as shown in Listing 31.
Listing 31 Enabling libgmalloc
$ gdb /Applications/TextEdit.app GNU gdb 6.3.50-20050815 (Apple version gdb-1344) […] (gdb) set env DYLD_INSERT_LIBRARIES /usr/lib/libgmalloc.dylib (gdb) r Starting program: /Applications/TextEdit.app/Contents/MacOS/TextEdit GuardMalloc: Allocations will be placed on 16 byte boundaries. GuardMalloc: - Some buffer overruns may not be noticed. GuardMalloc: - Applications using vector instructions (e.g., SSE or Altivec) should work. GuardMalloc: GuardMalloc version 18 […] |
You can learn more about libgmalloc from its man page.
For information about how using libgmalloc on Mac OS X 10.3.x, see the libgmalloc man page on that system.
Command Line Tools
Mac OS X includes a number of cool command line tools for debugging. Table 8 lists some of the best.
Tool | Documentation | Summary |
|---|---|---|
gdb | manual page, Debugging with GDB | Command line debugger |
dtrace | manual page | Dynamic, comprehensive and sophisticated tracing; see DTrace for more information [1] |
fs_usage | manual page | File system trace tool |
sc_usage | manual page | System call trace tool |
plockstat | manual page | pthread mutex and read/write lock statistics |
latency | manual page | Scheduling latency debugging tool |
heap | manual page | Heap dump |
vmmap | manual page | Address space dump |
malloc_history | manual page | Memory allocation history |
leaks | manual page | Leak detection |
tcpdump | manual page, Technical Q&A QA1176, 'Getting a Packet Trace' | Network packet trace |
netstat | manual page | Network statistics; netstat -an shows all network connections |
lsof | manual page | List open files |
fuser | manual page | Show processes with file open |
PPCExplain |
| PPC mnemonics explained |
ktrace, kdump | manual page | Kernel tracing [2] |
otool | manual page | Displays object file |
nm | manual page | Displays symbol table in object file |
class-dump |
| Displays Objective-C runtime information in object file |
dyldinfo | manual page | Displays dyld information in object file [3] |
Notes:
Available in Mac OS X 10.5 and later.
ktraceandkdumpare not available in Mac OS X 10.5 and later; usedtraceordtrussinstead.Available in Mac OS X 10.6 and later.
Debug Libraries
Many Mac OS X frameworks include both a production and a debug variant. The debug variant has the suffix "_debug". For example, the Core Foundation framework's production variant is /System/Library/Frameworks/CoreFoundation.framework/Versions/A/CoreFoundation while its debug variant is /System/Library/Frameworks/CoreFoundation.framework/Versions/A/CoreFoundation_debug. You can force dyld to load the debug variant of a library (if such a variant exists) by setting the DYLD_IMAGE_SUFFIX environment variable to "_debug". Listing 32 shows an example of how to do this from within Terminal.
Listing 32 Using _debug libraries
$ DYLD_IMAGE_SUFFIX=_debug /Applications/TextEdit.app/Contents/MacOS/TextEdit 2010-01-29 18:25:29.780 TextEdit[960:10b] Assertions enabled […] |
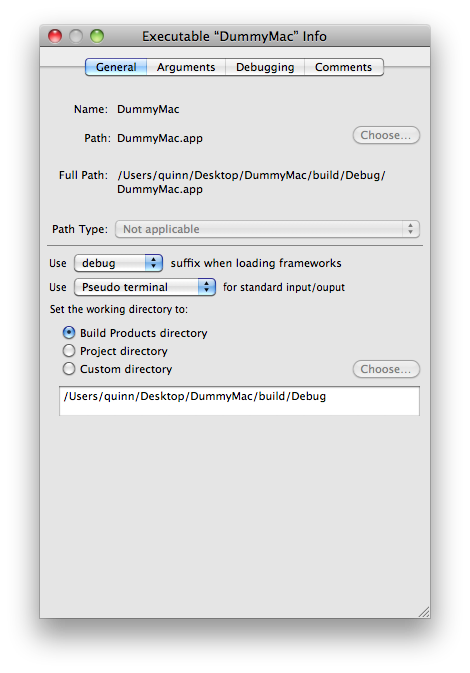
If Terminal doesn't float your boat, you can do the same using the executable inspector in Xcode. In Figure 3, you can see that the "Use … suffix when loading frameworks" popup has been set to "debug".
The exact behavior of the debug library varies from framework to framework. Most debug libraries include:
full debug symbols — This is particularly useful if the source for the framework is included in Darwin.
extra assertions — These can help pinpoint programming errors on your part.
extra debugging facilities — A number of the debugging facilities described later in this document are only available in the debug library.
Enabling Just One Debug Library
In some circumstances you might want to enable just one debug library. For example, let's say you're debugging an Apple event problem, so you want to enabled the "_debug" variant of the AE framework. However, when you set DYLD_IMAGE_SUFFIX to "_debug", you discover that using all the debug libraries causes a problem elsewhere in your application. At this time you just want to focus on debugging the Apple event problem. What do you do?
Fortunately there's a simple solution to this conundrum: just make a copy of the debug variant with a new unique suffix, and activate that suffix via DYLD_IMAGE_SUFFIX. Listing 33 shows an example of this.
Listing 33 Activating just the AE debug library
$ cd /System/Library/Frameworks/CoreServices.framework/Frameworks/AE.framework/Versions/A/
$ sudo cp AE_debug AE_qtest
$ # Now test this by running TextEdit from GDB.
$ gdb /Applications/TextEdit.app
GNU gdb 6.3.50-20050815 (Apple version gdb-768) […]
(gdb) set env DYLD_IMAGE_SUFFIX _qtest
(gdb) r
Starting program: /Applications/TextEdit.app/Contents/MacOS/TextEdit
Reading symbols for shared libraries […]
^C
Program received signal SIGINT, Interrupt.
0x93cdb8e6 in mach_msg_trap ()
(gdb) # The info shared command reveals that the AE_qtest variant
(gdb) # was loaded. Neato!
(gdb) info shared
The DYLD shared library state has been initialized from the executable's […]
                                          Requested State Current State
Num Basename                Type Address         Reason | | Source
  | |                          | |                    | | | |
[…]
 43 AE_qtest                   F 0x54000           dyld Y Y /System/Libra[…]
[…] |
Debug Library Versioning
To get meaningful results you must use the debug libraries that correspond to your production libraries. If you use the wrong version of the debug libraries, you can run into all sorts of weird problems. For example, if you install the debug libraries on Mac OS X 10.4 and then update your system to Mac OS X 10.4.3, the debug libraries will no longer work. This is because, in Mac OS X 10.4.3, Apple added a new routine to the CoreServices framework, and updated the DesktopServicesPriv framework to use that routine. However, one of these frameworks (CoreServices) has a debug variant and the other (DesktopServicesPriv) does not. Thus, if you enable debug libraries, you get the debug variant of CoreServices from Mac OS X 10.4 and the production variant of DesktopServicesPriv from Mac OS X 10.4.3, and this combination fails to load.
Installing Debug Libraries
For Mac OS X 10.5 and later, you can download the debug libraries for any given OS release from the ADC member site. Look in the Developer Tools section of the Downloads area for a "Debug and Profile Libraries" package that matches your OS version.
Prior to Mac OS X 10.5, the situation is very different. The debug libraries are installed by the Xcode installer, not by the system installer. The debug libraries are not updated when you update your system software. They are, however, updated when you update Xcode. This makes it tricky to keep your debug and production libraries in sync.
The most reliable way to use debug libraries on systems prior to Mac OS X 10.5 is to set up a dedicated debug partition. On this partition you should first clean install the desired major OS release, and then install the developer tools associated with that release. For example, clean install Mac OS X 10.4, and then install Xcode 2.0. Also remember to disable software updates for that partition, and not update Xcode. This ensures that your production and debug libraries start out in sync, and stay in synch.
Profile Libraries
Many libraries also support a profiling variant which has the suffix "_profile". The profile libraries have many of the same limitations as the debug libraries.
Escaping the Window Server
Under some circumstances it can be helpful to operate without the window server. For example, if you need to modify the parameters to loginwindow specified in /etc/ttys, it's nice to be able to do it while loginwindow is not running. Mac OS X provides a convenient way to do this:
In the Accounts panel of System Preferences, click on Login Options. If the text is greyed out, you must first unlock the panel by clicking the lock icon.
Change the "Display login window as" setting to "Name and password".
Log out.
At the login window, enter ">console" as your user name and click the Log In button;
loginwindowwill quit and you'll be faced with a glass TTY interface displaying the "Login" prompt (you may need to press Return to cause the prompt to be displayed).Log in using your standard user name and password.
When you're done working at this level, just exit from your shell (using the exit command) and you will return to the standard login window.
DTrace
DTrace is a comprehensive dynamic tracing facility introduced with Mac OS X 10.5. DTrace was originally developed by Sun Microsystems (now Oracle) for their Solaris operation system, but has been integrated into Mac OS X by Apple. While a full explanation of DTrace is beyond the scope of this document, this section covers some of the highlights.
The most important thing to realise is that DTrace is not just for performance debugging. While it was originally designed to support performance debugging, and it is very strong in that area, it can also be used for other types of debugging. For example, sometimes it's useful to know what processes are opening what files, and DTrace can tell you that easily.
DTrace is also the foundation of many debugging tools on Mac OS X, including:
dtruss — This makes it easy to see what system calls being made by a process.
Instruments — Many of the built-in instruments are actually implemented in terms of DTrace.
numerous other tools — See DTrace-based Tools for a list of tools based on DTrace.
A good place to start with DTrace is the Oracle BigAdmin page for DTrace. Alternatively, there are many DTrace scripts built in to Mac OS X (some are described in the next section), and you can just look at the source for those scripts. Finally, instruments has a nice UI for building custom Instruments based on a DTrace script.
Take the time to learn DTrace; it will pay off in the long run!
DTrace-based Tools
The following tables list some of the DTrace-based tools built in to Mac OS X. Keep in mind that, while these scripts might not do exactly what you want, you can copy a script's source and tweak it to better suit your needs.
Tool | Documentation | Summary |
|---|---|---|
execsnoop | manual page | Traces process execution |
newproc.d | manual page | Shows new processes as they are created |
pidpersec.d | manual page | Shows process create count per second |
setuids.d | manual page | Shows setuid changes as they happen |
Tool | Documentation | Summary |
|---|---|---|
dtruss | manual page | Traces process system calls |
errinfo | manual page | Traces system call failures |
lastwords | manual page | Shows the last system calls made by a process |
procsystime | manual page | Shows system call execution times |
syscallbypid.d | manual page | Shows system calls by process ID |
syscallbyproc.d | manual page | Shows system calls by process name |
syscallbysysc.d | manual page | Shows system call counts |
topsyscall | manual page | Each second, shows the most common system calls |
topsysproc | manual page | Each second, shows the processes making the most system calls |
Tool | Documentation | Summary |
|---|---|---|
kill.d | manual page | Shows signals as they are sent |
sigdist.d | manual page | Shows signals by process |
Tool | Documentation | Summary |
|---|---|---|
creatbyproc.d | manual page | Shows files created with creat |
fddist | manual page | Shows file descriptor usage distribution |
filebyproc.d | manual page | Traces files opened by a process |
opensnoop | manual page | Shows files being opened |
pathopens.d | manual page | Shows open counts by path |
rwbypid.d | manual page | Shows read and write calls by process |
rwbytype.d | manual page | Shows read and write calls by vnode type |
rwsnoop | manual page | Shows read and write calls as they happen |
Tool | Documentation | Summary |
|---|---|---|
httpdstat.d | manual page | Shows Apache connection statistics |
weblatency.d | manual page | Shows HTTP request latency statistics |
Tool | Documentation | Summary |
|---|---|---|
bitesize.d | manual page | Shows disk I/O size by process |
diskhits | manual page | Shows file access by offset |
hotspot.d | manual page | Shows disk usage by location |
iofile.d | manual page | Shows I/O wait times by file |
iofileb.d | manual page | Shows transfer sizes by file |
iopattern | manual page | Shows disk access patterns |
iopending | manual page | Shows number of pending disk transfers |
iosnoop | manual page | Shows disk accesses as they happen |
iotop | manual page | Shows disk I/O per process |
seeksize.d | manual page | Shows disk seeks by process |
Tool | Documentation | Summary |
|---|---|---|
cpuwalk.d | manual page | Shows which CPUs a process runs on |
dappprof | manual page | Profiles user space code |
dapptrace | manual page | Traces user space code |
dispqlen.d | manual page | Shows scheduler dispatch queue lengths |
loads.d | manual page | Show load averages |
priclass.d | manual page | Shows process class distribution |
pridist.d | manual page | Shows process priority distribution |
runocc.d | manual page | Shows scheduler run queue occupancy by CPU |
sampleproc | manual page | Profiles which process is on which CPU |
Daemons
Most system daemons include some sort of debugging facility. In many cases a daemon's debugging features are described in its man page. This section describes some of the particularly interesting ones.
launchd
launchd is the first process run by the kernel (Mac OS X 10.4 and later); it is responsible for launching all other processes on the system. launchd has a number of useful debugging facilities, each described in a subsequent section.
launchctl
You can interact with launchd using the launchctl command. launchctl supports a number of sub-commands; Table 16 lists the ones that are most relevant to debugging.
Command | Summary |
|---|---|
list | Displays a list of loaded jobs, or detailed information about a specific job |
limit | Sets the resource limits of launchd; this value will be inherited by any process launchd executes; the most common usage is limit core unlimited, which enables core dumps |
setenv | Modifies the environment variables passed to any launched programs |
debug | Lets you control the WaitForDebugger property of a loaded job (Mac OS X 10.6 and later) |
bstree | Displays a tree of the Mach bootstrap namespaces being managed by launchd (Mac OS X 10.6 and later) |
For commands that change the launchd state (like limit or setenv), you can make a temporary change by running launchctl with one of these commands as an argument. This will affect launchd itself, and any process that launchd executes from then on.
You can make a persistent change to the global instance of launchd by adding the command to /etc/launchd.conf. launchd adopts these settings early in the boot process, and so, upon restart, they affect every process on the system.
Debugging a Particular Job
Finally, launchd lets you debug a specific job by modifying properties in its property list file. Table 17 lists the properties that are most useful for debugging.
Property | Summary |
|---|---|
StandardOutPath | Sets the job's stdout destination |
StandardErrorPath | Sets the job's stderr destination |
EnvironmentVariables | Sets environment variables for the job |
SoftResourceLimits, HardResourceLimits | Sets resource limits for the job; most useful to enable core dumps for just one job |
WaitForDebugger | If this is true, the job's process will wait for the debugger to attach before running any code (Mac OS X 10.5 and later) |
Directory Services
The DirectoryService daemon is the central repository of directory information on Mac OS X (things like the list of users and groups). The man page describes how you can use the SIGUSR1 and SIGUSR2 signals to enable two different flavours of logging. If you need to enable logging early in the boot process, you can create the /Library/Preferences/DirectoryService/.DSLogAtStart file before you restart. Finally, starting with Mac OS X 10.5, you can change the amount of debug logging using the Debug Logging Priority Level preference, as described in Mac OS X Server v10.5, 10.6: Enabling Directory Service debug logging.
mDNSResponder
The mDNSResponder daemon is responsible for multicast DNS services on all versions of Mac OS X and, starting with Mac OS X 10.5, it also handles unicast DNS as well. The daemon maintains a lot of internal state, including a DNS resolver cache. If you send it a SIGINFO signal, it will dump that state to the system log.
notifyd
If you send a SIGUSR1 signal to notifyd, it will dump its state to /var/run/notifyd_XXX.status, where XXX is its process ID. You can also send a SIGUSR2 signal to get a longer status report.
lookupd
If you're experiencing problems with lookupd (for example, DNS requests are taking a long time), you can enable lookupd debugging with the following steps:
Create the
DebugandTraceproperties in the local machine's/config/lookupdNetInfo directory.Change the syslog configuration so that NetInfo debugging information (
netinfo.debug) is sent to the NetInfo log file (/var/log/netinfo.log).Send a
SIGHUPsignal tosyslogdto get it to recognize the previous change.Send a
SIGHUPsignal tolookupdto get it to recognize the change from step 1.
Listing 34 shows an example of this. Once you've done these steps, you can look in /var/log/netinfo.log for the debugging output. You can also execute lookupd -statistics get statistics from lookupd.
Listing 34 Enabling lookupd debugging
$ sudo dscl . create /dsRecTypeStandard:Config/lookupd Debug YES $ sudo dscl . create /dsRecTypeStandard:Config/lookupd Trace YES $ sudo cp /etc/syslog.conf /etc/syslog.conf-orig $ sed 's/netinfo.err/netinfo.debug/' /etc/syslog.conf-orig | \ sudo cp /dev/stdin /etc/syslog.conf $ sudo kill -HUP `cat /var/run/syslog.pid` $ sudo kill -HUP `cat /var/run/lookupd.pid` |
Listing 35 shows how to undo these changes.
Listing 35 Disabling lookupd debugging
$ sudo dscl . delete /dsRecTypeStandard:Config/lookupd $ sudo mv /etc/syslog.conf-orig /etc/syslog.conf $ sudo kill -HUP `cat /var/run/syslog.pid` $ sudo kill -HUP `cat /var/run/lookupd.pid` |
For more information about lookupd, see its man page.
Printing (CUPS)
Mac OS X uses CUPS as its core printing architecture (starting with Mac OS X 10.2). CUPS has a built-in debug logging feature, controlled by the CUPS configuration file (/etc/cups/cupsd.conf). Within this file the LogLevel directive controls the level of logging, while the ErrorLog directive controls the log destination (the default is /var/log/cups/error_log). For more information about this file, see the man page.
Listing 36 Restarting the CUPS daemon
$ # Prior to Mac OS X 10.5, use this command: $ $ sudo /System/Library/StartupItems/PrintingServices/PrintingServices \ restart $ $ # In Mac OS X 10.5 and later, use this command: $ $ sudo launchctl stop org.cups.cupsd |
Starting with Mac OS X 10.5, you can use the cupsctl tool to control debug logging, as shown in Listing 37.
Listing 37 Enabling and disabling CUPS debug logging
$ # Enable CUPS debug logging. $ cupsctl --debug-logging $ # Disable CUPS debug logging. $ cupsctl --no-debug-logging |
You can get general CUPS help from the built-in Online Help. Also, the Filter and Backend Programming document has a bunch of useful debugging information.
If you're writing a CUPS driver or filter, you can add entries to this log by printing them to stderr. You must start each line with the logging level of the message, as illustrated by Listing 38.
Listing 38 Logging to CUPS
// Debug message fprintf(stderr, "DEBUG: page_width = %.0f\n", page_width); // Warning message fprintf(stderr, "WARNING: Printer not responding\n"); // Error message fprintf(stderr, "ERROR: Lost connection with printer\n"); |
Core Services
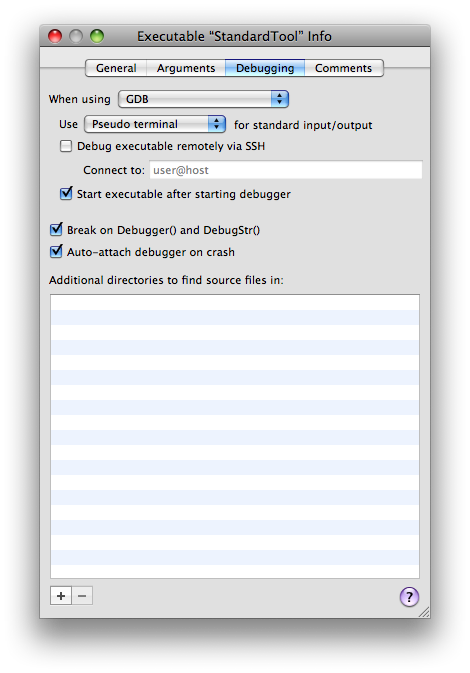
Core Services includes a number of routines (for example, Debugger, DebugStr, and SysBreak) that enter the debugger with a message. If you set the USERBREAK environment variable to 1, these routines will send a SIGINT signal to the current process, which causes you to break into GDB. Xcode has GUI to enabled this facility (the "Break on Debugger() and DebugStr()" checkbox in the Debugging panel of the executable inspector, as shown in Figure 4).
Core Foundation
The Core Foundation (CF) framework exports the CFShow routine, which prints a description of any CF object to stderr. You can make this call from your own code, however, it's particularly useful when called from GDB. Listing 39 shows an example of this.
Listing 39 Calling CFShow from GDB
$ gdb /Applications/TextEdit.app
GNU gdb 6.3.50-20050815 (Apple version gdb-1346) […]
(gdb) fb CFRunLoopAddSource
Breakpoint 1 at 0x624dd2f195cfa8
(gdb) r
Starting program: /Applications/TextEdit.app/Contents/MacOS/TextEdit
Reading symbols for shared libraries […]
Breakpoint 1, 0x00007fff8609bfa8 in CFRunLoopAddSource ()
(gdb) # Check that the prologue hasn't changed $rdi.
(gdb) p/a 0x00007fff8609bfa8
$1 = 0x7fff8609bfa8 <CFRunLoopAddSource+24>
(gdb) p/a $pc
$2 = 0x7fff8609bfa8 <CFRunLoopAddSource+24>
(gdb) x/8i $pc-24
0x7fff8609bf90 <CFRunLoopAddSource>: push   %rbp
0x7fff8609bf91 <CFRunLoopAddSource+1>: mov    %rsp,%rbp
0x7fff8609bf94 <CFRunLoopAddSource+4>: mov    %rbx,-0x20(%rbp)
0x7fff8609bf98 <CFRunLoopAddSource+8>: mov    %r12,-0x18(%rbp)
0x7fff8609bf9c <CFRunLoopAddSource+12>: mov    %r13,-0x10(%rbp)
0x7fff8609bfa0 <CFRunLoopAddSource+16>: mov    %r14,-0x8(%rbp)
0x7fff8609bfa4 <CFRunLoopAddSource+20>: sub    $0x40,%rsp
0x7fff8609bfa8 <CFRunLoopAddSource+24>: mov    %rdi,%r12
(gdb) # Nope. Go ahead and CFShow it.
(gdb) call (void)CFShow($rdi)
<CFRunLoop 0x100115540 [0x7fff70b8bf20]>{
    locked = false,
    wakeup port = 0x1e07,
    stopped = false,
    current mode = (none),
    common modes = <CFBasicHash 0x1001155a0 [0x7fff70b8bf20]>{
        type = mutable set,
        count = 1,
        entries =>
            2 : <CFString 0x7fff70b693d0 [0x7fff70b8bf20]>{
                contents = "kCFRunLoopDefaultMode"
            }
    },
    common mode items = (null),
    modes = <CFBasicHash 0x1001155d0 [0x7fff70b8bf20]>{
        type = mutable set,
        count = 1,
        entries =>
            0 : <CFRunLoopMode 0x100115670 [0x7fff70b8bf20]>{
                name = kCFRunLoopDefaultMode,
                locked = false,
                port set = 0x1f03,
                sources = (null),
                observers = (null),
                timers = (null)
        },
    }
} |
There are a number of other CF routines that you might find useful to call from GDB, including CFGetRetainCount, CFBundleGetMainBundle, and CFRunLoopGetCurrent.
The Core Foundation framework also has a debug variant that offers extensive debugging assistance. For example, the non-debug variant of Core Foundation does not check the validity of parameters that you pass to its routines, whereas the debug variant includes full parameter checking. This can help you track down numerous Core Foundation-related bugs in your code.
Zombies!
Core Foundation supports an environment variable called CFZombieLevel. It interprets this variable as an integer containing a set of flag bits. Table 18 describes the bits that are currently defined. These can help you track down various CF memory management issues.
Bit | Action |
|---|---|
0 | scribble deallocated CF memory |
1 | when scribbling deallocated CF memory, don't scribble object header (CFRuntimeBase) |
4 | never free memory used to hold CF objects |
7 | if set, scribble deallocations using bits 8..15, otherwise use 0xFC |
8..15 | if bit 7 is set, scribble deallocations using this value |
16 | scribble allocated CF memory |
23 | if set, scribble allocations using bits 24..31, otherwise use 0xCF |
24..31 | if bit 23 is set, scribble allocations using this value |
CFNotificationCenter
You can enable CFNotificationCenter logging by creating the file /var/log/do_dnserver_log. If this file exists and is owned by root, the CFNotificationCenter daemon (distnoted) will log its activity to the system log. See Files for an example of how to create this file.
In Mac OS X 10.5.x, the CFNotificationCenter daemon process (distnoted) runs as the user daemon, which means that the file /var/log/dnserver.log must be writable by that user. Listing 40 shows how to create this file.
Listing 40 Creating the CFNotificationCenter log file for Mac OS X 10.5
$ sudo touch /var/log/dnserver.log $ sudo chown daemon:daemon /var/log/dnserver.log |
Prior to Mac OS X 10.5 distnoted ran as root, so the ownership and permissions of the /var/log/dnserver.log file were irrelevant.
On Mac OS X 10.3.x, the corresponding files were /var/tmp/do_dnserver_log and /var/tmp/dnserver.log.
Also, Mac OS X 10.3.x supported client-side logging. If you create the file /var/tmp/do_xnc_log, CFNotificationCenter will log each client's activity in its own file (/var/tmp/xnc_logs/<progname>). This setting takes effect when you relaunch the program. Client-side logging is not available in Mac OS X 10.4 and later.
Apple Events
The Apple Event Manager has extensive built-in debugging support. The best way to learn about this support is use GDB to call the GDBPrintHelpDebuggingAppleEvents routine, as shown in Listing 41.
Listing 41 Apple Event Manager debugging help
(gdb) call (void)GDBPrintHelpDebuggingAppleEvents() The AppleEvent Manager has been completely rewritten for this version of Mac OS X. The internal structure of an AEDesc is now a pointer to a sparse tree. If you're having problems it could be because you're accessing the dataHandle of an AEDesc directly. Also of note is that AEGetDescData and AEGetDescDataSize only work with value descriptors created by AECreateDesc - you cannot get the data size of an AERecord or AEList, for example. To print the contents of an AppleEvent from GDB, you can: (gdb) call (void) GDBPrintAEDesc(descPtr) To view all currently installed AppleEvent coercion handlers: (gdb) call (void) GDBPrintAECoercionTables() To view all contents install AppleEvent handlers: (gdb) call (void) GDBPrintAEHandlerTables() Additionally, to log information about AppleEvent manager calls, you can set environment variables that will produce debugging output to the console: % setenv AEDebugSends 1 # print sent events % setenv AEDebugReceives 1 # print received events and replies |
Some environment variables—specifically AEDebug, AEDebugVerbose, AEDebugOSL, AEDebugFlattenedEvents, and AEDebugFile—are only supported by the debug library.
If you are using the debug library, you can also control Apple event debugging by creating three files in /var/tmp:
Creating the file
/var/tmp/AEDebugFullis equivalent to setting theAEDebug,AEDebugSends,AEDebugReceives,AEDebugVerbose,AEDebugOSL, andAEDebugFlattenedEventsenvironment variables.Creating the file
/var/tmp/AEDebug.outis equivalent to settingAEDebugFileto "/var/tmp/AEDebug.out".Creating the file
/var/tmp/AEDebugLogscauses Apple Event Manager to send all of its output to a file named/var/tmp/AELog-<progname>.
If you set the AE_PRINT_XML environment variable to 1 (10.4 and later), GDBPrintAEDesc will print the descriptor as XML (if possible).
Remote Apple Events
If you're having problems with remote Apple events, you may find it useful to enable logging for the Apple event server process. To do this, edit /System/Library/LaunchDaemons/com.apple.eppc.plist and add a "--debug" entry to the ProgramArguments array. The end result should be a file like the one shown in Listing 42.
Listing 42 Enabling remote Apple event debugging
<?xml version="1.0" encoding="UTF-8"?>
<!DOCTYPE plist PUBLIC "-//Apple Computer//DTD PLIST 1.0//EN" "http://www.apple.com/DTDs/PropertyList-1.0.dtd">
<plist version="1.0">
<dict>
        <key>Label</key>
        <string>com.apple.AEServer</string>
        <key>ProgramArguments</key>
        <array>
                <string>/System/Library/Frameworks/CoreServices.framework/Frameworks/AE.framework/Versions/A/Support/AEServer</string>
                <string>--debug</string>
        </array>
        […]
</dict>
</plist> |
You must stop and start the Remote Apple Events service for this change to take effect; you can do this in the Sharing panel of System Preferences. The logging information will appear in the system log.
Code Fragment Manager (CFM)
The CFM compatibility environment on Mac OS X supports two helpful environment variables, CFMDebugBasic and CFMDebugFull, which you can set to 1 to get limited and verbose debug logging, respectively. This facility is particularly useful for tracking down CFM closure problems, and problems where fragment initialization routines fail.
Component Manager
Component Manager exports a routine, GDBComponentList, that you can call from GDB to print the database of registered components and their instances. Listing 43 gives an example of its use.
Listing 43 Print a list of components and instances
(gdb) call (void)GDBComponentList()
Cnt   tRef# (address) Type/SubT/Manu    Flags           EntryPnt File …
[…]
  1 0x10011 0x00000001008870a0 osa /ascr/appl 100001fe 0x00000001004efeb6    0 …
    Inst:0x810001; Err=0; Storage:0x85f9f0
  1 0x10013 0x00000001008871e0 osa /scpt/appl 100001fe 0x00000001004efea2    0 …
    Inst:0x810000; Err=0; Storage:0x2384c0
[…]
There are 1 component manager files:
0: refs 2, path [/System/Library/Components/AppleScript.component], where k… |
In addition, if you set the ComponentDebug environment variable to 1, Component Manager will print of variety of debug messages. These may be helpful if something is going wrong with your component, in particular if it fails to load.
Finally, if a component fails to load, you can use dynamic linker facilities to debug the problem; see Dynamic Linker (dyld) for the details.
File Manager
Core Services File Manager (commonly known as the Carbon File Manager, or just File Manager) is nicely integrated with the fs_usage command line tool. If you enable the Core Services debug library, fs_usage will not only show primitive BSD file system calls but also the File Manager calls that prompted them. See the fs_usage man page for more details.
Prior to Mac OS X 10.5, if you set the FilesASDDebug environment variable to 1, File Manager will log its dealings with AppleDouble files on file systems that do not have native support for resource forks and Macintosh metadata. In Mac OS X 10.5 and later this feature is no longer supported because AppleDouble support has moved into kernel.
Prior to Mac OS X 10.6, and when using the debug variant of the CarbonCore framework, if you set the VNDebug environment variable to 1, File Manager will log its interaction with Disk Arbitration.
File Manager has a number of useful GDB-callable routines. The most useful, PrintVolumeInfo, prints the volume list. It takes one Boolean parameter that is ignored by modern systems. Listing 44 shows an example this.
Listing 44 PrintVolumeInfo in action
(gdb) call (void)PrintVolumeInfo(1) 2010-02-01 17:48:00.657 Finder[620:a0f] 1:vol=-100 "Macintosh HD" 2010-02-01 17:48:00.658 Finder[620:a0f] 2:returned error -35 |
There are a number of other GDB-callable routines that are primarily of interest to folks developing VFS plug-ins on Mac OS X. They allow you to print the directory enumeration cache and the file ID tree, both of which are compatibility structures maintained by the File Manager for non-volfs volumes (see Technical Q&A QA1113, 'The "/.vol" directory and "volfs"' for information about volfs).
The PrintEnumerationCache routine prints the directory enumeration cache on the volume. It takes a single parameter, which is the volume reference number (vRefNum) of the volume of interest.
The file ID tree is maintained centrally by coreservicesd. There are two different ways to look at this tree:
The
FileIDTreePrintVolumeTreeroutine prints the file ID tree hierarchy. It takes a single parameter that specifies the volume reference number.The
FileIDTreeStorageServerDumproutine prints various bits of cryptic information, the most useful of which is the list of ongoing file ID tree transactions.
Listing 45 shows how an example of accessing this information on Mac OS X 10.5 and later.
Listing 45 Print the file ID tree
Virtual-Victim:~ quinn$ sudo gdb
GNU gdb 6.3.50-20050815 (Apple version gdb-1344) […]
(gdb) attach coreservicesd
[…]
(gdb) call (void)PrintVolumeInfo(0)
(gdb) # The volume reference number in the next command (-104)
(gdb) # comes from the output of the previous command (see below).
(gdb) call (int)FileIDTreePrintVolumeIDs(-104)
$1 = 0
(gdb) call (void)CFShow((void*) FileIDTreeStorageServerDump("fsnode_all") ) |
To see the output of these commands, you have to display /var/log/system.log in a separate window, as shown in Listing 46.
Listing 46 File ID tree output
$ tail -f /var/log/system.log […] 1:vol=-100 "Macintosh HD" […] 2:vol=-104 "UNTITLED" […] 3:returned error -35 […] […] volume -104 flags: <dev_id:234881028, statFSFlags:2101272, devCheckTime:0> […] Index Entry: a0000025 […] . Index Entry: a0000024 […] . . . 2000001e: 1 at […] . . . 5a: 2 at UNTITLED […] . Index Entry: a0000026 […] . . . 60: 16 at UNTITLED/.Trashes […] . . . 67: 17 at UNTITLED/.Trashes/502 […] . . . 2f: 18 at UNTITLED/.fseventsd […] No transactions in progress […] Observers: […] pid 717 […] port 0x8783(4) watching 192(UnmountFailed, Unmounted) […] port 0x8947(3) watching 192(UnmountFailed, Unmounted) […] port 0x5427(2) watching 192(UnmountFailed, Unmounted) […] port 0xe017(1) watching 194(Mounted, UnmountFailed, Unmounted) […] […] 0x943f(9) watching 194(Mounted, UnmountFailed, Unmounted) […] port 0xdaab(8) watching 11(RepairStarted, Mounted, Renamed) […] port 0x9dc7(7) watching 202(Mounted, Renamed, UnmountFailed, Un[…] […] port 0x7447(6) watching 234(Mounted, Renamed, AboutToUnmount, U[…] […] port 0xcc9b(5) watching 194(Mounted, UnmountFailed, Unmounted) […] port 0x6263(4) watching 192(UnmountFailed, Unmounted) […] port 0xc943(3) watching 192(UnmountFailed, Unmounted) […] port 0x9927(2) watching 192(UnmountFailed, Unmounted) […] port 0x24a3(1) watching 250(Mounted, Renamed, PropertyChanged, […] […] pid 168 […] port 0x7863(5) watching 194(Mounted, UnmountFailed, Unmounted) […] port 0x6ad3(4) watching 192(UnmountFailed, Unmounted) […] port 0x2f97(3) watching 192(UnmountFailed, Unmounted) […] port 0xca93(2) watching 192(UnmountFailed, Unmounted) […] […] Process info: |
Folder Manager
The Folder Manager supports a single environment variable, FolderDebug. If you set this to 1, the Folder Manager will print a number of extra debugging messages. This facility requires the Core Services debug library.
Gestalt
Core Services exports three routines—DebugDumpGestalt, DebugGestalt, and DebugGestaltStr—that you can call from GDB to view the Gestalt registry. Listing 47 shows an example of their use.
Listing 47 Using the Gestalt debug routines
(gdb) call (void)DebugDumpGestalt()
'a/ux': 0x7fff8887b74b (proc)
'addr': 0x00000007
[…]
'vm  ': 0x00000011
[…]
(gdb) call (void)DebugGestalt(0x766d2020)
'vm  ': 0x00000011
(gdb) call (void)DebugGestaltStr("  mv")
'vm ': 0x00000011 |
Prior to Mac OS X 10.5, these routines print the Gestalt selector in reverse on little-endian computers. For example, the first line of output of DebugDumpGestalt would be 'xu/a', not 'a/ux'
(r. 5491464)
.
Pasteboard
Starting in Mac OS X 10.6 the pbs tool (/System/Library/CoreServices/pbs) has a number of useful debugging options. Run the tool with the -? argument to see a list.
If you'd like to see what's been put on the pasteboard, check out the Sample Code 'ClipboardViewer' sample.
Threading
The Core Services threading APIs (MP threads and Thread Manager) support an environment variable, ThreadDebug, that enables a few debug messages and a number of internal consistency checks. This facility requires the Core Services debug library.
Web Services
Web Services supports two helpful environment variables, WSDebug and WSDebugVerbose, which you can set to 1 to get limited and verbose debug logging, respectively. These variables are effective in the non-debug library, but include even more logging in the debug library.
Disks and Discs
Disk Arbitration
If you add a "-d" string to the ProgramArguments array in /System/Library/LaunchDaemons/com.apple.diskarbitrationd.plist and then restart, Disk Arbitration will log detailed information about its activities to /var/log/diskarbitrationd.log.
Disc Recording
If you set the DRVerboseLogging environment variable to 1, Disc Recording will log information about its activity to ~/Library/Logs/DiscRecording.log.
Also, prior to Mac OS X 10.4 Disc Recording would always log to stderr.
Disk Utility
If you set the DUDebugMenuEnabled preference to YES, Disk Utility will display a Debug menu with a number of helpful commands.
Application Services
Core Graphics
Quartz Debug has a number of useful debugging features; see Technical Q&A QA1236, 'Debugging Graphics with QuartzDebug' for more details.
Process Manager
There are circumstances where you want to debug a process, but you don't want to launch it from within GDB. For example, if you've ssh'd into a remote computer in order to debug a GUI application, you shouldn't launch it directly from GDB because the application will be in the wrong Mach bootstrap namespace, and thus can't connect to critical services like the pasteboard server. Normally this isn't a problem: you simply ask the remote user to launch the application for you and then attach to the running application using GDB's attach command. However, what happens if you want to debug the application's startup procedure? You end up playing the 'attach race' game, where the user launches the application and you race to attach with GDB. Not good.
Process Manager offers a nice solution to this problem. If you set the INIT_Processes environment variable to 1, Process Manager will delay the application's launch for 15 seconds, giving you time to attach with GDB. It even logs a nice message (see Listing 48) to the system log letting you know what it's doing.
Listing 48 System log message generated by paused process
[…] Blocking on INIT_Processes for 15 seconds; attach to pid 103 if you want. |
QuickDraw
QuickDraw exports a number of routines that you can call from GDB to get information about QuickDraw state. The first three routines—QDDebugPrintPortInfo, QDDebugPrintCGSInfo, and QDDebugDumpRegion—print information to stderr. Listing 49 shows an example of their use.
Listing 49 QuickDraw printing routines
(gdb) set $window = (void *) FrontWindow()
(gdb) set $port = (void *) GetWindowPort($window)
(gdb) call (int) QDDebugPrintPortInfo($port)
Dumping port 0x435670...
    PixMap: 0x1FE72C
        Base Address: 0xB0028000 [onscreen, buffered]
        RowBytes: 0xFFFF9400
        Bounds: (0, 0, 106, 352) (352w x 106h)
        Depth: 0020
    Port bounds: (0, 0, 106, 352) (352w x 106h)
    Port shape: 0x1FE798 (0, 0, 106, 352) (352w x 106h) …
    Vis rgn: 0x1FE730 (0, 0, 106, 352) (352w x 106h) …
    Clip rgn: 0x1FE738 (-32000, -32000, 32000, 32000) …
    Fore Color: 0000 0000 0000
    Back Color: FFFF FFFF FFFF
[…]
$21 = 0
(gdb) call (int) QDDebugPrintCGSInfo($port)
CGS info for port 0x435670
    CGSWindowID: 19798
    Shape: 0x59E734 (99, 785, 205, 1137) (352w x …
    Vis Region: 0x59E72C (0, 0, 0, 0) (0w x 0h) [rect]
    Dirty Region: 0x59E730 (0, 0, 0, 0) (0w x 0h) [rect]
$20 = 0
(gdb) # 0x1FE730 is "Vis rgn" from QDDebugPrintPortInfo
(gdb) set $rgn=0x1FE730
(gdb) call (int)QDDebugDumpRegion($rgn)
Size = 116  Bounds = (0, 0, 106, 352) (352w x 106h) NEW FORMAT
0: 2 350
1: 1 351
2: 0 352
104: 1 351
105: 2 350
106:

$21 = 0 |
The remaining routines are designed to help you visualize regions on screen by flashing the region shape. Listing 50 shows how to call these routines; unfortunately you can't see the results in this document, so you'll have to try this yourself. It assumes that the $port and $rgn convenience variables are set up as per the previous listing.
Listing 50 QuickDraw flashing routines
(gdb) call (int) QDDebugFlashRegion($port, $rgn) $23 = 0 (gdb) call (void) QDDebugFlashClipRgn($port) (gdb) call (void) QDDebugFlashPortShape($port) (gdb) call (void) QDDebugFlashVisRgn($port) (gdb) call (int) QDDebugFlashCGSWindowShape($port) $24 = 0 (gdb) call (int) QDDebugFlashCGSWindowOpaqueShape($port) $25 = 0 (gdb) call (int) QDDebugFlashCGSVisRgn($port) $26 = 0 (gdb) call (int) QDDebugFlashCGSDirtyRgn($port) $27 = 0 |
Services
The Services Implementation Guide describes a number of helpful hints about debugging services, including:
the
NSDebugServicesuser defaultthe
pbstool
Quick Look
Quick Look has some nice features to help you debug your generator code; these are documented in depth in the Quick Look Programming Guide.
Carbon (HIToolbox)
Carbon's HIToolbox includes a wealth of facilities for your debugging convenience:
There is a debug variant of the HIToolbox library that prints debugging messages when it encounters errors.
There are numerous HIToolbox routines that you can call from within GDB to print information about HIToolbox objects in your process, including events, menus, windows, dialogs, and controls.
There are routines to flash regions so that can visualize them on screen.
This are a variety of facilities to trace events as they flow through the toolbox.
Mac OS X 10.5 and later | Mac OS X 10.4.x and earlier |
|---|---|
DebugPrintMainEventQueue | GDBPrintEventQueue |
DebugPrintEventQueue | _DebugPrintEventQueue |
DebugPrintEvent | _DebugPrintEvent |
DebugPrintDialogInfo | GDBShowDialogInfo |
DebugPrintControlHierarchy | GDBShowControlHierarchy |
DebugPrintControl | GDBShowControlInfo |
DebugSetEventTraceEnabled | SetEventTraceEnabled |
DebugTraceEventByName | TraceEventByName, UntraceEventByName |
DebugTraceEvent | TraceEvent, UntraceEvent |
HIToolbox Object Printing Routines
The following listings show the various HIToolbox object printing routines.
Listing 51 HIToolbox event printing
(gdb) call (int)DebugPrintMainEventQueue()

Printing event queue 0x7632536c...
RunLoop: 0x40c560
Count: 4 Header: 0x1805010 Head: 0x49faf0 Tail: 0x489d10

EventRef Event Kind           Time       P Cnt Desc
-------- -------------------- ---------- - --- --------------------
  49FAF0 kEventMouseDown       219335.28 H 001 x=879, y=61, button 1
  489530 kEventWindowActivate  219335.46 H 002 0x4350A0 "Untitled 1"
  43A4E0 kEventAppActiveWindo 218971.143 S 002
  489D10 kEventWindowUpdate   219335.473 L 002 0x4A3C10 "Untitled 1 Properties"
$2 = 0
(gdb) # 0x489D10 is the kEventWindowUpdate event from last command
(gdb) call (void) DebugPrintEvent(0x489D10)
Displaying event 489D10...
   Class           wind
   Kind            1
   When                219335
   Priority        Low
   RetainCount     2
   Queued          Yes
   Info            kEventWindowUpdate, 0x4A3C10 "Untitled 1 Properties"
   Parameters
        param: ----
           type: wind
           size: 4
           data: 004A3C10
J< |
Listing 52 HIToolbox menu printing
(gdb) call (void) DebugPrintMenuList()
Index  MenuRef     ID   Title
----- ---------- ------ -----
    1  0x0041F330 -21629 <Apple>
    2  0x0042EC00     128  QuickTime Player
    3  0x0043C4B0     129  File
    4  0x00445B70     130  Edit
[…]
<hierarchical menus>
           0x0042CF90     140  Open Recent
(gdb) # 0x0042EC00 is the QuickTime Player menu
(gdb) set $menu=0x0042EC00
(gdb) call (void) DebugPrintMenu($menu)
MenuRef: 0x0042EC00
    Title : QuickTime Player
    ID : 128
    Width : 0
    Height : 0
    Enabled : true
    Attributes : CondenseSeparators, ReceivedInit
    Modal level : 0
    Refcount : 3
    Element : 0x004435B0
    Item Count : 12
    Item Icon  Cmd Key   Mark   CmdID E V Text
    ---- ---- -------- -------- ----- - - ----
    0001 0000 0x00 ' ' 0x00 ' '       Y Y About QuickTime Player
    0002 0000 0x00 ' ' 0x00 ' '       N Y -
    0003 0000 0x00 ' ' 0x00 ' '  pref Y Y Preferences
[…]
HIObject
    Ref count : 3
    Event Target : 0x42f040
    Event Handler : 0x436f10
(gdb) call (void) DebugPrintMenuItem($menu, 1)
Menu: 0x0042EC00 Item: 1 Info:
 Text: About QuickTime Player
 Mark: <none>
 Cmd Key: <none>
 Icon: <none>
 Style Normal
 Command ID: 0 (0x00000000)
 Modifiers: 0x00
[…] |
Listing 53 HIToolbox window and dialog printing
(gdb) call (void) DebugPrintWindowList()

Window      Class    WID  Vis Hil Level Title                 Group
---------- -------- ---- --- --- ----- --------------------- -----------…
0x004350A0  Document 4ED4  Y   Y      0 Untitled 1            0x76E47A89 …
0x004A3C10  Document 4EED  Y   N      0 Untitled 1 Properties 0x76E47A89 …
(gdb) # 0x004350A0 is the "Untitled 1" window
(gdb) set $window=0x004350A0
(gdb) # 0x004A3C10 is the "Untitled 1 Properties" dialog
(gdb) set $dialogWindow=0x004A3C10
(gdb) call (void) DebugPrintWindow($window)
Window 0x004350A0
    Title : Untitled 1
    Class : Document
    Group : 0x76E47A89 "com.apple.HIToolbox.windowgroups.document"
    Scope : all
    Attributes : Collapse Box, In WindowMenu
    Visible : Yes
    Collapsed : No
    Latent visibility : <none>
    Highlighted : Yes
    Structure region : 1FE80C #0, #0, #106, #352 (#352w x #106h) [non-rect]
[…]
(gdb) call (void) DebugPrintAllWindowGroups()
Window group tree
-------------------------------------------------------------------------…
  1  level    0  group 0x76E0BFE9 "com.apple.hitoolbox.windowgroups.root"
  2  level    0    group 0x76E47A89 "com.apple.HIToolbox.windowgroups.doc…
(gdb) # 0x76E47A89 is the second window group
(gdb) call (void) DebugPrintWindowGroup(0x76E47A89)
WindowGroup 0x76E47A89 "com.apple.HIToolbox.windowgroups.document"
 Attributes: <none>
 Refcount: 1
 Previous group: <none>
 Next group: <none>
 Parent group: 0x76E0BFE9 "com.apple.hitoolbox.windowgroups.root"
[…]
(gdb) set $dialog = (void *) GetDialogFromWindow($dialogWindow)
(gdb) call (void) DebugPrintDialogInfo($dialog)
Dialog: 0x76ED59A1
 Window: 0x004A3C10 "Untitled 1 Properties"
 TextHandle: 0x0059EC7C
 Default Item: 1
 Cancel Item: 0
 Keyboard Focus Item: 0
RefCon: 0x06054AB5 (101010101) |
Listing 54 HIToolbox control printing
(gdb) call (void) DebugPrintControlHierarchy($window)
Dumping info for window 0x4A3C10
Window found. Dumping views...
Root 0x4ba260 , ID ''/0, (-32768,-32768,32767,32767), Embedder, Vis, Act,…
    Control 0x4c24d0 <appl/sbar> ( "" ), ID ''/0, (172,301,226,317), Vis,…
    Control 0x4c6080 <appl/sbar> ( "" ), ID ''/0, (75,301,142,317), Vis, …
    Control 0x4c49c0 <appl/push> ( "Delete" ), ID ''/0, (241,220,261,290)…
    Control 0x4c4790 <appl/push> ( "Edit?" ), ID ''/0, (241,135,261,205),…
    Control 0x4c17c0 <appl/push> ( "Add?" ), ID ''/0, (241,50,261,120), V…
    Control 0x4be1d0 <appl/popb> ( "" ), ID ''/0, (12,176,28,316), Vis, A…
    Control 0x4ba1f0 <appl/popb> ( "" ), ID ''/0, (12,24,28,164), Vis, Ac…
(gdb) # 0x4c24d0 is first scrollbar control
(gdb) call (void) DebugPrintControl(0x4c24d0)
HIScrollBar
    Size : Auto
    Live Tracking : No
Control 0x004C24D0 ""
    Control Kind : 'appl', 'sbar'
    Control ID : '', 0
    Window : 0x004A3C10 "Untitled 1 Properties"
    Parent : 0x004BA260
    Minimum : 0 (0x00000000)
    Maximum : 0 (0x00000000)
    Value : 0 (0x00000000)
[…]
HIObject
    Ref count : 1
    Event Target : 0x4c39a0
Event Handler : 0x4c3a10 |
Finally, you can print the debug information for any HIObject (windows, menus, controls, HIViews, and so on) using HIObjectPrintDebugInfo.
HIToolbox Region Flashing
The routines shown in Listing 55 can be used to flash regions so that you can visualize them on screen; unfortunately you can't see the results in this document, so you'll have to try this yourself.
Listing 55 HIToolbox region flashing routines
(gdb) call (void) DebugFlashWindowVisRgn($window) (gdb) call (void) DebugFlashWindowUpdateRgn($window) |
You can also use HIViewFlashDirtyArea, introduced in Mac OS X 10.5 and documented in HIToolboxDebugging.h.
HIToolbox Event Debugging
With the advent of Carbon Events, it's often hard to understand the flow of events through the toolbox. HIToolbox offers two debugging facilities that can help here.
EventDebug Environment Variable
By setting the EventDebug environment variable to 1, you cause HIToolbox to log all events as they flow through the system. Listing 56 shows an example of this.
Listing 56 EventDebug output
$ EventDebug=1 /Applications/iTunes.app/Contents/MacOS/iTunes
Event Posted: Queue: 0x1809c00, Event: kEventAppleEvent, 4949.1, S …
SendEventToEventTarget entered with event kEventTargetHandlerInstalled
    Sending event to target application: kEventTargetHandlerInstalled
        Leaving target application with result -9874
[…]
SendEventToEventTarget entered with event kEventHIObjectInitialize
    Sending event to target 0xb: kEventHIObjectInitialize
        SendEventToEventTarget entered with event kEventControlInitialize
            Sending event to target 0xb: kEventControlInitialize
                Called handler 0x945f072a. Event was handled
                Leaving target 0xb with result 0
[…] |
You can programmatically enable and disable event tracing with the routine DebugSetEventTraceEnabled.
Event Tracing
The EventDebug environment variable produces a lot of output, which can have some negative effects. Specifically, it slows your program down considerably and it's sometimes hard to find the information you're looking for amongst all the output.
One solution to this problem is to enable event-by-event tracing. You can do this by calling the DebugTraceEventByName routine from within GDB. Listing 57 shows an example of this, enabling tracing just for the kEventRawKeyDown event.
Listing 57 Event tracing
(gdb) call (void) DebugTraceEventByName("kEventRawKeyDown", 1)
(gdb) c
Continuing.
Event Posted: Queue: 0x76309338, Event: kEventRawKeyDown, 221443.183, S
SendEventToEventTarget entered
    Sending Event to 0x415750: kEventRawKeyDown
        SendEventToEventTarget entered
            Sending Event to 0x413050: kEventRawKeyDown
                Called handler 0x928CD05C. Event was NOT handled
                Leaving target 0x413050 with result -9874
        SendEventToEventTarget entered
            Sending Event to 0x42DE30: kEventRawKeyDown
                Leaving target 0x42DE30 with result -9874
            Sending Event to 0x4351F0: kEventRawKeyDown
                Leaving target 0x4351F0 with result -9874
            Sending Event to 0x4126F0: kEventRawKeyDown
                Called handler 0x929597E0. Event was NOT handled
                Called handler 0x927F4F40. Event was NOT handled
                Leaving target 0x4126F0 with result -9874
        Leaving target 0x415750 with result -9874
Event Removed: Queue: 0x76309338, Event: kEventRawKeyDown, 221443.183, S
Event Pulled (C): kEventRawKeyDown, 221443.183, S |
Also, starting in Mac OS X 10.5, you can see what events are being traced by calling DebugPrintTracedEvents.
HIToolbox Event Statistics
There are two environment variables that cause HIToolbox to print event statistics. If you set EventRate to 1, HIToolbox will, every second, print a summary of the events handled that second. If you set HLTBRecordEventStats, HIToolbox will print a bunch of statistics about event handling when your application quits; this feature requires the debug library.
Other HIToolbox Debugging Facilities
If you set the NSQuitAfterLaunch environment variable to 1, your application will quit as soon as it enters its event loop. This is useful if you want to measure application launch time, or look for leaks. This environment variable is also supported by AppKit.
If you set the HLTBPrintKeyMatchingStatus environment variable to 1, HIToolbox will print detailed information about menu item matching. This feature requires the debug library.
If you set the TSMEventTracing environment variable to 1, HIToolbox will print detailed information about Text Services Manager (TSM) event processing.
Cocoa and Cocoa Touch
All Cocoa objects (everything derived from NSObject) support a description method that returns an NSString describing the object. The most convenient way to access this description is via Xcode's Print Description to Console menu command. Alternatively, if you're a command line junkie, you can use GDB's print-object (or po for short) command, as illustrated by Listing 58.
Listing 58 Using GDB's po command
$ gdb /Applications/TextEdit.app
GNU gdb 6.3.50-20050815 (Apple version gdb-1346) […]
(gdb) fb -[NSCFDictionary copyWithZone:]
Breakpoint 1 at 0x83126e97675259
(gdb) r
Starting program: /Applications/TextEdit.app/Contents/MacOS/TextEdit
Reading symbols for shared libraries […]
Breakpoint 1, 0x00007fff837aa259 in -[NSCFDictionary copyWithZone:] ()
(gdb) po $rdi
{
    AddExtensionToNewPlainTextFiles = 1;
    AutosaveDelay = 30;
    CheckGrammarWithSpelling = 0;
    CheckSpellingWhileTyping = 1;
    […]
} |
Curiously, the debugDescription method is not declared in any header. If you want to implement it yourself, you should do so as shown in Listing 59.
Listing 59 Implementing debugDescription
- (NSString *)debugDescription { ... your code here ... } |
Objective-C
To break on an Objective-C exception, regardless of how it's thrown, set a symbolic breakpoint on objc_exception_throw. The easiest way to set such a breakpoint is with Xcode's Stop on Objective-C Exceptions menu command.
If you set the NSObjCMessageLoggingEnabled environment variable to "YES", the Objective-C runtime will log all dispatched Objective-C messages to a file named /tmp/msgSends-<pid>.
If you set the OBJC_HELP environment variable (10.4 and later), the Objective-C runtime will print out a list of all of the debugging environment variables that it supports. The exact list varies from release-to-release, so you should set OBJC_HELP on your particular system to see what's available. Table 20 lists some of the highlights.
Variable | Summary |
|---|---|
OBJC_PRINT_IMAGES | Log images loaded by runtime |
OBJC_PRINT_LOAD_METHODS | Log execution of +load methods |
OBJC_DEBUG_FRAGILE_SUPERCLASSES | Warns if a class's instance variables overlap its superclass's instance variables |
OBJC_PRINT_EXCEPTIONS (Mac OS X 10.5 and later) | Log exception handling |
OBJC_PRINT_REPLACED_METHODS (Mac OS X 10.5 and later) | Prints information about replaced methods; this is particularly useful when implementing plug-ins, or an application that hosts plug-ins |
Assembly-Level Objective-C Debugging
When debugging Cocoa code at the assembly level, keep in mind the following features of the Objective-C runtime:
The Objective-C compiler adds two implicit parameters to each method, the first of which is a pointer to the object being called (
self).The second implicit parameter is the method selector (
_cmd). In Objective-C this is of typeSEL; in GDB you can print this as a C string.The Objective-C runtime dispatches methods via a family of C function. The most commonly seen is
objc_msgSend, but some architectures useobjc_msgSend_stretfor methods which returns structures, and some architectures useobjc_msgSend_fpretfor methods that return floating point values. There are also equivalent functions for callingsuper(objc_msgSendSuperand so on).The first word of any Objective-C object (the
isafield) is a pointer to the object's class.
Table 21 is a summary of how to access self and _cmd from GDB if you've stopped at the first instruction of a method. For more information about this, see Some Assembly Required.
Architecture | self | _cmd |
|---|---|---|
Intel 64-bit | $rdi | $rsi |
Intel 32-bit | *(int*)($esp+4) | *(int*)($esp+8) |
PowerPC | $r3 | $r4 |
Listing 60 shows an example of how to use this information from GDB.
Listing 60 Objective-C runtime 'secrets'
$ gdb /Applications/TextEdit.app GNU gdb 6.3.50-20050815 (Apple version gdb-1346) […] (gdb) # Give the runtime a chance to start up. (gdb) fb NSApplicationMain Breakpoint 1 at 0x9374bc69df7307 (gdb) r Starting program: /Applications/TextEdit.app/Contents/MacOS/TextEdit Reading symbols for shared libraries […] Breakpoint 1, 0x00007fff841a0307 in NSApplicationMain () (gdb) # Set a breakpoint on -retain. (gdb) b *'-[NSObject(NSObject) retain]' Breakpoint 2 at 0x7fff8608a860 (gdb) c Continuing. Breakpoint 2, 0x00007fff8608a860 in -[NSObject(NSObject) retain] () (gdb) # Hit the breakpoint; dump the first 4 words of the object (gdb) x/4xg $rdi 0x1001138f0: 0x00007fff7055e6d8 0x0041002f01a00000 0x100113900: 0x0069006c00700070 0x0069007400610063 (gdb) # Now print the selector (gdb) x/s $rsi 0x7fff848d73d8: "retain" (gdb) # Want to 'po' object; must disable the breakpoint first (gdb) dis (gdb) po $rdi /Applications/TextEdit.app (gdb) # Print the 'isa' pointer, which is a Class object. (gdb) po 0xa02d9740 NSPathStore2 |
When debugging without symbols, you can use functions from the Objective-C runtime to assist your debugging efforts. The routines shown in Table 22 are particularly useful.
Function | Summary |
|---|---|
id objc_getClass(const char *name); | Get the Objective-C Class object for the given class name |
SEL sel_getUid(const char *str); | Get the Objective-C SEL for the given method name |
IMP class_getMethodImplementation(Class cls, SEL name); | Get a pointer to the code that implements the given method in a given class; available on Mac OS X 10.5 and later |
Method class_getInstanceMethod(Class, SEL); | Get the Objective-C Method for a given instance method in a given class |
Listing 61 shows an example of debugging the -[DocumentController openUntitledDocumentAndDisplay:error:] method of TextEdit, even though TextEdit does not ship with symbols.
Listing 61 Using the Objective-C runtime to debug without symbols
$ gdb -arch x86_64 /Applications/TextEdit.app
GNU gdb 6.3.50-20050815 (Apple version gdb-1346) […]
(gdb) r
Starting program: /Applications/TextEdit.app/Contents/MacOS/TextEdit
Reading symbols for shared libraries […]
^C
(gdb) # Try to find the
(gdb) # -[DocumentController openUntitledDocumentAndDisplay:error:]
(gdb) # symbol.
(gdb) info func openUntitledDocumentAndDisplay
All functions matching regular expression "openUntitledDocumentAndDisplay":

Non-debugging symbols:
0x00007fff843ac083 -[NSDocumentController openUntitledDocumentAndDisplay:error:]
(gdb) # These are not the droids we're looking for. It turns out that
(gdb) # TextEdit ships with its symbols stripped, so we'll have to do
(gdb) # this the hard way.
(gdb) #
(gdb) # Get the Class object for the DocumentController class.
(gdb) set $class=(void *)objc_getClass("DocumentController")
(gdb) # Get the SEL object for the "openUntitledDocumentAndDisplay:error:" method.
(gdb) set $sel=(void *)sel_getUid("openUntitledDocumentAndDisplay:error:")
(gdb) # Get a pointer to the method implementation.
(gdb) call (void*)class_getMethodImplementation($class, $sel)
$1 = (void *) 0x100001966
(gdb) # Confirm that this is sensible. Looks like a method prologue to me.
(gdb) x/4i 0x00009aa5
0x100001966: push   %rbp
0x100001967: mov    %rsp,%rbp
0x10000196a: push   %r12
0x10000196c: push   %rbx
(gdb) # Set a breakpoint on the method.
(gdb) b *0x100001966
Breakpoint 1 at 0x100001966
(gdb) # Resume execution, and then create a new, untitled document.
(gdb) c
Continuing.
[…]
Breakpoint 1, 0x0000000100001966 in ?? ()
(gdb) # We've hit our breakpoint; print the parameters, starting with
(gdb) # the implicit "self" and "SEL" parameters that are common to all
(gdb) # methods, followed by the method-specific "display" and
(gdb) # "error" parameters.
(gdb) po $rdi
<DocumentController: 0x100227a50>
(gdb) x/s $rsi
0x7fff848e4e04: "openUntitledDocumentAndDisplay:error:"
(gdb) p (int)$rdx
$2 = 1
(gdb) x/xg $rcx
0x7fff5fbff108: 0x00000001001238f0 |
Listing 62 Using class_getInstanceMethod when class_getMethodImplementation is not available
$ # You should only do this on old systems, so we're going to run
$ # TextEdit as i386 in order to get the old Objective-C runtime.
$ gdb -arch i386 /Applications/TextEdit.app
GNU gdb 6.3.50-20050815 (Apple version gdb-1346) […]
(gdb) r
Starting program: /Applications/TextEdit.app/Contents/MacOS/TextEdit
Reading symbols for shared libraries […]
^C
Program received signal SIGINT, Interrupt.
0x94af18da in mach_msg_trap ()
(gdb) # These steps are unchanged.
(gdb) set $class=(void *)objc_getClass("DocumentController")
(gdb) set $sel=(void *)sel_getUid("openUntitledDocumentAndDisplay:error:")
(gdb) # Get the Method for that method of that class
(gdb) call (void*)class_getInstanceMethod($class, $sel)
$1 = (void *) 0x11aab0
(gdb) # Dump the Method
(gdb) x/3x 0x11aab0
0x11aab0: 0x913b28c9  0x00015acb  0x00002b64
(gdb) # Print the first word, just to make sure everything is copacetic
(gdb) x/s 0x913b28c9
0x913b28c9: "openUntitledDocumentAndDisplay:error:"
(gdb) # The third word is a pointer to code; confirm that this is sensible
(gdb) x/4i 0x00002b64
0x2b64: push   %ebp
0x2b65: mov    %esp,%ebp
0x2b67: push   %esi
0x2b68: push %ebx |
You can learn more about the Objective-C runtime functions and data structures by looking through the headers in /usr/include/objc/.
Garbage Collection
If you set the AUTO_USE_GUARDS environment variable to YES, the garbage collected memory allocator will work like the Guarded Memory Allocator, placing guard pages at the end of each memory allocation. This is a great way to detect buffer overruns.
If you set the AUTO_DISABLE_GENERATIONAL environment variable to YES, the garbage collected memory allocator will disable its generational collector; all collections will be full collections.
You can use the environment variables from Table 23 to enable various logging facilities in the garbage collected memory allocator. Some of these will generate a lot of logging.
Environment Variable | Effect |
|---|---|
AUTO_LOG_COLLECTIONS | Log when a collection occurs |
AUTO_LOG_REGIONS | Log when new regions are allocated |
AUTO_LOG_WEAK | Log all weak reference manipulations |
AUTO_LOG_ALL | Equivalent to setting all of the above |
AUTO_REFERENCE_COUNT_LOGGING | Enables reference count logging |
The garbage collected memory allocator supports some other potentially useful environment variables, as shown in Table 24.
Environment Variable | Effect |
|---|---|
AUTO_COLLECT_EXHAUSTIVE_NOTIFICATION | If set, the allocator listens for a notification (in the <notify.h> sense) of the specified name and, when notified, triggers a collection |
AUTO_DIRTY_ALL_DELETED | Deleted objects will be scribbled (similar to MallocScribble) |
AUTO_USE_TLC | Disables the thread local collector (TLC) |
When writing garbage collected code you sometimes run into problems where an object lives beyond its expected life. There are two useful GDB commands for debugging this:
info gc-rootslists the roots leading to a specified addressinfo gc-referenceslists all of the direct references to a specified address
You can also access these commands via Xcode's Print Roots to Console and Print Referers to Console menu items.
If you have dual mode code (code that supports both the garbage collected and retain/release models), you can force it to run in retain/release mode by setting the OBJC_DISABLE_GC environment variable to YES.
Foundation
Foundation has a number of debugging facilities that are enabled by environment variables. Table 25 highlights the most interesting ones; these are all further documented in NSDebug.h.
Name | Default | Action |
|---|---|---|
NSZombieEnabled | NO | If set to YES, deallocated objects are 'zombified'; this allows you to quickly debug problems where you send a message to an object that has already been freed; see More Zombies! for details |
NSDeallocateZombies | NO | If set to YES, the memory for 'zombified' objects is actually freed |
NSUnbufferedIO | NO | If set to YES, Foundation will use unbuffered I/O for stdout (stderr is unbuffered by default) |
Retain Counts
You can use -retainCount to get the current retain count of an object. While this can sometimes be a useful debugging aid, be very careful when you interpret the results. Listing 63 shows one potential source of confusion.
Listing 63 Confusing retain count
(gdb) set $s=(void *)[NSClassFromString(@"NSString") string] (gdb) p (int)[$s retainCount] $4 = 2147483647 (gdb) p/x 2147483647 $5 = 0x7fffffff (gdb) # The system maintains a set of singleton strings for commonly (gdb) # used values, like the empty string. The retain count for these (gdb) # strings is a special value indicating that the object can't be (gdb) # released. |
Another common source of confusion is the autorelease mechanism. If an object has been autoreleased, its retain count is higher than you might otherwise think, a fact that's compensation for by the autorelease pool releasing it at some point in the future.
You can determine what objects are in what autorelease pools by calling _CFAutoreleasePoolPrintPools to print the contents of all the autorelease pools on the autorelease pool stack.
Listing 64 Printing the autorelease pool stack
(gdb) call (void)_CFAutoreleasePoolPrintPools() - -- ---- -------- Autorelease Pools -------- ---- -- - ==== top of stack ================ 0x327890 (NSCFDictionary) 0x32cf30 (NSCFNumber) […] ==== top of pool, 10 objects ================ 0x306160 (__NSArray0) 0x127020 (NSEvent) 0x127f60 (NSEvent) ==== top of pool, 3 objects ================ - -- ---- -------- ----------------- -------- ---- -- - |
On earlier systems you can use the NSAutoreleasePoolCountForObject function to determine how many times an object has been added to an autorelease pool. For an example, see Listing 65.
Listing 65 Calling NSAutoreleasePoolCountForObject
(gdb) # d is an NSDictionary created with -[NSDictionary dictionaryWithObjectsAndKeys:].
(gdb) p d
$1 = (NSDictionary *) 0x12d620
(gdb) po d
{
    test = 12345;
}
(gdb) p (int)[d retainCount]
$2 = 1
(gdb) p (int)NSAutoreleasePoolCountForObject(d)
$3 = 1 |
Starting with Mac OS X 10.6, NSAutoreleasePool implements a number of DTrace probes that you can use to profile and debug autorelease issues. See the Foundation Framework Release Notes for details..
More Zombies!
A common type of bug when programming with Cocoa is over-releasing an object. This typically causes your application to crash, but the crash occurs after the last reference count is released (when you try to message the freed object), which is usually quite removed from the original bug. NSZombieEnabled is your best bet for debugging this sort of problems; it will uncover any attempt to interact with a freed object.
The easiest way to enable zombies is via Instruments. However, you can also enable zombies via an environment variable. Listing 66 shows the type of the message you'll see in this case.
Listing 66 The effect of NSZombie
$ NSZombieEnabled=YES build/Debug/DummyMac.app/Contents/MacOS/DummyMac […] -[AppDelegate testAction:] […] *** -[CFNumber release]: message sent to deallocated instance 0x3737c0 Trace/BPT trap |
As shown in Listing 66, the system will execute a breakpoint instruction if it detects a zombie. If you're running under GDB, the program will stop and you can look at the backtrace to see the chain of calls that triggered the zombie detector.
NSZombieEnabled also affects Core Foundation objects as well as Objective-C objects. However, you'll only be notified when you access a zombie Core Foundation object from Objective-C, not when you access it via a CF API.
Other Foundation Magic
If you're using Key-Value Observing and you want to know who is observing what on a particular object, you can get the observation information for that object and print it using using GDB's print-object command. Listing 67 shows an example of this.
Listing 67 Display key-value observers
(gdb) # self is some Objective-C object. (gdb) po self <ZoneInfoManager: 0x48340d0> (gdb) # Let's see who's observing what key paths. (gdb) po [self observationInfo] <NSKeyValueObservationInfo 0x48702d0> ( <NSKeyValueObservance 0x4825490: Observer: 0x48436e0, \ Key path: zones, Options: <New: NO, Old: NO, Prior: NO> \ Context: 0x0, Property: 0x483a820> ) |
You can set the NSShowNonLocalizedStrings preference to find strings that should have been localized but weren't. Once enabled, if you request a localized string and the string is not found in a strings file, the system will return the string capitalized and log a message to the console. This is a great way to uncover problems with out-of-date localizations.
This setting affects NSLocalizedString, all of its variants, and all underlying infrastructure including CFCopyLocalizedString.
If you set the NSBundleLogResourceLookUp preference, NSBundle will log its actions as it looks up resources within bundles; this facility is not available prior to Mac OS X 10.5.
If you set the NSDOLoggingEnabled environment variable to "YES", Foundation will enable logging for Distributed Objects (NSConnection, NSInvocation, NSDistantObject, and NSConcretePortCoder).
If you set the
NSPrintDynamicClassLoadsenvironment variable to "YES", Foundation would log a message whenever it loaded a class or category dynamically (that is, from a bundle).This facility does not work in Mac OS X 10.5 or later; the nearest equivalent is the
DYLD_PRINT_LIBRARIESenvironment variable, discussed in Dynamic Linker (dyld).If you set the
NSExceptionLoggingEnabledenvironment variable to "YES", Foundation would log all exception activity (NSException) tostderr.This facility does not work in Mac OS X 10.5 or later; the nearest equivalent is the
OBJC_PRINT_EXCEPTIONSenvironment variable, discussed in the Objective-C section.
Foundation Scripting
You can enable logging for Foundation's scripting support using the NSScriptingDebugLogLevel preference. Listing 68 shows an example of this; the log shown is the result of running the trivial AppleScript count windows of application "TextEdit".
Listing 68 Enabling NSScriptingDebugLogLevel
$ /Applications/TextEdit.app/Contents/MacOS/TextEdit -NSScriptingDebugLogLevel 1
[…] Suite NSCoreSuite, apple event code 0x3f3f3f3f
[…] Suite NSTextSuite, apple event code 0x3f3f3f3f
[…] Suite TextEdit, apple event code 0x74786474
[…] Command: NSCoreSuite.Count
    Direct Parameter: (null)
    Receivers: (null)
    Arguments: {
        ObjectClass = 1668770158;
    }
[…] Result: 1 |
Foundation scripting objects (things like NSAppleEventDescriptor) have meaningful -description methods, so you get useful output in NSLog and from GDB's print-object command.
One particularly useful example of the above is NSScriptSuiteRegistry. When debugging your scripting definitions, you can see the system's view of your application's scripting definitions by printing the description of +[NSScriptSuiteRegistry sharedScriptSuiteRegistry], as illustrated in Listing 69.
Listing 69 Print the system's view of your scripting definitions
(gdb) po [NSClassFromString(@"NSScriptSuiteRegistry") sharedScriptSuiteRegistry]
Suite: NSCoreSuite ('????') - uses unnamed arguments
    Name: "Standard Suite", description: "Common classes and commands for most applications."
    Class: NSApplication ('capp'), superclass: AbstractObject
        Implementation class: NSApplication
[…] |
Core Data
The com.apple.CoreData.SQLDebug preference lets you see the actual SQL sent to SQLite. See the "Debugging Fetching" section of the Core Data Programming Guide for details. Additionally, if you set the com.apple.CoreData.SyntaxColoredLogging preference to 1, the logging will have spiffy syntax coloring.
The com.apple.CoreData.SQLiteDebugSynchronous preference controls some aspects of the SQLite store. See the "Configuring a SQLite Store's Save Behavior" section of the Core Data Programming Guide for details.
If you set the com.apple.CoreData.SQLiteIntegrityCheck preference to 1, the SQLite store does extra integrity checking.
If you set the com.apple.CoreData.MigrationDebug preference to 1, Core Data will log information about exceptional cases as it migrates data.
The com.apple.CoreData.ThreadingDebug preference enables assertions to enforce Core Data's multi-threading policy. It is a number, where increasing values enable more debugging. A value of 3 is recommended. This feature requires the debug variant of the framework.
AppKit
If you set the NSQuitAfterLaunch environment variable to 1, your application will quit as soon as it enters its event loop. This is useful if you want to measure application launch time or look for leaks. This environment variable is also supported by Carbon.
AppKit Events
If you set the NSTraceEvents preference to YES, AppKit will log information about all events it processes. Listing 70 shows an example of this.
Listing 70 Using NSTraceEvents
$ /Applications/TextEdit.app/Contents/MacOS/TextEdit -NSTraceEvents YES 2010-02-04 11:08:44.776 TextEdit[29986:903] timeout = 62826929475.223495 se[…] 2010-02-04 11:08:44.797 TextEdit[29986:903] got apple event of class 616576[…] 2010-02-04 11:08:44.840 TextEdit[29986:903] still in loop, timeout = 628269[…] 2010-02-04 11:08:44.841 TextEdit[29986:903] timeout = 62826929475.159660 se[…] […] |
AppKit Views
NSView has a private method, _subtreeDescription, that you can call from GDB to see a pretty-printed description of the view's subviews.
If you set the NSShowAllViews preference to YES, AppKit will draw outlines around each of the views in a window. Figure 5 shows how a standard TextEdit window looks with NSShowAllViews enabled.
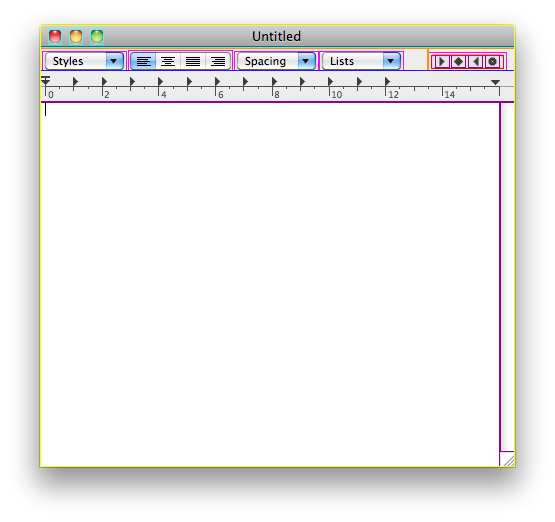
If you set the NSShowAllDrawing preference to YES, AppKit will flash every rectangle that it draws, much like Quartz Debug. Figure 6 shown an example of what to expect.
You can control the duration of the flash by setting NSShowAllDrawing to a number, which is interpreted as the number of milliseconds to flash; the default is 100 ms. You can control the color of the flash by setting NSShowAllDrawingColor to a string that holds three floating point numbers, separated by spaces, representing the red, green, and blue color components. Each number should be a value from 0.0 to 1.0 representing the intensity of that component. For example, the string "0.0 1.0 1.0" would yield pure cyan. Alternatively, if you set NSShowAllDrawingColor to "CYCLE", AppKit will cycle through pure red, pure green, and pure blue.
If you set the NSDebugCursorRects preference to YES, AppKit will log information about its cursor rect handling.
If you set the NSDebugFocusRing preference to YES, AppKit will visually highlight focus rings and log information about their construction.
On Mac OS X 10.6 you can disable concurrent view drawing by setting the NSEnableConcurrentViewDrawing preference to NO.
Other AppKit Magic
The NSBindingDebugLogLevel preference, introduced in Mac OS X 10.4, controls AppKit's response to binding problems. To receive useful logs about a binding problem (rather than, say, an undefined key exception), set this preference to 1. This is useful when trying to find a misconfigured binding in a large, bindings-rich application.
The NSDragManagerLogLevel preference is a number that controls how much logging AppKit does during drag and drop operations. Large values give you more logging. Currently the value of 6 is the maximum effective value. Listing 71 shows an example of how to set this and the kind of output you get when you drag a simple text selection from TextEdit.
Listing 71 Using NSDragManagerLogLevel
$ /Applications/TextEdit.app/Contents/MacOS/TextEdit -NSDragManagerLogLevel 6
2010-02-04 11:32:55.956 TextEdit[30160:903] mouseDown location: {11, 360}, […]
2010-02-04 11:32:55.959 TextEdit[30160:903] offset of image lower left rela[…]
2010-02-04 11:32:55.960 TextEdit[30160:903] type public.rtf: data <7b5c7274[…]
[…] |
The NSAccessibilityDebugLogLevel preference is a number that controls how much logging AppKit does during accessibility operations. We recommend that third party developers always use a value of 1.
Prior to Mac OS X 10.4, NSAccessibilityDebugLogLevel had fewer options: a value of 1 turned logging on and a value of 0 turned it off.
Sync Services
When working with Sync Services, Syncrospector (in /Developer/Applications/Utilities) is an invaluable tool.
Sync Services logs information about its activities to ~/Library/Logs/Sync. You can radically increase the level of logging by running the following commands in Terminal.
Listing 72 Enabling Sync Services logging
$ defaults write -g SyncServicesLogEverything YES $ defaults write com.apple.syncserver SaveSyncServicesDirectory YES |
You must log out and log back in for the settings to become effective.
This will log a lot of information to ~/Library/Application Support/SyncServices. Because this logs so much data, you should make sure to disable it when you're done. You can do that with the following commands.
Listing 73 Disabling Sync Services logging
defaults delete -g SyncServicesLogEverything defaults delete com.apple.syncserver SaveSyncServicesDirectory rm -rf ~/Library/Application\ Support/SyncServices/Local/ save.isyncplayback |
Don't forget to log out and log back in!
Networking
The most critical tool for debugging network code is the packet trace. Technical Q&A QA1176, 'Getting a Packet Trace' discusses how to get a packet trace on Mac OS X.
The netstat tool can display a wealth of information about the state of the local machine's network stack; see its man page for details.
If you want to know what sockets a process has open, you can use the lsof tool; see its man page for details.
The nc tool is extremely useful for basic network testing; see its man page for details.
The telnet tool can also be useful for basic networking testing; see its man page for details.
When debugging Transport Layer Security (TLS, formerly known as the Secure Sockets Layer, or SSL) problems, OpenSSL's s_client and s_server subcommands are extremely useful.
The AirPort daemon (/usr/libexec/airportd) has a number of cool debugging features. To learn more, run the daemon from Terminal without any arguments and read the resulting help text.
Document Revision History
| Date | Notes |
|---|---|
| 2010-11-16 | Updates the document for Mac OS X 10.6. |
| 2007-01-10 | Corrected a misspelling. |
| 2006-07-25 | |
| 2006-04-11 | Added a warning about CFZombieLevel. Corrected bug in Listing 20. |
| 2006-03-31 | A general update for Mac OS X 10.4.x on PowerPC- and Intel-based computers. Added new sections covering the standard C++ library, launchd, lookupd, Disk Utility, Core Graphics, and the Objective-C runtime. |
| 2004-12-02 | New document that describes a large collection of Mac OS X debugging hints and tips. |
Copyright © 2010 Apple Inc. All Rights Reserved. Terms of Use | Privacy Policy | Updated: 2010-11-16