Real world profiling with the OpenGL Profiler
OpenGL Profiler is a very powerful tool for debugging and optimizing OpenGL in Mac OS X. This technote describes basic usage of OpenGL Profiler as well as some real world techniques for application analysis and more advanced topics for more specific testing and profiling. The content of this document describes OpenGL Profiler v.4 which is included in Mac OS X Leopard but should help you use the previous versions as well.
Getting Started
OpenGL Profiler is located at /Developer/Applications/Graphics Tools.
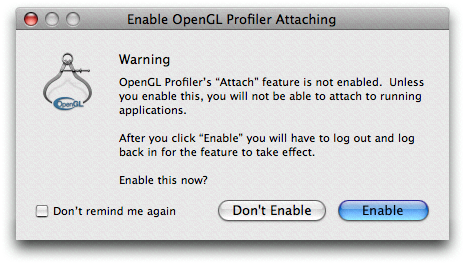
The first time you open OpenGL Profiler, it will give you a choice to enable attaching to running applications as shown in Figure 1.
If you click enable Profiler will set the GL_ENABLE_DEBUG_ATTACH environment variable, which will take effect in the next login. Go ahead and enable it.
The Main Window launch or attach
There are 2 ways to analyze an application, by attaching to a running instance or by launching within Profiler.
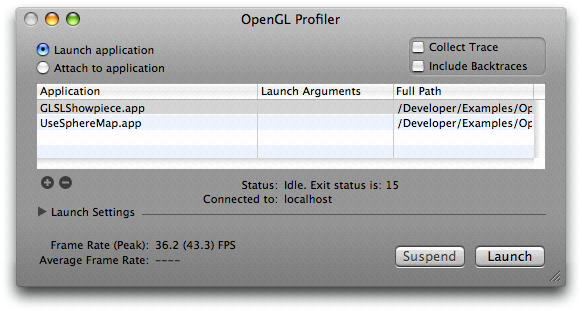
Launching an application with Profiler
The main window with Launch application selected as shown in Figure 2 is where you can drag and drop your application bundle, or you can press the "+" button to add it in the open panel. Select the application name in the table, and press the Launch button to start the application. Also, you can click on the Launch Arguments field and add any arguments needed for the application prior to launching it.
Once running you can start to see the instant and peak Frame Rate.
The default update time of 5 secs for the frame rate display can be changed in the Preferences as shown in OpenGL Profiler Preferences.
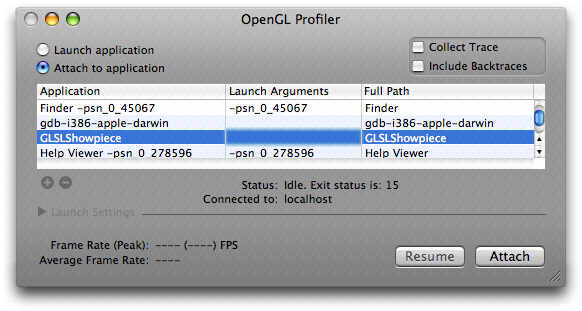
Attaching to a running application
There might be times when attaching to a running application is more convenient, and this can be done by selecting Attach to application , choosing the appropriate process and the clicking the Attach button as shown in Figure 3.
Collecting an OpenGL call trace
Once you have launched or attached to an application, you can collect statistics and trace view of the OpenGL commands submitted by your application.
To collect an OpenGL trace simply select Trace under the Views menu or press Command-Option-T.
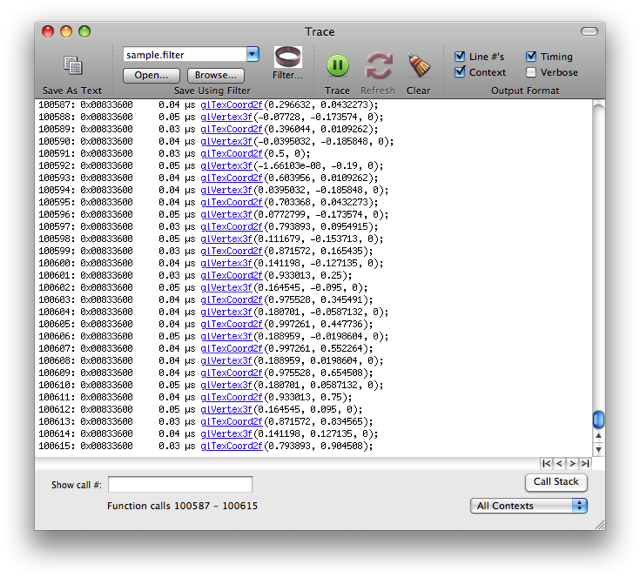
The trace view is very useful to analyze the sequence of operations as well as to identify redundant calls or state mishandling.
Figure 5 shows a trace window with Lines #'s, Contexts and Timing information selected.
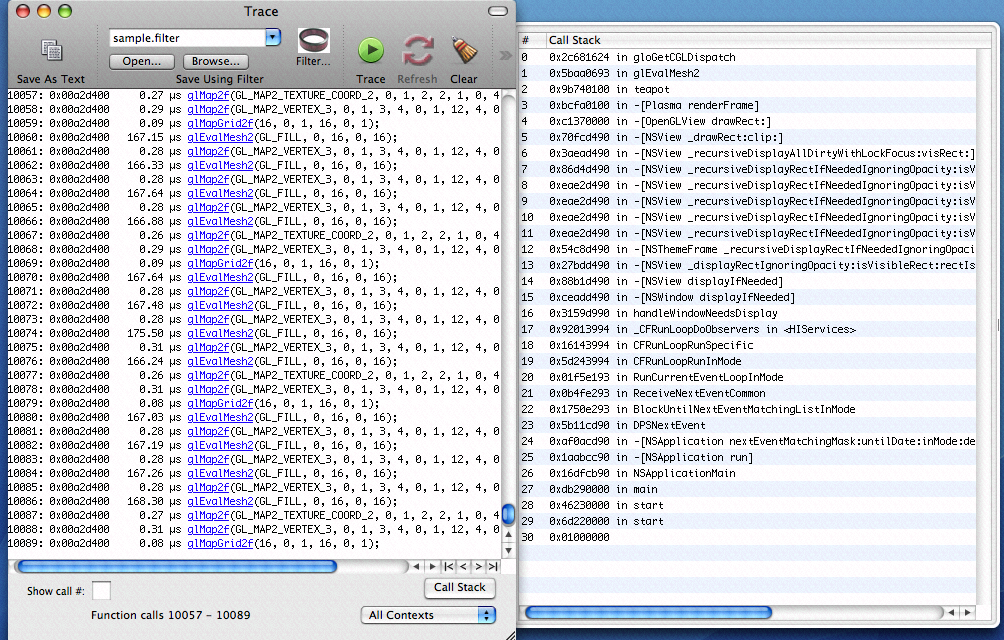
You can also collect backtraces by selecting Include Backtraces on the Profiler's main window.
This will collect backtraces with function names, so you can see who is calling a particularly slow call by clicking on the function name as shown in Figure 6. You may right click on it and choose to view the original image in a new window or tab.
Saving a Trace to a text file
The call trace can be saved to a text file for post processing by clicking on Save As Text
Traces can be long and might take some time to finish saving a text file which can get really large.
With Line #'s, Context and Timing selected the generated text file looks like:
1: 0x00a2d400 0.18 µs glBegin(GL_QUADS); 2: 0x00a2d400 0.08 µs glTexCoord2f(0.025, 0.025); 3: 0x00a2d400 0.08 µs glNormal3f(0, 0, 1); 4: 0x00a2d400 1.19 µs glVertex3f(0, 0.03, 3.15); 5: 0x00a2d400 0.10 µs glVertex3f(0.03, 0, 3.15); 6: 0x00a2d400 0.10 µs glVertex3f(0, -0.03, 3.15); 7: 0x00a2d400 0.08 µs glVertex3f(-0.03, 0, 3.15); 8: 0x00a2d400 0.07 µs glNormal3f(0, 0, -1); 9: 0x00a2d400 0.10 µs glVertex3f(-0.03, 0, 0); 10: 0x00a2d400 0.08 µs glVertex3f(0, -0.03, 0); 11: 0x00a2d400 0.08 µs glVertex3f(0.03, 0, 0); 12: 0x00a2d400 0.09 µs glVertex3f(0, 0.03, 0); |
For information on the Save Using Filter see section Trace Filtering
Collecting OpenGL call statistics
To collect statistics simply select Statistics under the Views menu or press Command-Option-S.
The window presents a table of information that can be reordered by clicking on the column heading.
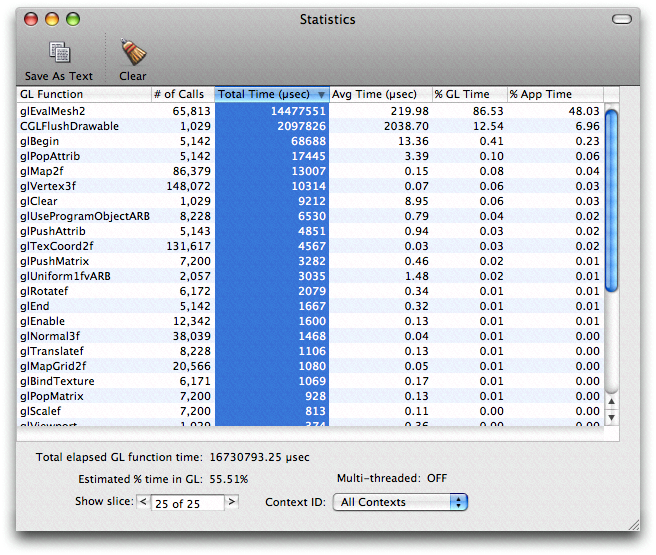
The statistics view is great to see the estimated % of time spent in GL as a total, the percentages of time spent in GL per call and the percentage of App time that a particular call is taking as well as how many times a function is being called.
The "% App Time" field shows an estimate of how much time the application spends in a particular function. This is calculated by timing the each GL call and diving the cummulative results by the total application running time. Managing the timing of the GL calls might skew the numbers a few percentage points but the results are still representative. Shark might give you a more accurate number.
The "% GL Time" is an estimate based on the time a particular function takes in relation to the total time spent inside OpenGL.
Also the statistics can be scrolled in different time slices by using the Show slice at the bottom of the window.
Figure 7 shows the statistics window sorted by the largest Total Time spent in a function.
Saving statistics to a text file
In the same way you can save a call trace to a text file, you can do the same for the statistics, and the text file takes the form:
GL Function;# of Calls;Total Time (µsec);Avg Time (µsec);% GL Time;% App Time ... |
Checking the Pixel Format
Sometimes it is useful to examine the pixel format of a context and Profiler allows you to do just that in the Pixel Format selection under the Views menu or press Command-Option-P
If there are multiple contexts, the one in black is the current context.
Among other things, this is where you look to see if an OpenGL context is double buffered, antialiased, etc.
Figure 8 shows what the Pixel Format window looks like.
There is also a way to override the pixel format that an application asks for with a custom temporary pixel format and this is shown in Launching with a custom pixel format
Setting breakpoints
One of the most powerful features of OpenGL Profiler is the ability to set breakpoints at which resources (textures, ...), GL state, scripts can be run, the multithreaded engine can be enabled, or even see if the current setup is going to run in the CPU or GPU,.
Profiler also allows you to control the execution (or bypass) at the OpenGL function level.
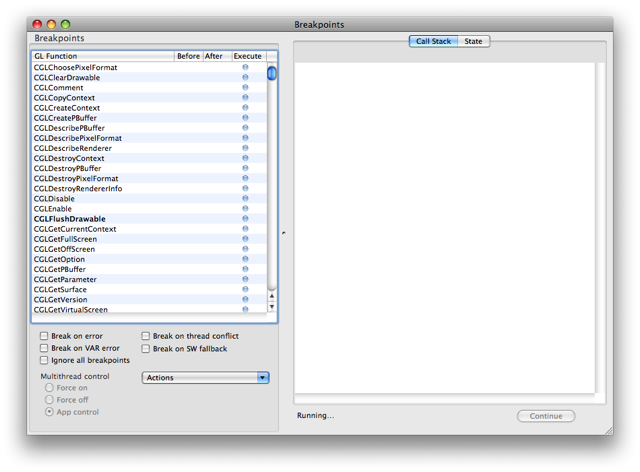
You can set breakpoints by selecting the Breakpoints option of Views menu or you can press Command-Option-B .
Figure 9 shows the breakpoints window.
Breakpoints can be set before or after executing a particular call, at a GL error, VAR error, thread conflict, and software fallback.
To set a breakpoint at a particular call, click under before or after on the line of the particular function of interest. To quickly scroll to a particular GL call you can type the first few letters of the particular function your are interested in.
To set a breakpoint in any GL errors simply click on the Break on Error button, similarly for Break on VAR error , Break on thread conflict and Break on SW fallback.
Once the application hits the breakpoint the call stack, context, kCGLCPGPUFragmentProcessing (fragment processing on the GPU), kCGLCPGPUVertexProcessing (vertex processing on the GPU) and kCGLCPCurrentRendererID (see /System/Library/Frameworks/OpenGL.framework/Headers/CGLRenderers.h) are presented.
In the event of a break for GL error, VAR error or thread conflict there is a useful status message at the bottom of the Call Stack view.
The Actions pop up allows you set and reset all breakpoints. It also allows you to attach scripts to execute at a breakpoint. This feature is discussed at Attaching and running scripts at breakpoints.
Figure 10 shows an application stopped at CGLFlushDrawable with everything running on the GPU at that point.
CGLFlushDrawable.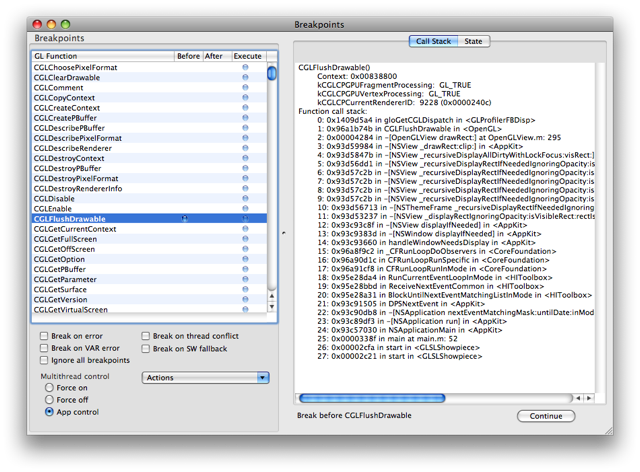
Controlling execution
Execution of a particular call is done by the selection of Execute on the line of that particular call. By default all OpenGL calls are set to execute. The Actions pop up allows you to set or reset global execution.
If a call is set to not execute, it becomes a noop and the consequences of this vary greatly depending on many factors. This functionality should only be used when the code, traces, etc are understood.
Sometimes is necessary to set breakpoints but ignore them for a period of time, this can be achieved by enabling the Ignore all breakpoints button.
To continue execution click on the Continue button at the lower right hand corner of the Breakpoints window.
Inspecting OpenGL state
The current OpenGL state can be checked at breakpoints by clicking on the State tab of the breakpoints window.
This is very useful when rendering anomalies are encountered, for state sorting ideas, etc.
Figure 11 shows the state right before a CGLFlushDrawable, the blue highlighted state is the state that has changed From default state .
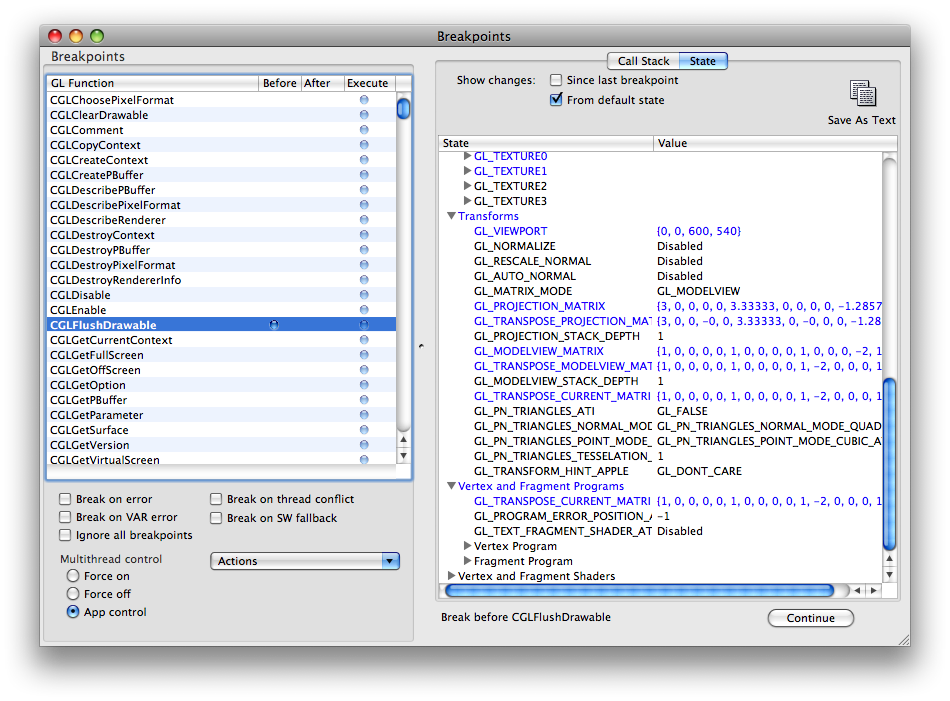
Although not pictured if Since last breakpoint is selected the GL state changes would be highlighted in red. if both the options are selected GL state highlighted in purple signifies changes from default and since last breakpoint.
Viewing Resources
While stopped at a breakpoint a variety of resources can then be examined.
The resource view can be opened by selecting Resources from the Views menu or you can press Command-Option-R.
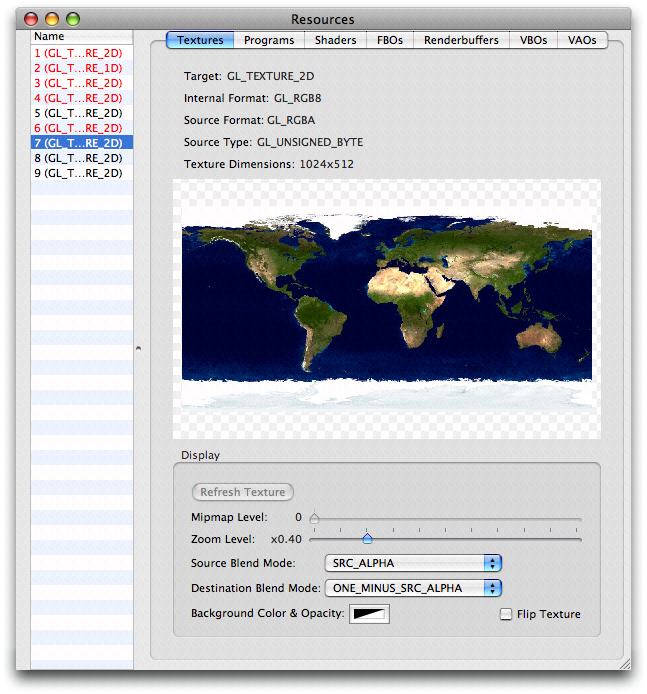
Textures
The Textures tab presents a list of textures objects sorted by their texture ID.
The ones highlighted in red are not loaded into Profiler yet, but a simple click on any of them should bring the texture out.
In this view, the textures can be examined, their target, internal format, source format, source type, and dimensions are shown.
The Mipmap Level slider at the bottom will let you select other mipmaps levels if defined, the Zoom Level slider allows to zoom in and out the texture in the view, the Source Blend Mode and Destination Blend Mode can be adjusted if necessary for proper viewing, the Background Color & Opacity picker will let you select the color and opacity of the background and the Flip Texture button will flip the texture vertically.
Figure 12 shows a texture resource view.
ARB Programs
ARB Programs can be examined in the Resources window under the Programs tab. As with any resource make sure the application is at a break point.
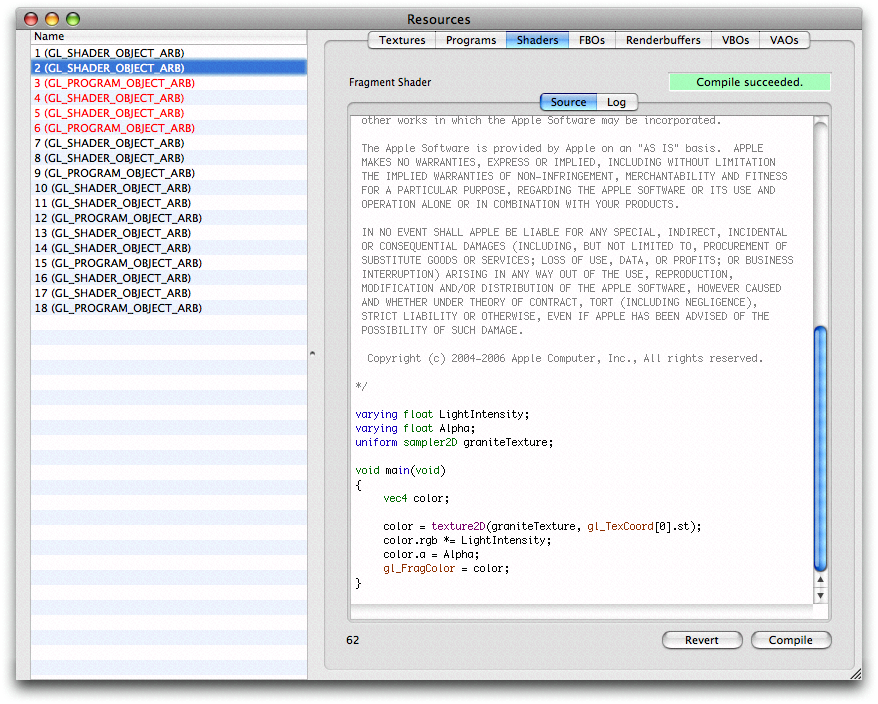
GLSL Shaders
OpenGL Profiler is very useful for examining and even editing shaders in your application. To get there make sure to stop at a breakpoint, open the Resources in the View menu if you haven't already and select the Shaders tab. Here Profiler presents a list of shader and program objects to inspect.
For editing or tweaking shaders in your application this way see the section Editing shaders.
Figure 13 shows what a program object might look like.
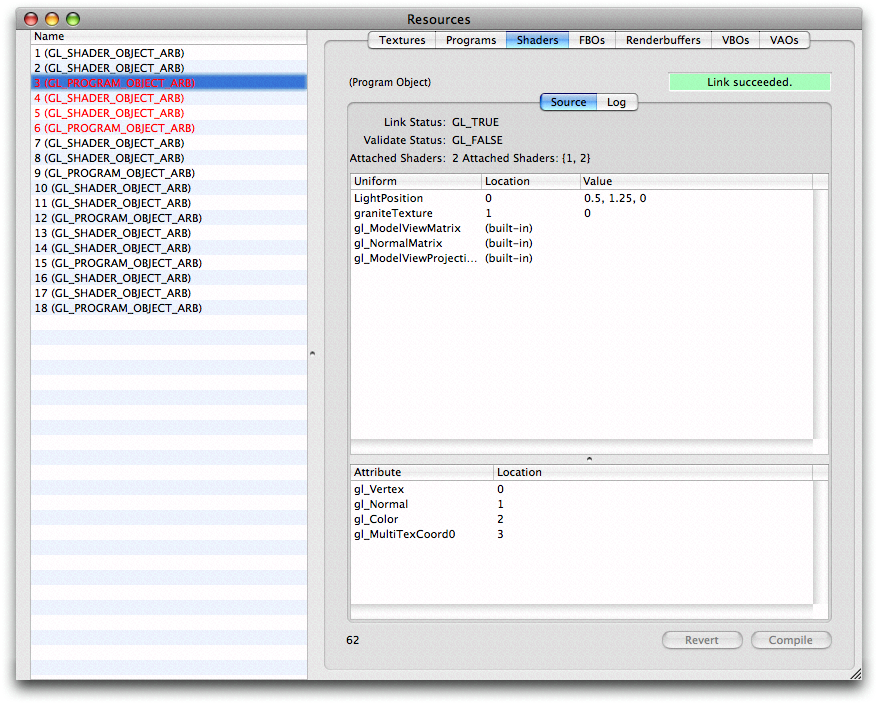
Figure 14 shows what a shader object with a vertex shader might look like.
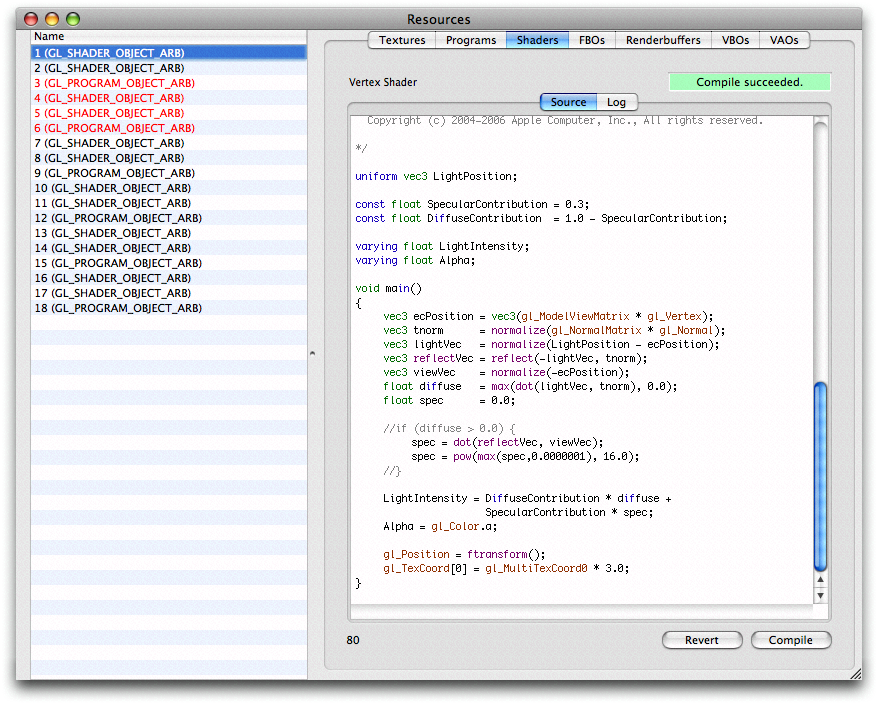
Figure 15 shows what a shader object with a fragment shader might look like.
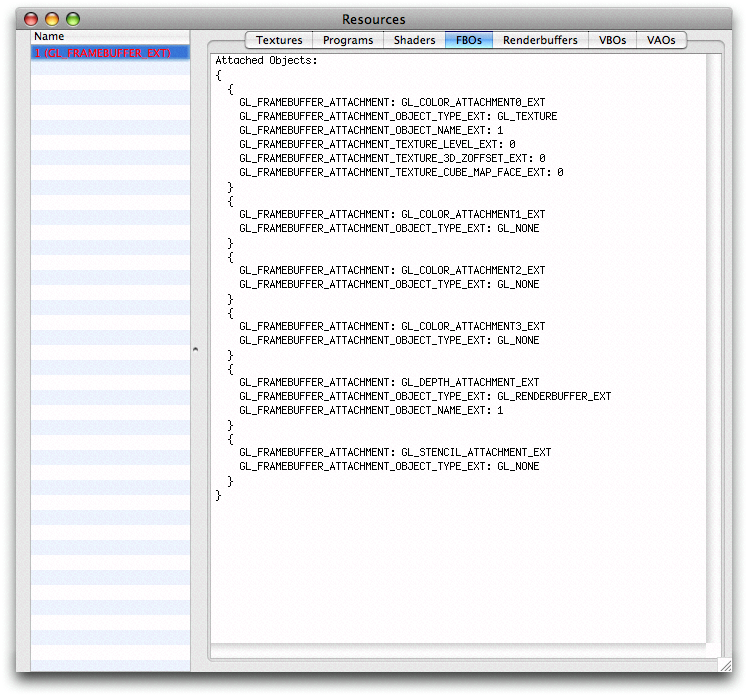
FBOs
Framebuffer Objects can be examined in the Resources window under the FBOs tab. As with any resource make sure the application is at a break point. Here Profiler presents a list of the FBOs it knows about.
Here you can identify the color, depth, and stencil attachments of an FBO and use the Texture or Renderbuffers tabs to inspect their contents.
Figure 16 shows the structure and attachments of the FBO.
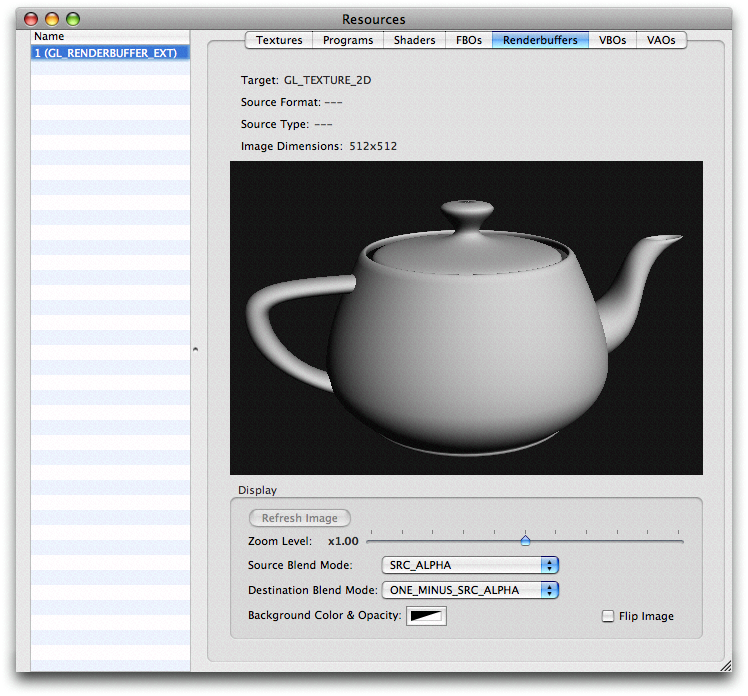
Renderbuffers
Renderbuffers can be examined in the Resources window under the Renderbuffers tab. As with any resource make sure the application is at a break point.
The functionality here is very similar to the Texture tab as described above. There are adjustments for zoom, source and destination blend, background color and opacity, and the ability to vertically flip the image.
Figure 17 shows the contents of a Renderbuffer.
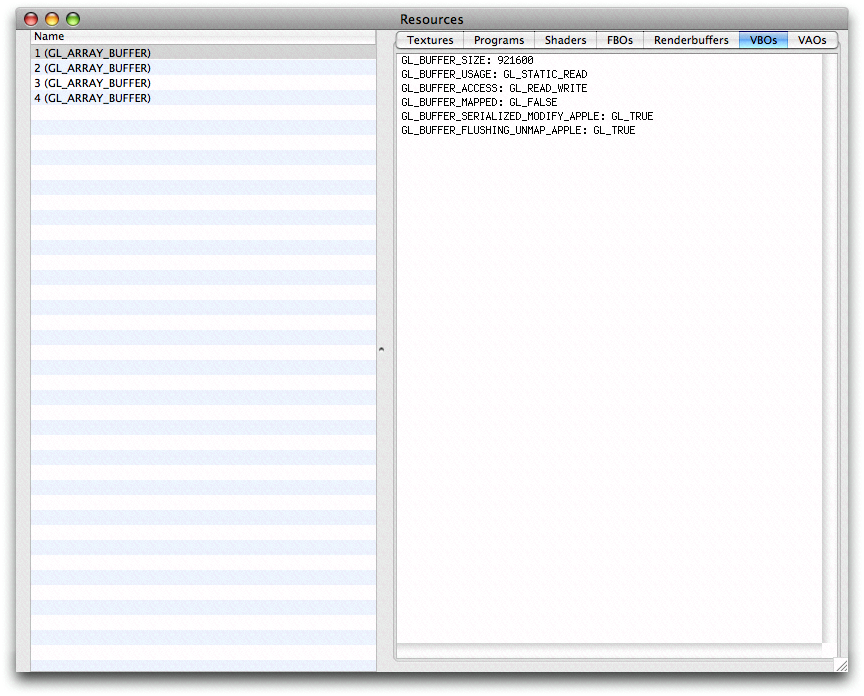
VBOs
Vertex Buffer Objects can be examined in the Resources window under the VBOs tab. As with any resource make sure the application is at a break point.
Profiler shows you the properties associated with a VBO.
Figure 18 shows the contents of a Renderbuffer.
VAOs
Vertex Array Objects can be examined in the Resources window under the VAOs tab. As with any resource make sure the application is at a break point.
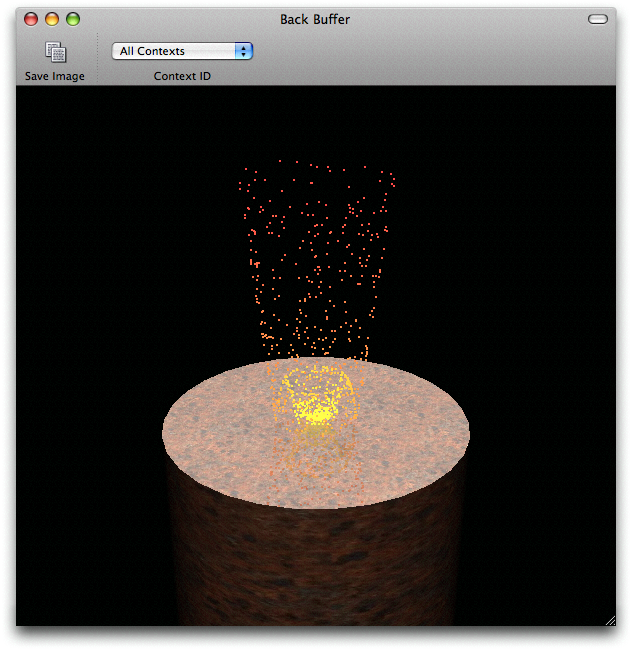
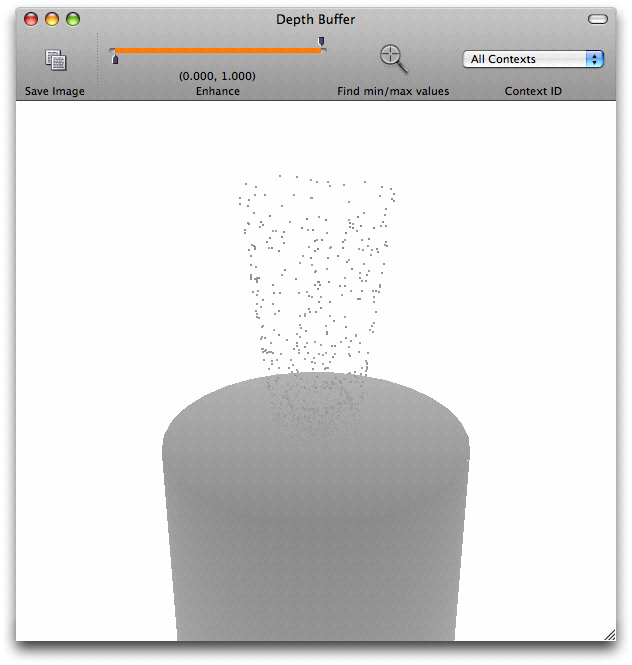
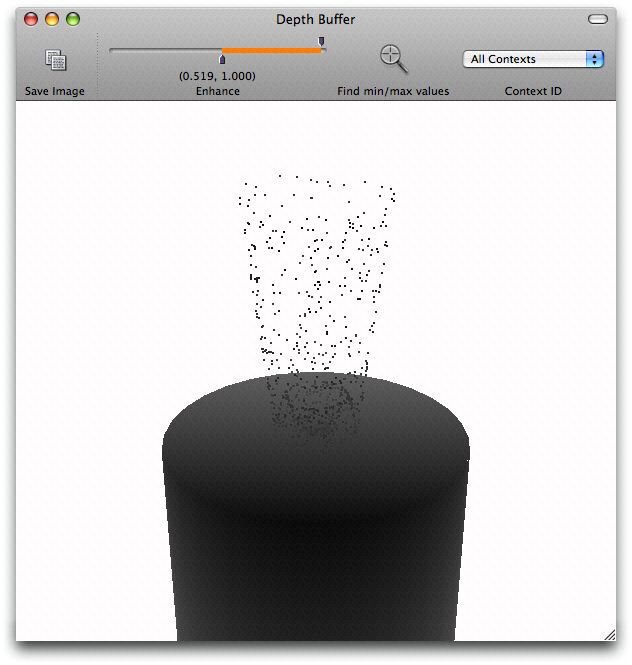
Buffer Views
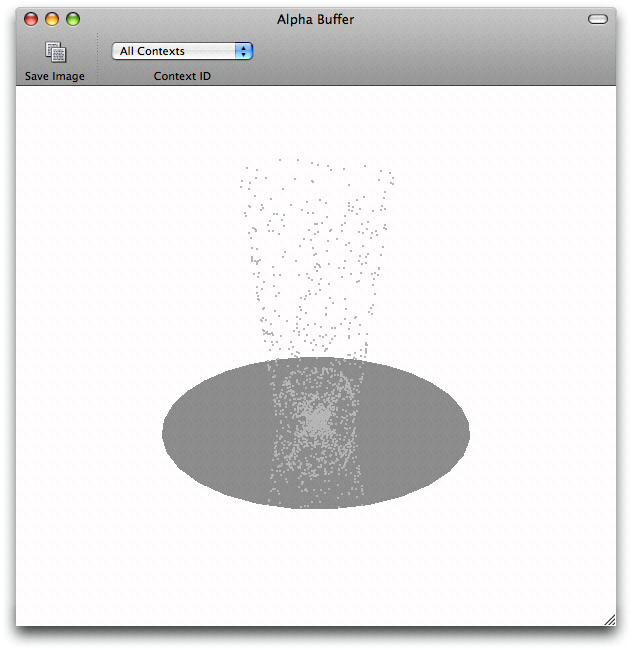
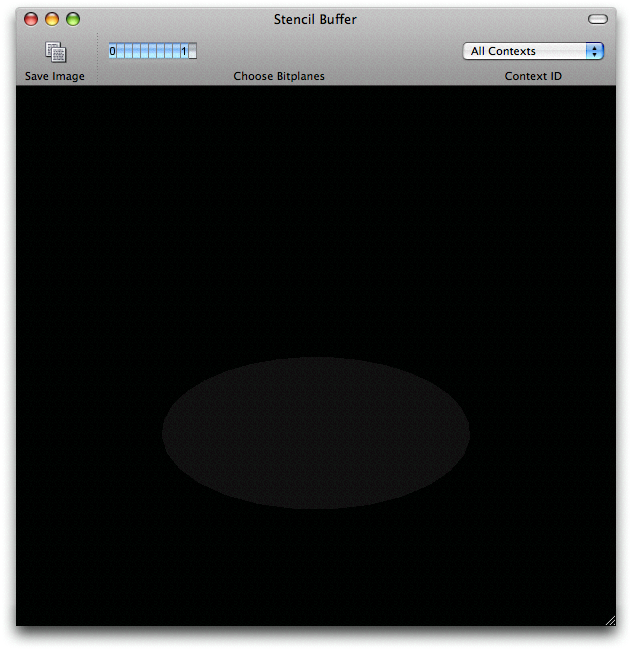
Under the view menu, several buffers can be examined when stopped at a breakpoint. Below are some screen captures from a particle shader in the GLSLShowpiece example.
Back bufffer
Depth buffer
Alpha buffer
Stencil buffer
Real World Techniques
Checking the Application for Errors
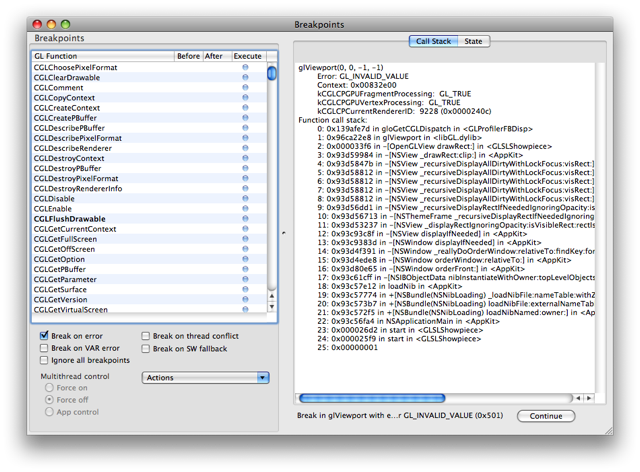
OpenGL Profiler can help to quickly check an application for errors by setting breakpoints of GL errors, thread errors, etc.
On the breakpoint window, set the appropriate breakpoint for GL errors
Launch or attach to the application if you have not done so
Monitor the breakpoint window to see if catches an error
Figure 24 shows Profiler catching an error.
Checking GPU or CPU execution of current state
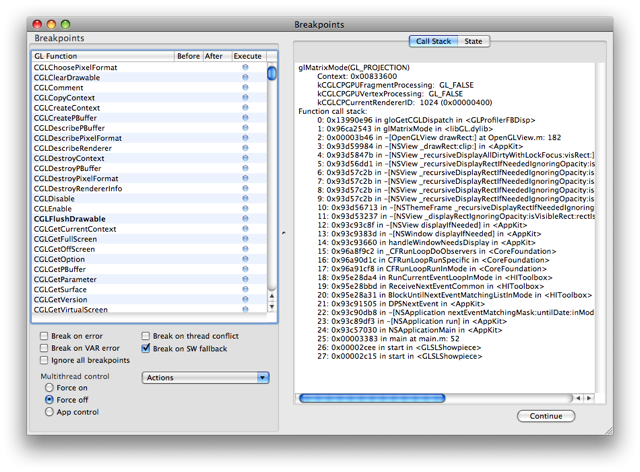
The easiest way to check in OpenGL Profiler if the application is indeed executing on the GPU is to let Profiler break on software fallbacks.
On the breakpoint window, check the SW fallback option
Launch or attach to the application if you have not done so
Monitor the breakpoint window to see if catches a software callback
Figure 25 shows Profiler catching a software callback. Note that kCGLCPGPUFragmentProcessing and kCGLCPGPUVertexProcessing are both GL_FALSE at the point, indicating that fragment processing and vertex processing are currently handled by a software recovery mechanism. The value of kCGLCPCurrentRendererID also becomes distinct.
Collecting Trace and Statistics for a single frame
Collecting the trace and statistics of a single frame can give you a quick (if somewhat narrow) view of what the application is doing.
Launch or attach to the application of interest
Navigate the application to the suspect area
Set a breakpoint in
CGLFlushDrawablefor double buffered contexts or glFlush for single buffered onesOnce stopped, open (or clear) the trace and statistics windows
Press Continue once at the bottom of the breakpoints window
Here are a few things to consider in the trace:
Do you see any duplicate or redundant calls?
On this single frame look for state management, can it be improved by state sorting?
Do you see any single call taking significantly more time than the others?
Is the frame not done rendering? Maybe more than one CGLFlushDrawable / glFlush are being sent per frame.
Enabling Multithreaded execution of the OpenGL Framework
Some applications might benefit from enabling multithreaded execution of the OpenGL Framework.
OpenGL Profiler allows you to test this option without any coding.
Launch or attach to the application of interest
Note the frame rate at somewhat repeatable point
Set any breakpoint.
CGLFlushDrawableis common for double buffered contexts.Once stopped select Force on in the Multi-thread control
Clear the breakpoint and
Press Continue once at the bottom of the breakpoints window
Note the frame rate under multi-threaded execution
Monitoring VRAM with Driver Monitor
Although a separate application from OpenGL Profiler, OpenGL Driver Monitor is another key tool when debugging and optimizing OpenGL applications.
There is a performance cliff when VRAM becomes full, so knowing how your application uses VRAM is essential.
In OpenGL Profiler select Driver Monitor under the View menu to start OpenGL Driver Monitor
In OpenGL Driver Monitor select the appropriate driver. Usually this is accomplised by pressing Cmd-1 on machines with a single graphics card or you can select it under Driver Monitors in the Monitors menu
On the driver monitor window click Parameters and double click on Current Free Video Memory
Page Offs and Page Ons of textures and surfaces are others you might want to monitor in relation to VRAM.
Editing shaders
With Mac OS X Leopard, OpenGL Profiler provides the ability to modify shaders on the fly.
Launch or attach to the application of interest
Set a breakpoint and wait for the application to stop
Open the Resources View and select the Shaders tab
Select the desired shader object on the left. See Figure 14
Edit the shader in the Source tab and press Compile
If compilation failed you can use the Log tab. You can use the Revert button to return to the original code and then hit Compile again
if the compilation was succesful then release the breakpoint and hit Continue on the breakpoints view
Disabling OpenGL Execution
Under some circumstances you might want to disable procession of OpenGL functions. This is possible within Profiler by selecting Execute none under Actions in the Breakpoints view. To restore execution select Execute all
Attaching and running scripts at breakpoints
OpenGL Profiler allows you to insert (at a performance cost) small amounts of GL code or Scripts to be executed while stopped at a breakpoint.
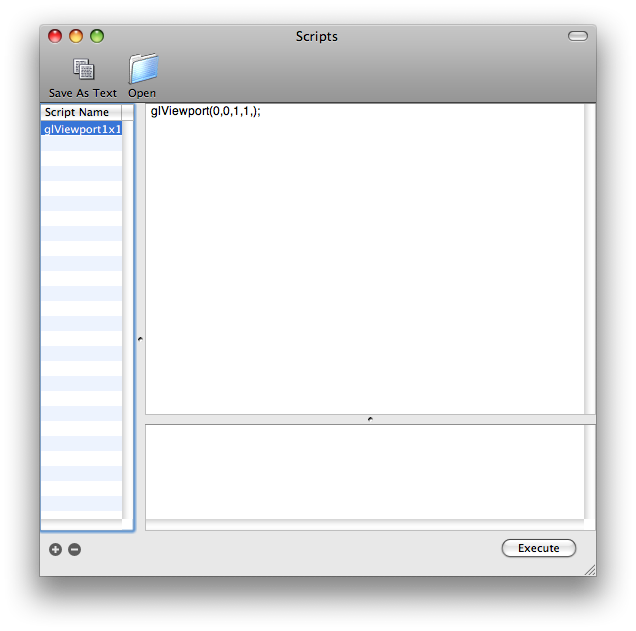
First you must create the script. Open the Scripts view and click on the "+" button. This generates an empty script that you can rename. On right side you can edit the contents of the script as shown in Figure 26 .
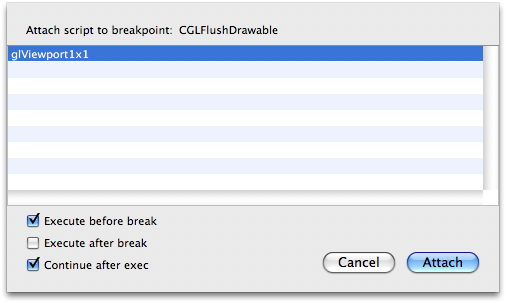
Once created this script can be executed manually while stopped in a breakpoint. To automatically execute the script, attach it to a breakpoint by selecting Attach Script... under the Actions in the Breakpoints view. You can choose to execute the script before or after the break, and continue automatically or not after the execution, as shown in Figure 27.
Trace Filtering
OpenGL Profiler allows you to create a custom filter that takes stdin and put something to stdout to save your trace.
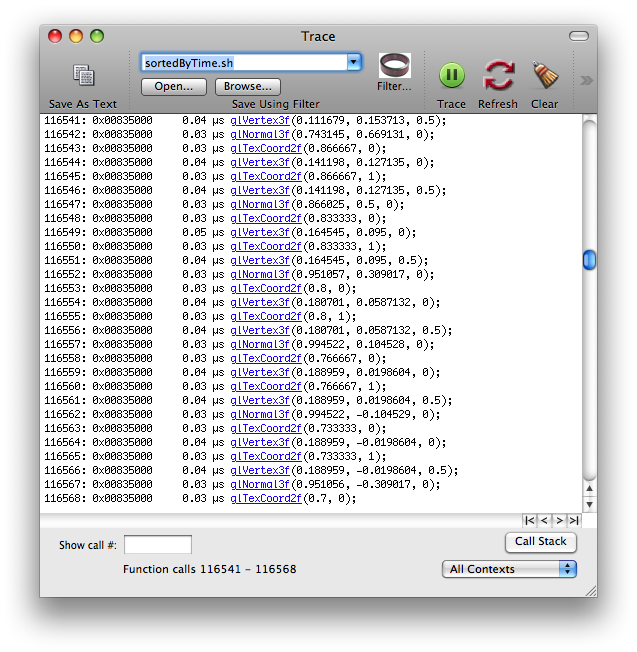
A possible example might be finding a the slowest calls. Consider the simple shell script at Listing 1 and the image at Figure 28.
The script will generate a sorted (increasingly slower) output of the trace once you click the Filter button. Then you could use the line number of the output to trace back to the surroundings where the call actually took place. This will help in figuring out what particular frames might be slowing down your scene.
Listing 1 sortedByTime.sh.
#!/bin/tcsh -f awk '{ print $3" "$0 }' | sort -n |
Launching with a custom pixel format
OpenGL Profiler allows you to Launch an application with a custom pixel format. By selecting the Launch Settings in the main window as shown in Figure 29
Among other things, this allows you to try different antialising settings and quickly seeing the results without modifying the source code of the application.
Programatic control of OpenGL Profiler
OpenGL Profiler also provides some programmatic control..
Controlling breakpoints
This is a very powerful feature that allows your application to set and clear breakpoints when attached to OpenGL Profiler.
You can set a breakpoint by making an array with 3 GLints:
Parameter 0: function ID (see CGLProfilerFunctionEnum.h)
Parameter 1: the logical OR of kCGLProfBreakBefore or kCGLProfBreakAfter, indicating how you want the breakpoint to stop: before entering OpenGL, on return from OpenGL, or both
Parameter 2: is used like a boolean which turns the breakpoint on or off
and then passing this array to CGLSetOption().
Listing 2 shows how to programmatically set a breakpoint at CGLFlushDrawable.
Listing 2 Setting a breakpoint at CGLFlushDrawable.
#include "OpenGL/CGLProfiler.h"
#include "OpenGL/CGLProfilerFunctionEnum.h"
...
   GLint myBreakpoint[] = { kCGLFECGLFlushDrawable, kCGLProfBreakBefore, 1;}
   CGLSetOption( kCGLGOEnableBreakpoint, myBreakpoint );
... |
Inserting comments in the Trace view
Comments can be printed out in the Trace window using the technique illustrated in Listing 3
Listing 3 Inserting comments in the trace.
#include <OpenGL/CGLProfiler.h> ... CGLSetOption(kCGLGOComment, (long) "***** My Comment is here *****"); ... |
The resulting comment looks like this in the trace:
21561: 0.00 µs /* ***** My Comment is here ***** */ |
Controlling the trace logging
You application can also control when to start/stop the trace logging as shown in Listing 4
This gives you fine grain control over what traces to collect in a specific section or time for example.
Listing 4 Pass GL_TRUE to start and GL_FALSE to stop tracing.
#include <OpenGL/CGLProfiler.h> ... CGLSetOption(kCGLGOEnableFunctionTrace, GL_TRUE); ... |
Listing 5 Clearing the trace window.
#include <OpenGL/CGLProfiler.h> ... CGLSetOption(kCGLGOResetFunctionTrace, NULL); ... |
Controlling the collection of statistics
You application can also control when to start/stop the collection of statistics as shown in Listing 6.
Make sure to open the statistics window first.
Listing 6 Controlling the statistics.
#include <OpenGL/CGLProfiler.h>
...
    // To start
    CGLSetOption(kCGLGOResetFunctionStatistics, NULL); // if you want to reset counters to zero
    CGLSetOption(kCGLGOEnableFunctionStatistics, GL_TRUE);
...
    // To stop the counters
    CGLSetOption(kCGLGOEnableFunctionStatistics, GL_FALSE);
... |
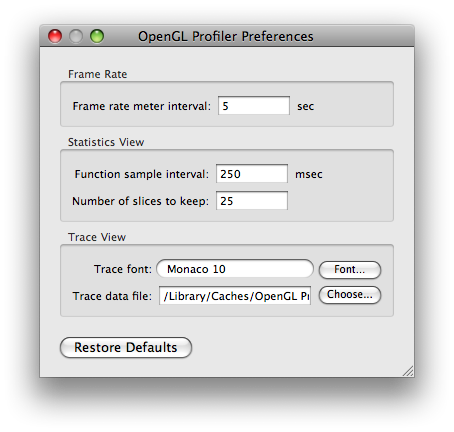
OpenGL Profiler Preferences
Document Revision History
| Date | Notes |
|---|---|
| 2008-09-16 | New document that this document describes how to use OpenGL Profiler, a very powerful tool for your OpenGL development. |
Copyright © 2008 Apple Inc. All Rights Reserved. Terms of Use | Privacy Policy | Updated: 2008-09-16