Metal Tools
This chapter lists the tools available to help you customize and improve your development workflow.
Creating Libraries During the App Build Process
Compiling shader language source files and building a library (.metallib file) during the app build process achieves better app performance than compiling shader source code at runtime. You can build a library within Xcode or by using command line utilities.
Using Xcode to Build a Library
Any shader source files that are in your project are automatically used to generate the default library, which you can access from Metal framework code with the newDefaultLibrary method of MTLDevice.
Using Command Line Utilities to Build a Library
Figure 8-1 shows the command line utilities that form the compiler toolchain for Metal shader source code. When you include .metal files in your project, Xcode invokes these tools to build a library file that you can access in your app at run time.
To compile shader source into a library without using Xcode:
Use the
metaltool to compile each.metalfile into a single.airfile, which stores an intermediate representation (IR) of shader language code.Optionally, use the
metal-artool to archive several.airfiles together into a single.metalarfile. (metal-aris similar to the Unixar.)Use the
metallibtool to build a Metal.metalliblibrary file from IR.airfiles or from archive.metalarfiles.
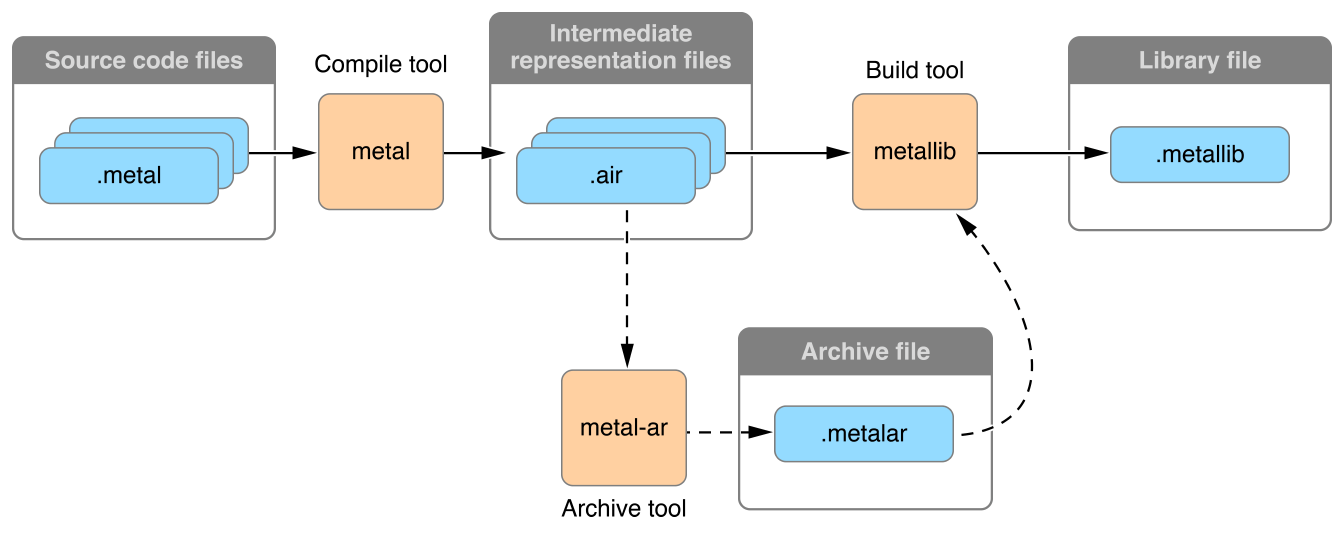
Listing 8-1 shows the minimum number of commands needed for compiling and building a .metal file into a .metallib file.
Listing 8-1 Building a Library File with Command Line Utilities
xcrun -sdk macosx metal MyLibrary.metal -o MyLibrary.air |
xcrun -sdk macosx metallib MyLibrary.air -o MyLibrary.metallib |
To access the resulting library in framework code, call the newLibraryWithFile:error: method, as shown in Listing 8-2.
Listing 8-2 Accessing a Library File within Your App
NSError *libraryError = NULL; |
NSString *libraryFile = [[NSBundle mainBundle] pathForResource:@"MyLibrary" ofType:@"metallib"]; |
id <MTLLibrary> myLibrary = [_device newLibraryWithFile:libraryFile error:&libraryError]; |
if (!myLibrary) { |
NSLog(@"Library error: %@", libraryError); |
} |
Xcode Scheme Settings and Performance
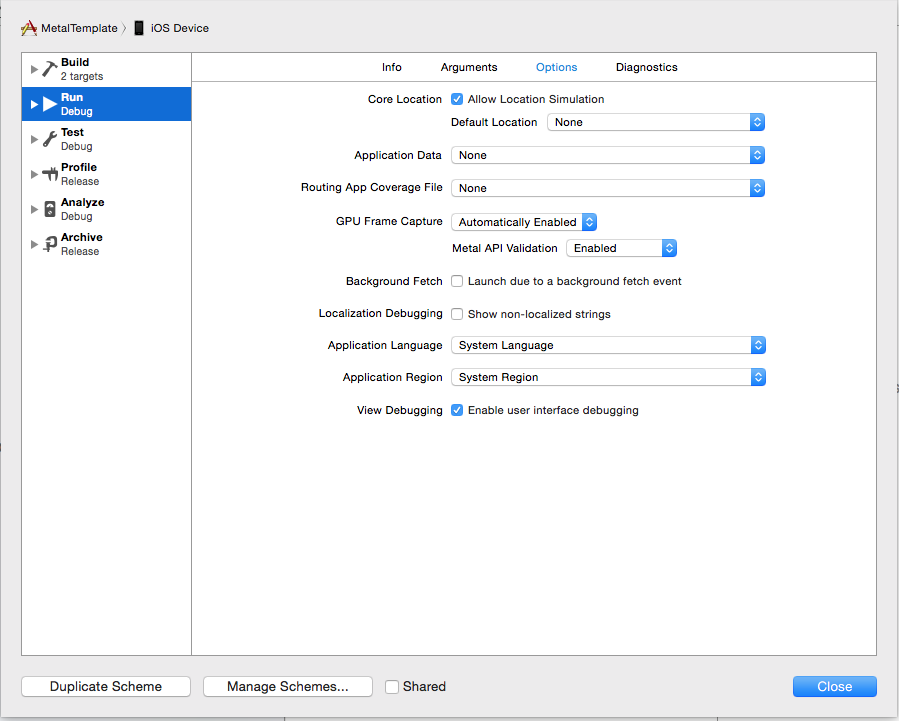
When a Metal app is running from Xcode, the default scheme settings reduce performance. Xcode detects whether the Metal API is used in the source code and automatically enables the GPU Frame Capture and Metal API Validation settings, as seen in Figure 8-2. When GPU Frame Capture is enabled, the debug layer is activated. When Metal API Validation is enabled, each call is validated, which affects performance further. For both settings, CPU performance is more affected than GPU performance. Unless you disable these settings, app performance may noticeably improve when the app is run outside of Xcode.
Debugging
Use the tips in the following sections to gain more useful diagnostic information when debugging and profiling your Metal app.
File Extension for Metal Shading Language Source Files
For Metal shading language source code file names, you must use the .metal file name extension to ensure that the development tools (Xcode and the GPU frame debugger) recognize the source files when debugging or profiling.
Performing Frame Capture with Xcode
To perform frame capture in Xcode, enable debug and call the insertDebugCaptureBoundary method of MTLCommandQueue to inform Xcode. The presentDrawable: and presentDrawable:atTime: methods of MTLCommandBuffer similarly inform Xcode about frame capture, so call insertDebugCaptureBoundary only if those methods are not present. Refer to Debugging Metal and OpenGL ES for further information.
The Label Property
Many Metal framework objects—such as command buffers, pipeline states, and resources—support a label property. You can use this property to assign a name for each object that is meaningful in the context of your application’s design. These labels appear in the Xcode Frame Capture debugging interface, allowing you to more easily identify objects.
Similarly, the insertDebugSignpost:, pushDebugGroup:, and popDebugGroup methods allow you to insert debug strings into a command buffer and to push or pop string labels used to identify groups of encoded commands.
Metal System Trace
To profile an app in Instruments, run the Metal System Trace tool. Refer to Metal System Trace Profiling Template for further information.
Copyright © 2016 Apple Inc. All Rights Reserved. Terms of Use | Privacy Policy | Updated: 2016-12-12