Retired Document
Important: This document no longer represents the most current version of Safari developer tools. Links to downloads and other resources may no longer be valid. For new documentation on Safari Web Inspector, please visit Safari Developer Help.
Timelines
Web Inspector features a visual download analyzer and JavaScript and events recording to help you make your website load and your scripts run as quickly and responsively as possible.
Recording Timelines
Timelines are a graphical representation of activity that occurs during the lifetime of the open page. Timelines show network requests, CSS rendering, and JavaScript events.
All timelines record simultaneously. You can start recording timelines two ways:
Clicking the Start Recording button. This shows all activity that happens since the record button is clicked. While recording, you can interact with the page to trigger XHR loads, style recalculation, page layout and painting, and JavaScript events.
Reloading the webpage while Web Inspector is open. This shows all activity as it happens during page load.
To stop recording, click the Stop Recording button. The content browser shows various details depending on the selected timeline.
Network Requests
Figure 3-1 shows recorded network requests as blue horizontal bars.
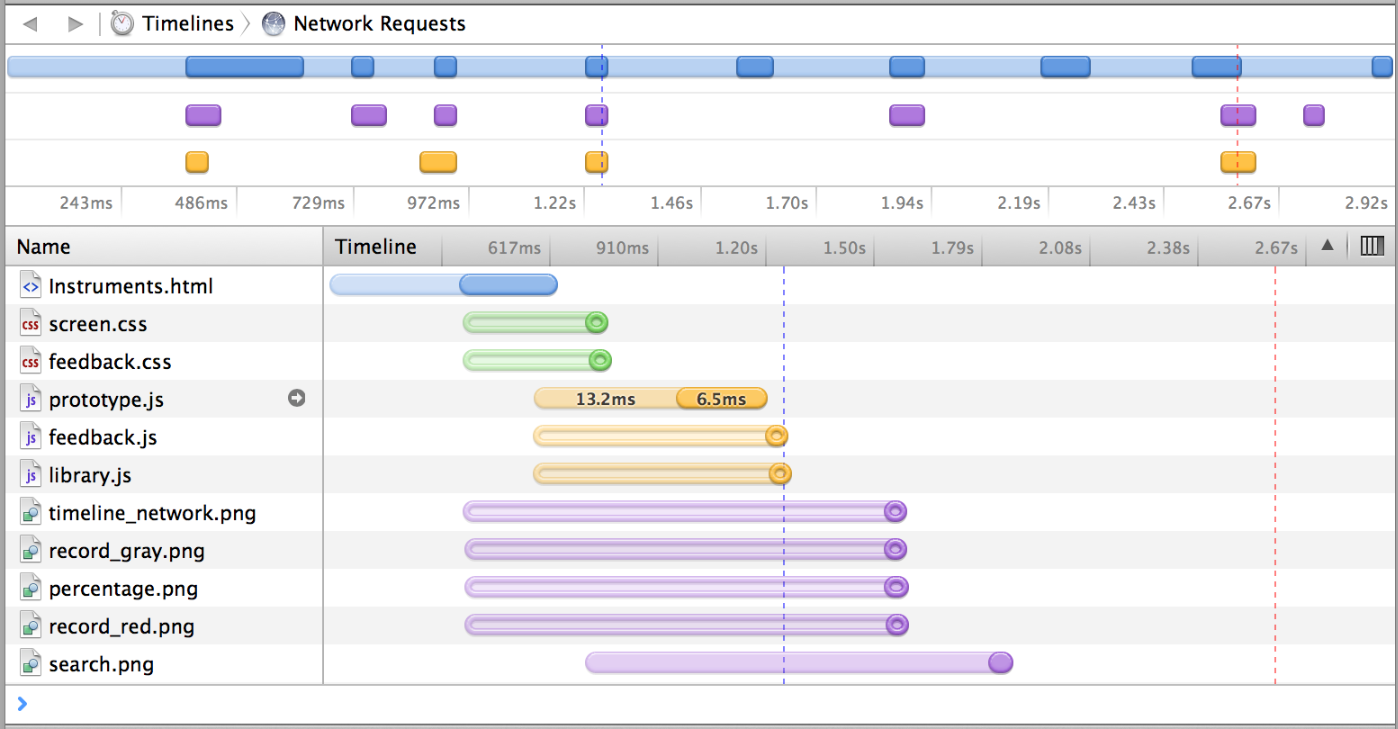
When the Network Requests timeline is selected, the bottom portion of the content browser displays each individual file requested from the webpage. The horizontal bar graph shows you when each resource was requested, the latency of the server, and the download time for each resource. Hover over any bar to see additional details in a tooltip.
The vertical dashed blue line indicates when the DOM becomes available to Safari, and is equivalent to the DOMContentLoaded JavaScript event. The red line indicates when all resources have finished loading, and is equivalent to the load JavaScript event.
Layout and Rendering
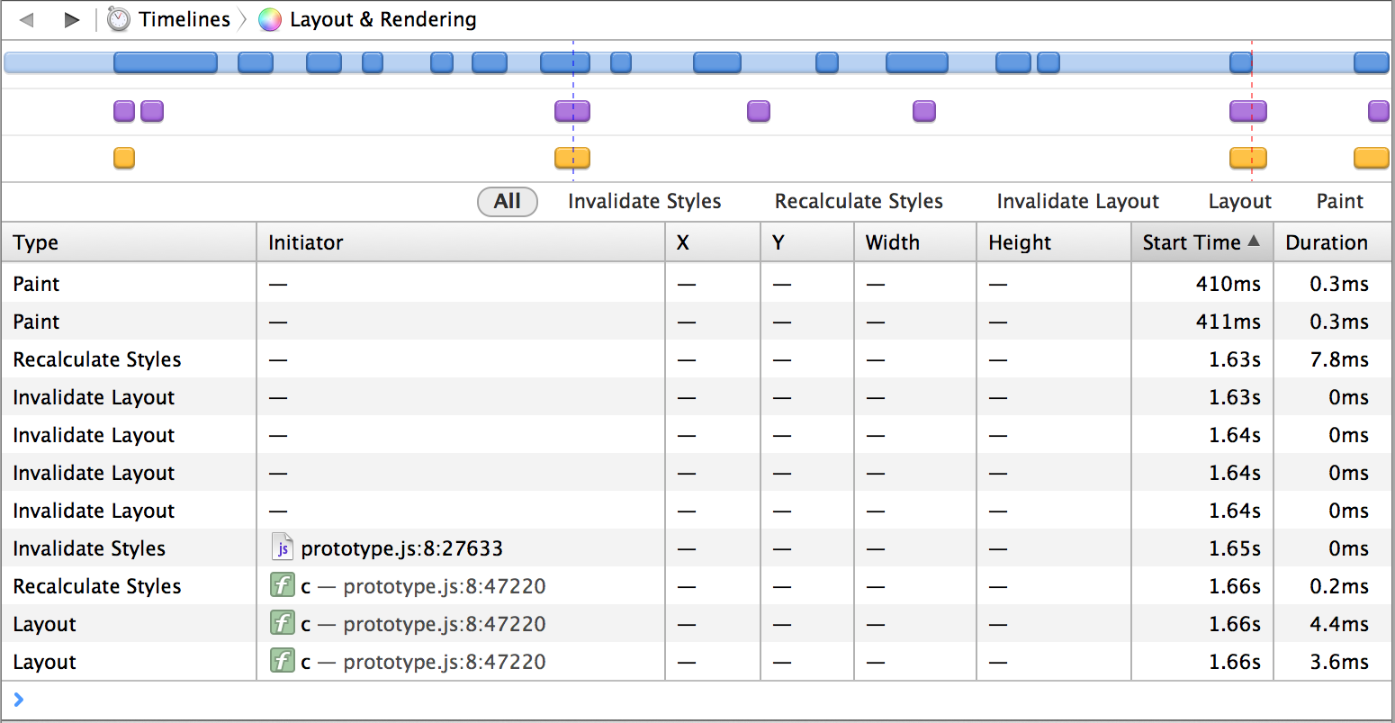
Just as you can see great detail about every resource that has loaded, you can see great detail about how Safari's rendering engine, WebKit, renders the page. Click on Layout & Rendering in the Timelines pane to display a table of each paint that has been rendered, as shown in Figure 3-2. Each layout calculation and paint rendering is represented by a purple horizontal bar.
JavaScript and Events
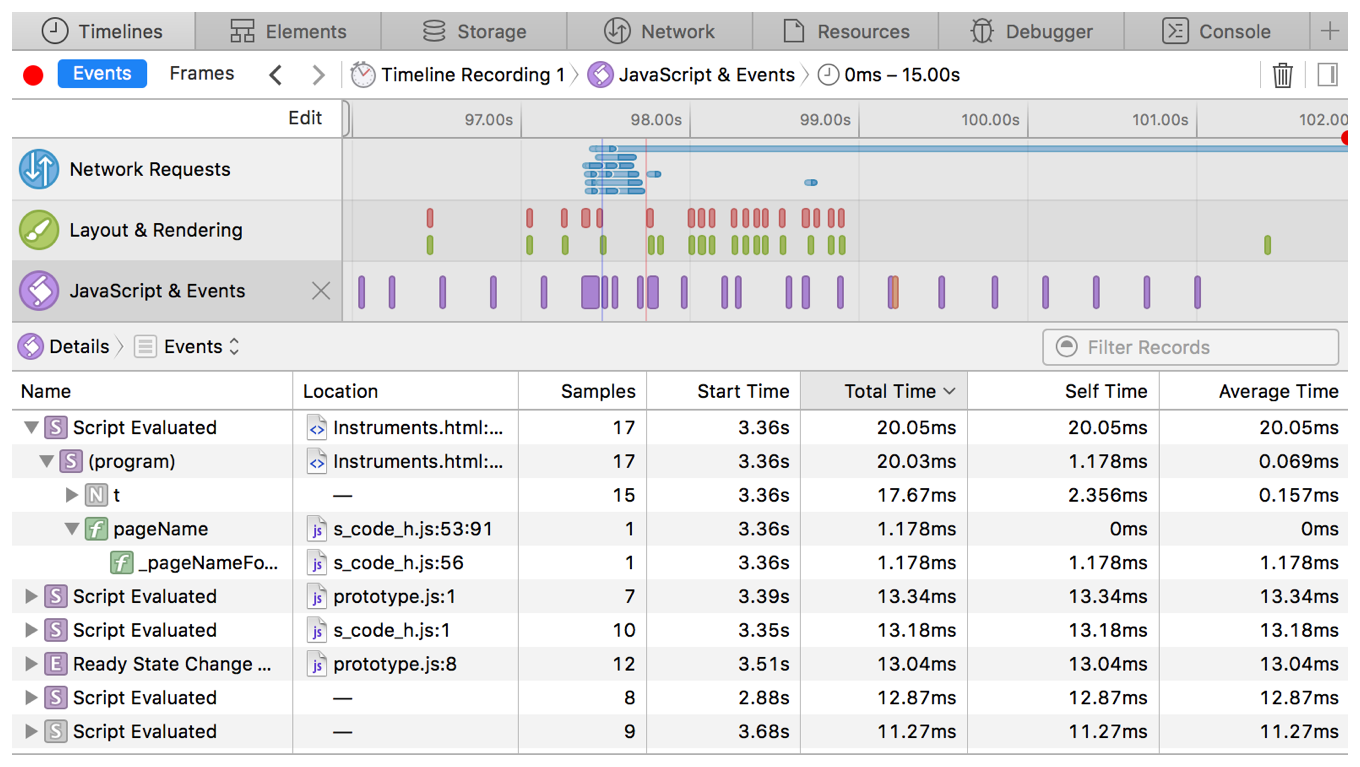
JavaScript executed during a recording session is represented as a purple horizontal bar in the timeline. Evaluated scripts, dispatched events, animation frames, and timers are listed in the table in the content browser, as shown in Figure 3-3.
Timing Records
Underneath the Timelines pane in the Timelines navigation sidebar is the Records pane. This pane allows you to see where execution time is being spent in your JavaScript and CSS. Use the Records pane to find bottlenecks in your scripts and inefficiency in your CSS selectors to optimize their performance.
JavaScript and Events Recording
Profiling JavaScript exposes the bulk of your code’s execution time. To use the Records pane, you must start profiling, either manually or by including a console.profile() call in your script. To start recording manually, click the record button (![]() ) in the top right of the Timelines pane. The record button becomes a stop button (
) in the top right of the Timelines pane. The record button becomes a stop button (![]() ). To stop the record, click the click the stop button. You can manually stop the recording call
). To stop the record, click the click the stop button. You can manually stop the recording call console.profileEnd().
Once you have captured a record, it is listed on the left side of Web Inspector. Click on JavaScript & Events to view the record details. Records created by calls to console.profile() are named with the title of the record provided as an optional argument. If multiple records are captured under the same name, a disclosure triangle reveals multiple runs within the record.
The time spent in each function executed during the record is displayed, as well as the number of times each function is called and the start time.
The time spent is grouped into three categories: Self, the total time spent in the function itself; Total, the total time spent in the function and any subordinate functions it calls in turn; and Average, the average time spent in the function itself during each call (the Self time divided by the number of calls).
If a function is declared with a name, the function name is displayed. If a function is created programmatically by an eval() statement or inline <script> </script> tagset, it is labeled (program) in the record. Other unnamed functions, for example, a function defined within a variable declaration, are labeled (anonymous function). To be less vague, you can rename anonymous functions in a record by assigning a string value to the displayName property of the function.
Where applicable, the source URL and line number of the function declaration is shown in gray to the right of the function name. The source URL is a link. Clicking it opens the source in the content browser, scrolled to the line number where the function is declared.
Copyright © 2018 Apple Inc. All Rights Reserved. Terms of Use | Privacy Policy | Updated: 2018-02-07