-
查找并修复 Metal 游戏中的性能问题
使用强大的 Metal 工具追踪难以发现的游戏性能问题。了解如何通过 Instruments 中的 Game Performance Overview 收集丰富的性能数据,在 macOS 和 iOS 上分别利用 metalperftrace 和控制中心来运行后台性能追踪,并使用全新的 StateReporting API 将指标直接关联到游戏的运行时状态。将数小时的遥测数据转化为清晰明确、切实可行的见解。
章节
- 0:00 - 简介
- 1:51 - Metal 性能指标
- 3:32 - 跟踪数据收集
- 6:38 - 分析性能跟踪数据
- 10:08 - 使用 StateReporting 进行情境化设置
- 17:48 - 使用 MetricKit 收集实际使用数据
- 19:41 - 后续步骤
资源
- Understanding the Metal Performance HUD metrics
- Monitoring your Metal app’s graphics performance
- Getting started with StateReporting
- Metal debugger
相关视频
Tech Talks
-
搜索此视频…
你好,欢迎观看。
我是 Ruiwei, Metal 工具团队的工程师。 流畅稳定的帧率 是你能为玩家带来的 最重要的体验之一。 它让你的游戏 感觉响应迅速、精致打磨—— 而在整个游戏会话中 保持这种流畅感至关重要。 我将演示新的工具和工作流, 为你提供所需的一切, 以快速收集并识别 长时间游戏会话中的问题。 打造出色流畅的游戏体验 是一个循环过程, 你需要在多种不同设备 和外形规格上测试你的游戏, 收集性能数据, 分析结果, 识别性能问题, 并加以修复。 然后再次进行测试 并重复这个循环, 直到达到你的性能目标。 当玩家长时间游玩你的游戏时, 许多条件可能会发生变化。 设备可能会升温, 热状态随之改变。 玩家调整图形设置。 他们在不同的关卡 和战斗之间切换。 要真正实现流畅体验, 你需要跨越 许多不同场景 在长时间内进行测量。 为了向你展示具体做法, 我将从简要介绍开始, 介绍可供你使用的 Metal 性能指标。 然后,我将向你展示 新的工具和工作流,用于收集 并分析长时间的追踪数据。 接下来,我将演示 如何将追踪数据进行情境化, 以便你了解游戏在 任意时间点的状态。 最后,介绍如何在游戏发布后 在真实环境中收集数据。 我将从 Metal 性能指标开始。
Metal 工具提供 多种不同的指标。 这些指标为你提供基准, 用于比较不同会话 并识别潜在问题。 例如,与时序相关的指标, 如每秒帧数(FPS)、 GPU 时间和帧间隔, 可以告诉你帧的节奏 以及 GPU 的利用率。 另一方面,图层大小、 合成模式等指标, 以及 MetalFX 相关指标 可以帮助你确保 与显示相关的 设置配置正确。 有一个地方可以让你 快速浏览所有这些指标。
Metal 性能 HUD 以叠加层的形式 显示 FPS 等性能指标, 内存使用情况和帧间隔 覆盖在游戏内容之上。 它让你在游玩时 对游戏性能有一个整体了解, 并提供多种 自定义功能。 例如,配置面板 允许你自定义 要显示的指标列表。 你可以启用或禁用 每个单独的指标, 或从预设中选择。 你可以详细了解每个指标 以及 Metal 工具文档中的 HUD。 "监控你的 Metal 应用程序图形性能" 以及"了解 Metal 性能 HUD 指标"。 虽然 HUD 非常适合在开发过程中 快速获取读数, 但它无法让你 保存长时间的指标数据。 很容易忘记确切遇到 掉帧的位置, 尤其是在游玩 数分钟或数小时之后。
要获得这种详细程度, 你需要收集性能追踪数据 跨越长时间段。 对于在桌面测试游戏, 你可以使用 Instruments 中的 "游戏性能概览"模板。
首先,在 Instruments 模板选择器中选择 "游戏性能概览"模板。 它会捕获聚合的 Metal 性能指标 以及时间分析器 CPU 采样数据。 你可以通过 Instruments 启动游戏, 或附加到已连接设备上 正在运行的游戏会话。 准备就绪后, 只需点击录制按钮。 这非常适合在桌面测试 游戏时收集数据—— 持续数分钟或更长的会话。 但还有一个非常强大的功能。 当你的游戏运行时, 系统始终在录制 并保存 Metal 性能 和资源使用指标。 聚合的以及可选的逐帧指标, 如 CPU、GPU、FPS 和内存, 被高效存储, 并保存数天。 这意味着对于持续数小时的 长游戏会话, 其中包含多次状态变化, 你可以在游戏会话结束后 回溯并收集数据—— 在 macOS 和 iOS 设备上本地进行。 我将演示这是如何工作的。 在 macOS 上,你可以通过 metalperftrace 收集数据, 这是 macOS 27 中的 一个新命令行工具。 无需额外配置。 只需运行 metalperftrace collect 并传入 --last 参数 指定你想要的时间段,从数小时到数天。 例如,此命令收集一个追踪, 包含过去 5 小时的 性能指标。 或者,你可以传入 明确的开始和结束日期, 以收集特定时间范围的追踪。
这就是如何在 macOS 上 回溯并收集追踪数据。 在 iOS 上,回溯收集 需要一次性的设备设置。 在启用开发者模式的情况下, 进入开发者设置 并启用性能追踪。 选择"回溯收集",并选择 追踪将覆盖多长时间。
最后一步,进入控制中心, 添加性能追踪按钮。
现在设备已准备好 进行追踪收集。 你可以像往常一样开始测试游戏。 结束后, 打开控制中心。 轻触性能追踪按钮, 设备将开始收集 并处理配置时间段 的追踪数据。
这可能需要一些时间, 处理完成后 你将收到通知。 收集的追踪数据将出现在 "可用追踪文件"列表中。 你可以轻松地将追踪数据 传输到 Mac 进行进一步分析。 现在我已经演示了 如何收集追踪数据—— 无论是通过 Instruments 还是在 iOS 和 macOS 设备上, 是时候进入下一步了: 分析它们。 在 macOS 上,你可以通过 metalperftrace 打印或导出 指标概览。 或者在 Instruments 中打开追踪数据 并以可视化方式浏览数据。 让我们来看两者的实际效果。 要查看录制追踪的 整体性能, 只需运行 metalperftrace overview 并传入追踪文件。 metalperftrace 将聚合 并打印整体性能数据, 涵盖追踪中包含的 游戏会话。 报告针对每个进程 分为 2 个部分。 第一部分包含 资源使用情况统计, 例如内存使用量、 CPU 时间和磁盘活动。 第二部分包含 每个图层的 Metal 性能指标。 例如, 在此会话中, 平均内存使用量约为 2.1GB。 平均 FPS 约为 60。
报告还包含各指标的 统计值, 例如帧时间和 GPU 时间。 这让我快速了解 该会话的整体性能。 如果追踪中有多个游戏会话 或 Metal 图形应用程序, 可以使用可选的谓词来 打印你想要的特定进程数据。
此外,你还可以传入 --json 使 metalperftrace 以 JSON 格式输出。 现在你得到了结构化输出, 可以轻松传入脚本 用于回归测试, 或者传给 AI 代理自动分类 潜在的性能问题。
Instruments 也可以打开 并可视化追踪数据,进行更深入的分析, 获取更详细的指标。 数据绘制在时间轴上, Instruments 自动 评估这些值, 偏差过大的统计数据 会以不同颜色高亮显示。 例如,在此追踪中, FPS 在一段时间内下降, 并以黄色标记。 详细视图显示统计值: 每个指标的 最小值、最大值、平均值和标准偏差。 这些统计数据针对 整个追踪进行聚合, 或针对所选时间范围。 你可以选择一个时间范围, Instruments 将 自动聚合 并更新所选时段的统计数据。 在此时间段内, 平均 FPS 下降至 26, 而 GPU 使用率非常低。
这正是我需要深入研究 并尝试重现问题的地方, 但存在一个很大的挑战。 我知道帧率下降发生在 约第 12 分钟, 但我不知道当时 我的游戏在做什么。
在查看这样的追踪数据时, 仅凭平均 FPS 没有足够的可操作上下文来进一步调查, 仅靠平均 FPS。 下降是由于 关卡的特定区域造成的吗? 还是图形设置发生了变化? 这就是为什么在尝试时上下文很重要, 识别潜在的 性能问题并分析追踪数据。 要调查单个问题, 你需要细粒度的数据, 告诉你游戏在 每个时刻在做什么。 因此,接下来,我将介绍一个新 API, 帮助你为追踪数据添加上下文。 StateReporting 是一个新 API, 让你能够描述游戏的行为 和随时间变化的状态。 它基于四个核心概念。 一切从域开始。 域是有限状态机, 代表特定功能领域。 例如,你可以定义一个关卡域 来追踪玩家进度。
每个域在同一时间只能处于一种状态。
每个状态都以标签开始, 例如"Level 1"。 它还可以包含 可选的稳定元数据。 这是一个不可变的字典, 包含任何类型的可序列化信息, 除标签之外, 还描述当前状态。
每个状态还可以包含 易变元数据。 顾名思义, 你可以用它来表示 在某个状态内可能变化的值,
例如玩家的生命值。 随着玩家在游戏中推进, 你可以在不同状态之间切换, 使用不同的标签和元数据。 例如, 从"Level 1"切换到"Level 2", 当玩家 进入下一个关卡时。 将这些放在时间轴上, 你可以定义多个域, 以描述游戏 特定领域的状态。
例如,一个追踪关卡变化的 关卡域, 一个追踪当前图形设置的 图形域, 以及一个用于 网络状态的网络域。
如果我们回到之前的 FPS 图表, 现在我们可以对追踪数据进行情境化, 我可以立即注意到 需要改进的区域, 并集中优化工作。
StateReporting API 适用于 Swift 和 Objective-C, 且易于采用。
我将向你展示一些示例代码, 用于报告游戏的当前关卡。 首先,创建一个域, 通常是一个反向 DNS 字符串, 并向该域请求一个报告器。 报告器是状态机的实例, 可用于报告 状态切换。 要报告一个状态, 使用 reportTransition 并传入标签, 以描述当前状态。
可选地,要包含关于状态的 额外结构化信息, 只需在 stableMetadata 参数中 传入一个字典。 对于易变元数据, 你可以在不切换到另一个状态的情况下 更新值, 通过调用 reportVolatileMetadataUpdate, 并传入表示相关信息的字典。
StateReporting 还与我讨论的所有工具 紧密集成: Metal 性能 HUD、 metalperftrace 和 Instruments。
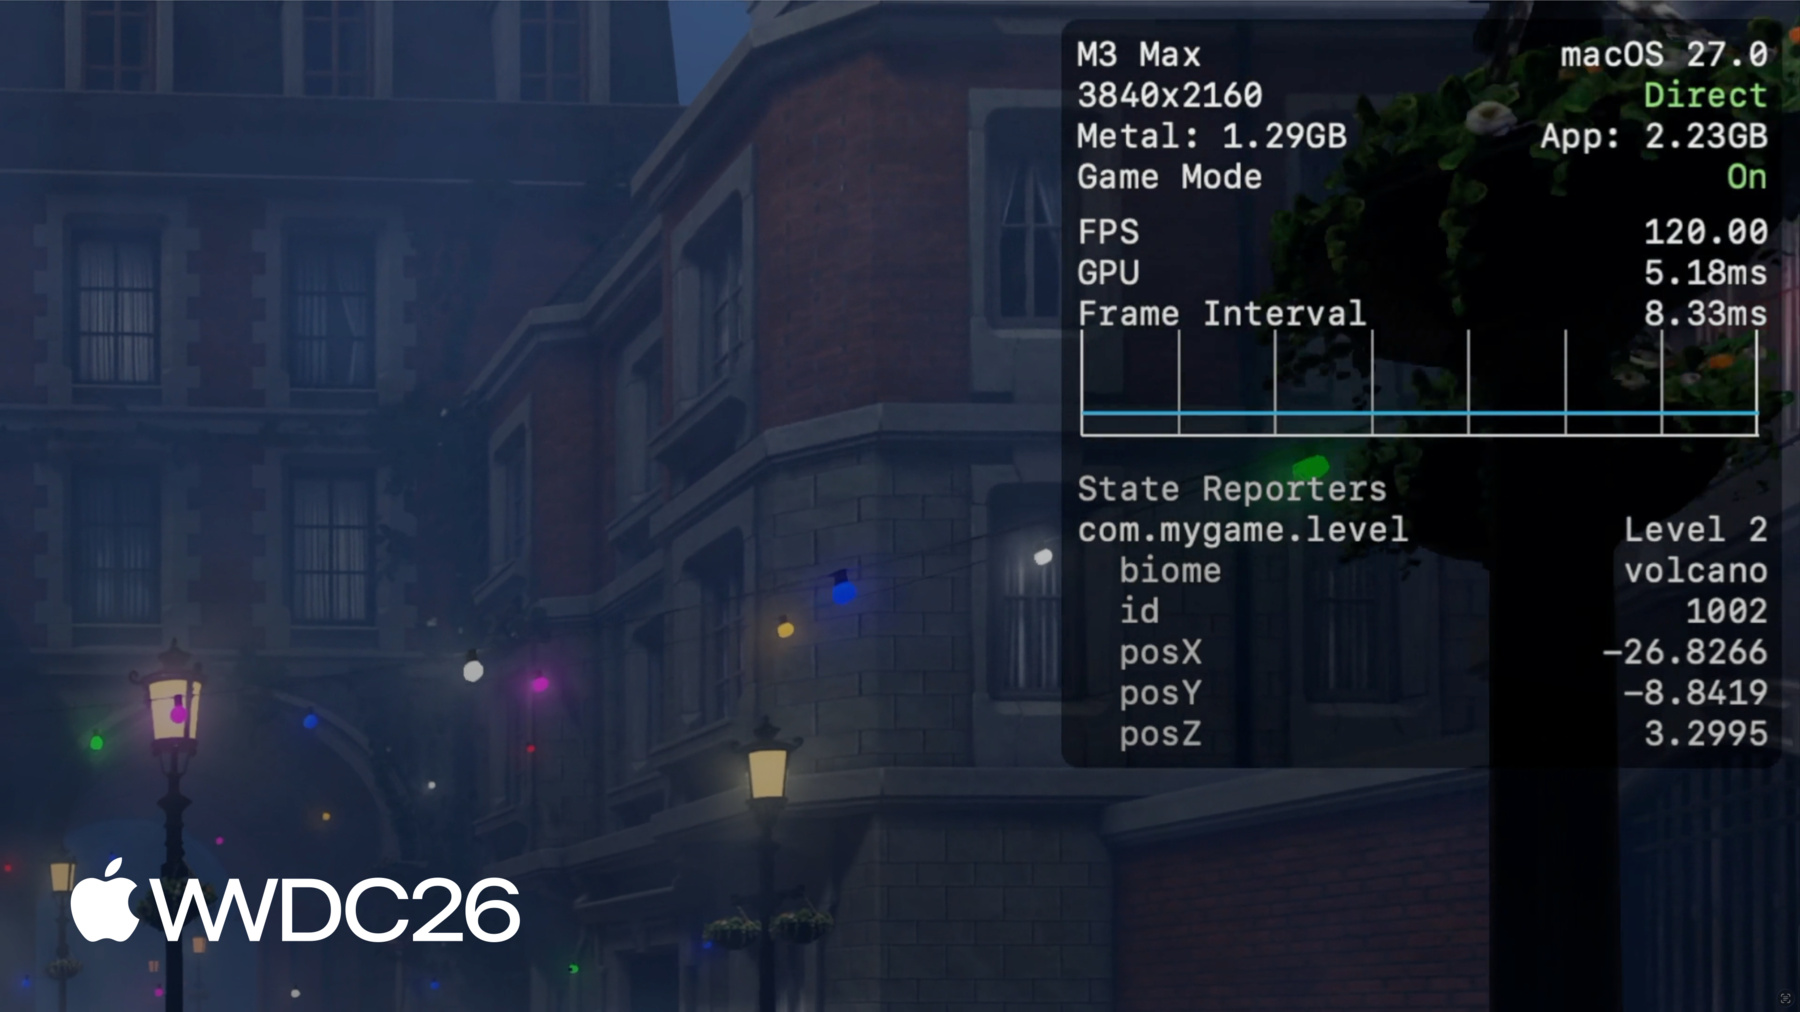
在 Metal 性能 HUD 中, 状态域列表出现在 指标配置选项卡中。 启用它们后,叠加层将显示 标签、稳定元数据和易变元数据。 这是验证你 StateReporting 采用情况最直接的方式。
例如,这里我正在报告 包含生物群系的关卡状态, 以及 id 作为稳定元数据, 玩家位置 作为易变元数据。 易变的玩家位置 每秒报告一次, 叠加层让我 可以检查位置, 随着玩家移动。 在 metalperftrace 中, 打印包含状态切换的 追踪的概览时, 报告将包含域的列表, 切换次数, 以及最后已知状态。
要了解完整的状态切换详情, 只需传入 --include-state-transitions。 这将打印完整的状态列表, 包含开始和结束时间戳。
metalperftrace 还可以 自动聚合并报告指标, 作为这些状态的函数。
你可以要求 metalperftrace 针对 所有域和状态切换进行聚合, 或针对特定域的 所有状态切换进行聚合, 或针对域内特定 状态标签进行聚合。
例如,要查看图形设置为高时 的平均 FPS, 我只需要求 metalperftrace 聚合图形域中的"High"状态标签。 针对图形域。
报告将显示详细的状态信息, 该状态持续了多长时间, 以及其他域中 重叠状态的列表。 例如, 当图形设置为"High"时,平均 FPS 仅约为 24, 当图形设置为 High 时。
要更直观地查看 随时间变化的状态切换, 你可以在 Instruments 中打开追踪数据。
当打开包含 状态切换的追踪时, Instruments 将为每个域 创建一个轨道, 作为"兴趣点" 仪器的一部分。
每个轨道绘制状态切换 和易变更新, 使理解上下文变得容易。
你可以选择单个状态, 并在侧边栏中检查 该状态的详细信息, 例如稳定元数据和易变元数据。 结合 Metal 性能指标, 我确认帧率 开始下降, 是在图形设置更改为高时。 这就是我接下来要 重点调查的地方。 一旦有足够的上下文 来重现问题, 下一步是深入查看 游戏的特定时间点。
你可以捕获详细的 CPU 和 GPU 调度数据, 通过使用 Instruments 中的 Metal 系统追踪模板。
你也可以通过 Xcode 中的 Metal 调试器来捕获和分析帧。
要了解更多这些工具,请查看 "Metal 开发者工具"文档, 以及"探索 M3 和 A17 Pro 的 新 Metal 性能分析工具"。
在你的游戏中采用 StateReporting 时, 有一些需要记住的最佳实践。 首先,在进行埋点之前, 仔细设计你的域和状态。 每个域应该在概念上 与其他域正交。 不要试图在单个域中 表示太多维度—— 这会使追踪变得困难。 其次,不要有 太多状态切换。 StateReporting 旨在 提供额外上下文, 用于分析 长时间的性能。 它不是为 高频状态变化设计的。 尽量将切换频率限制在 用户操作的节奏或更慢。 如果切换速率过高, 系统将进行限速, 你将丢失重要信息, 直到速率恢复到可控范围内。
最后,通过 Metal 性能 HUD 和 Instruments 等工具确认 你的状态的正确性。 检查切换是否合理, 以及是否在你预期的时候发生。 很容易遗漏边缘情况, 导致数据错误且难以理解。
回顾一下,你现在已经拥有 收集的完整图景, 分析并情境化 性能数据, 用于游戏发布前的 长游戏会话。 但这些工具并不止步于发布。
一旦游戏抵达玩家设备, 持续监控性能 就变得非常重要, 并及时发现影响 玩家体验的意外性能下降。 接下来,我将介绍如何在游戏发布后 收集关键 Metal 性能指标。 在游戏发布后。 MetricKit 是一个提供 两种类型数据的框架: 指标和诊断。 它让你的游戏直接在进程内访问 以报告形式呈现的 电量和性能数据。
随着玩家游玩你的游戏, MetricKit 持续在后台 收集数据, 并每天向你的游戏提交一份报告。 报告包含衡量游戏流畅度的指标, 以及它对设备资源 的使用强度。 在 macOS 和 iOS 27 中, MetricKit 公开了 Metal 帧率信息, 以及大量其他有趣的 性能和电量指标。 它还以你的 StateReporting 状态 为函数提供 Metal 帧率。 帧率将被聚合 并按状态分组, 在你的指标报告中。 在这份示例报告中,MetricKit 报告 了整体平均帧率, 以及时间和帧数。 它还分解了 帧率信息, 按关卡域中的状态分类。 这些指标及更多内容 将被传递给你的游戏进程, 你可以在本地进行分析。 也可以将数据打包 用于设备外的处理和聚合。 这允许你监控 游戏在真实环境中的性能, 并识别可以调查和修复的 潜在问题。
除了指标之外, MetricKit 还提供诊断, 帮助你识别哪个代码路径 导致了性能问题, 例如内存异常。 当你的游戏因超出 内存限制而被终止时, 你可以获得更多关于 发生了什么的洞察。
总结一下,在 iOS 和 macOS 27 中, Metal 性能指标 始终由系统录制。 我演示了如何回溯 并收集性能指标, 跨越数小时甚至数天。 以及如何使用 metalperftrace 和 Instruments 来分析这些追踪数据。
我还展示了一个新的 StateReporting API, 可以帮助你 为追踪数据添加上下文。
发布后,MetricKit 从玩家设备 提供指标和诊断数据。
要开始,请查看 StateReporting。 设计游戏中 最重要的域, 关卡、图形、网络状态, 并开始报告它们。 测试游戏, 收集长时间游戏会话的追踪数据, 并确保在支持的设备上 有流畅的玩家体验。 在支持的设备上。
还要记得查看 MetricKit, 并从玩家设备收集 每日指标报告。 要了解更多关于可用数据 以及如何集成 MetricKit, 请查看"认识新的 MetricKit"。 试用新的工具和工作流。 我迫不及待地想在 Apple 平台上体验你的游戏。 感谢观看!
-
-
5:00 - Collect a trace with metalperftrace
# Collect the last 5 hours metalperftrace collect /tmp --last 5h # Output # Metal performance traces collected to: /tmp # /tmp/MetalPerfTrace_20260401_094100_to_144100.atrc # Or collect an explicit time range metalperftrace collect /tmp \ --start 2026-04-01T09:41:00 \ --end 2026-04-01T12:41:00 -
7:02 - Print a trace overview
metalperftrace overview /Data/MyGameTrace.atrc # [Modern Renderer pid:13833] # Mem: 2146.1 MiB (2343.9 Peak, 1199.4 Metal) # Total CPU Time: 2417.601s (33.17% Sys, 66.83% User) # Instructions: 9944836683668 (5.75% P, 94.25% E) # Cycles: 5176430469224 (4.45% P, 95.55% E) # Disk Reads / Writes: 317.37 / 0.04 MiB (Logical Write 0.04) # Layer 0x729293000 (3456x2104) Interval 300.065s Active 300.065s # 59.7 FPS 17735 Frames 188 Skipped # Frame Time avg: 16.74ms min: 8.33 max: 125.00 stddev: 3.70 # CPU Begin-to-Present avg: 3.99ms min: 1.40 max: 94.37 stddev: 1.80 # On-GPU Time avg: 13.39ms min: 5.24 max: 37.57 stddev: 1.43 # Next Drawable Wait avg: 0.26ms min: 0.00 max: 91.08 stddev: 1.75 # Shader Compilation Time: 0.000s (Total: 0, Cached: 18) -
7:58 - Filter by process and emit JSON
// Report state transitions #import <StateReporting/StateReporting.h> NSString *domain = @"com.mygame.level"; SRStateReporter *reporter = [SRStateReporter reporterForDomain:domain]; [reporter reportTransitionToStateLabel:@"Level 1" stableMetadata:nil volatileMetadata:nil]; [reporter reportTransitionToStateLabel:@"Level 1" stableMetadata:@{ @"id": @1001 } volatileMetadata:nil]; [reporter reportVolatileMetadataUpdate:@{ @"health": @100 }]; -
13:55 - Include full state transitions in overview
metalperftrace overview /Data/MyGameTrace.atrc --include-state-transitions # [States] # com.mygame.graphics # High (30.59%, 14.996s) raytracing: 1 shadow: ultra # Medium (69.38%, 34.012s) raytracing: 0 shadow: medium # com.mygame.level # Level 1 (20.47%, 10.033s) biome: forest id: 1001 # Level 2 (79.53%, 38.991s) biome: volcano id: 1002 -
14:15 - Aggregate metrics by state
# Aggregate across all domains / transitions
metalperftrace overview /Data/MyGameTrace.atrc --aggregate

# Aggregate one domain
metalperftrace overview /Data/MyGameTrace.atrc --aggregate \
  --domain com.mygame.graphics

# Aggregate a specific state label within a domain
metalperftrace overview /Data/MyGameTrace.atrc --aggregate \
  --domain com.mygame.graphics \
  --state-label "High"
-