-
프로파일링, 수정 및 확인: Instruments로 앱 반응성 향상하기
명확한 워크플로를 사용하여 앱 반응성 문제를 해결하세요. Swift Concurrency 도구, Time Profiler, System Trace를 살펴보고 병목 현상을 정확히 찾아내세요. 주요 함수를 사용하고 비교를 실행하여 개선 사항을 측정하고 수정 사항을 확인하는 방법을 살펴보세요. 또한 이 주기의 각 반복을 그 어느 때보다 더 빠르게 수행하여 더 짧은 시간 안에 더욱 원활한 사용자 경험을 제공할 수 있도록 해 주는 Instruments의 기타 개선 사항에 대해 알아보세요.
챕터
리소스
관련 비디오
WWDC26
WWDC25
WWDC23
WWDC22
-
비디오 검색…
안녕하세요, 저는 Art이고 Xcode 팀에서 일하고 있습니다. 저는 Instruments 팀의 Harjas입니다. 부드러운 사용자 인터페이스를 제공하는 것은 훌륭한 앱의 기본입니다. 하지만 그 뒤에서는 많은 일들이 일어나고 있습니다. 소프트웨어 스택의 계층을 탐색하는 것은 복잡할 수 있습니다. Instruments 27은 이전보다 훨씬 쉽게 앱을 빠르고 반응성 있게 만드는 방법을 이해할 수 있게 해줍니다. 앱 기반부터 시작해 보겠습니다. 작성하는 Swift 코드는 빠르고 표현력이 풍부합니다. 하지만 이 코드는 독립적으로 실행되지 않습니다. 간단한 코드도 많은 복잡성을 숨기고 있습니다. 컴파일러와 런타임은 동적 디스패치, 안전성 검사, 그리고 참조 카운팅을 내부적으로 주입합니다. 그런 다음 메모리 할당을 위해 운영 체제에 의존하고, 프로세스 스케줄링과 I/O 라우팅도 처리합니다.
그 후 OS는 기본 플랫폼에 작업을 위임합니다. 이를 통해 실행이 물리적 하드웨어로 직접 라우팅됩니다. 또한 여기서 몇 가지 일반적인 구성 요소를 강조했지만, 더 많은 컴파일러 및 시스템 기능이 작동하고 있습니다.
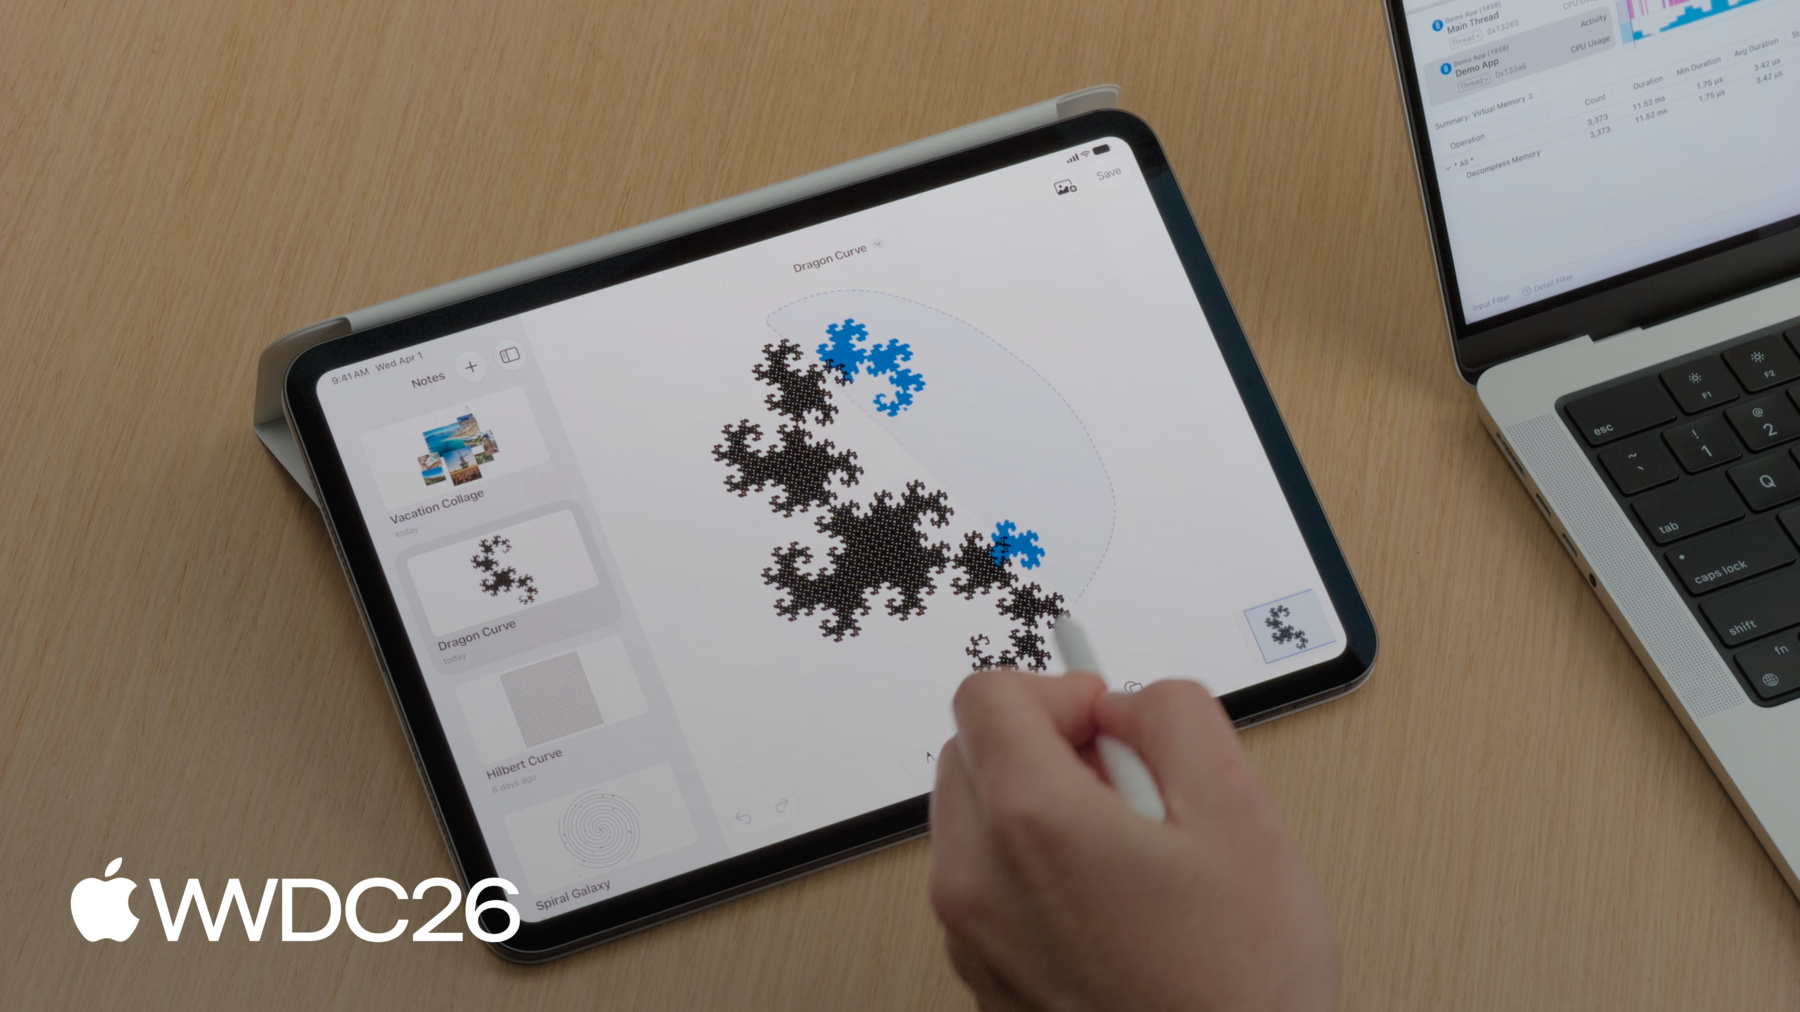
성능 문제를 분류할 수 있도록 앱 반응성을 이해하고 최적화하기 위한 멘탈 모델을 공유하겠습니다. 먼저 CPU 포화도를 살펴보고, 높은 시스템 사용률 기간을 조사하는 방법을 보여드리겠습니다. 다음으로 샘플링 데이터 시각화에 대해 논의하고, 프로파일링 데이터를 해석하는 방법을 탐색합니다. 그런 다음 실행 경합을 살펴보고, 작업이 리소스 부족으로 중단될 때 어떤 일이 발생하는지 살펴봅니다. 마지막으로 시스템 블로킹을 분석하여, 애플리케이션이 처리를 중단하는 근본 원인을 파악합니다. 본격적으로 들어가기 전에 진단 흐름을 정립해 보겠습니다. 애플리케이션이 프레임을 떨어뜨리거나 멈출는 경우 첫 번째 단계는 Time Profiler입니다. 방향을 잡기 위해 필요한 고수준 개요를 제공합니다. 거기서 질문은 이것입니다. 멈춤 현상이 발생할때 CPU는 무엇을 하고 있을까요? CPU 사용률이 높다면 스레드가 바쁘고 작업이 너무 오래 걸리는 것입니다. 이는 코드 성능 병목 현상을 가리킵니다. 메인 스레드에서 성능 문제가 발생했을 때, 두 가지 해결 방법이 있습니다. 첫 번째는 코드 최적화입니다. 더 빠르게 실행되도록 알고리즘을 리팩토링합니다. 하지만 무거운 작업을 피할 수 없다면, 작업을 백그라운드 작업으로 오프로드하여 해결하세요. 그러면 사용자 인터페이스가 반응성을 유지합니다. 애플리케이션이 멈추지만 프로세서가 유휴 상태라면, 알고리즘 최적화는 도움이 되지 않습니다. 이는 보통 메인 스레드가 막혀 있음을 의미합니다. 리소스가 해제되기를 기다리고 있는 것입니다. 이 차단은 여러 범주에 해당할 수 있으며, 일반적인 것으로는 다음이 있습니다. 파일 I/O 대기, 동기화 잠금 대기, 또는 프로세스 간 통신 대기가 있습니다. Time Profiler는 활성 CPU 사이클만 모니터링하기 때문에, 이러한 이벤트에 대한 가시성이 없습니다. 우리가 프로토타이핑해 온 노트 작성 애플리케이션을 사용하여 이 워크플로를 시연하겠습니다. 이 앱으로 그림을 그리고,
이미지를 추가하고,
올가미 도구를 사용하여 요소를 이동할 수 있습니다. 하지만 앱 테스트 중에 세 가지 문제를 발견했습니다. 프로파일을 캡처하여 이 문제들을 파악해 보겠습니다. Xcode에서 시작합니다. 프로파일링을 시작하려면 Product 메뉴를 열고 Profile을 선택합니다.
이렇게 하면 애플리케이션의 릴리스 빌드가 생성됩니다. 디버그 빌드는 디버깅 가능성을 위해 런타임 성능을 희생하므로, 디버그 빌드의 프로파일링 데이터는 오해를 불러일으킬 수 있습니다. 가장 실행 가능한 데이터를 얻으려면 릴리스 빌드를 프로파일링하는 것이 중요합니다. 코드베이스가 Swift Concurrency를 사용하기 때문에, 선택기에서 Swift Concurrency 템플릿을 선택합니다.
이 템플릿 안에서도 여전히 Time Profiler 도구를 사용할 수 있습니다.
녹화를 시작하고, iPad로 전환하여 워크플로를 기록합니다. 테스트 중에 성능 문제가 나타났던 워크플로들입니다. 노트를 저장할 때 펜슬이 즉시 반응하지 않습니다.
노트를 스크롤할 때 UI가 부드럽지 않습니다.
올가미 도구를 사용할 때 멈춤이 발생합니다.
이제 왼쪽 상단 모서리에서 녹화를 중지합니다.
이 세 가지 멈춤 현상에 대한 모든 정보가 담긴 트레이스가 준비되었습니다.
Harjas, 트레이스가 준비됐어요. 파일을 AirDrop으로 보낼게요. 조사를 시작할 수 있도록요. 감사합니다, Art. Instruments 27은 데이터를 쉽게 읽고 해석할 수 있게 해줍니다. 상단의 타임라인은 수평 트랙을 표시합니다. 작업, 액터, 그리고 실행자에 대한 트랙입니다. 이 트랙은 시간에 따른 리소스 사용량과 이벤트의 고수준 보기를 제공합니다. 타임라인 아래에는 세부 정보 영역이 있습니다. 이 세부 정보 보기는 타임라인에서 선택한 트랙을 기반으로 하며, 각 트랙은 자체 세부 정보 세트를 제공합니다. 중간 바의 팝업 버튼으로 선택을 변경하여 이들 사이를 전환할 수 있습니다. 오른쪽에는 완전히 새로운 Inspector 패널이 있습니다. 추가 세부 정보를 표시하며, 타임라인 또는 세부 정보 보기에서의 선택에 따라 액션이 표시됩니다. 먼저 올가미 도구가 펜슬을 따라가지 못하는 이유를 조사해 보겠습니다. 이를 더 쉽게 하기 위해 OSSignpost라는 도구를 사용합니다. OSLog와 OSSignpost는 로깅과 추적을 위한 API 세트를 제공합니다. 우리의 경우 올가미 선택 부분에 os.signpost 인터벌을 추가했습니다. 인터벌 추적을 시작하고 중지하는 API를 가진 OSSignposter 타입을 사용하여 이를 구현했습니다. 이 signposter를 생성할 때, 서브시스템을 "Demo App"으로 설정하여 내 앱과 관련된 것임을 알 수 있게 했습니다. 그리고 카테고리를 관심 지점으로 설정하여, Instruments가 자동으로 이 데이터를 관심 지점 트랙에 표시하도록 했습니다. 이제 타임라인에서 올가미 선택 인터벌을 찾을 수 있습니다.
인터벌의 컨텍스트 메뉴를 사용하여 이 기간으로 트레이스를 필터링합니다.
Hangs instrument 는 올가미 선택 중에 여러 번의 멈춤 현상이 발생한 것을 확일할 수 있습니다. 이는 Art가 경험한 것과 일치합니다. Art가 앞서 말했듯이, 이 멈춤 현상 중 메인 스레드의 CPU 사용량을 확인해야 합니다. 프로세스 트랙을 확장하면 이를 확인할 수 있으며, 이 프로세스의 모든 스레드가 나타납니다. 메인 스레드는 CPU 사용량이 높다는 것을 보여주며, 이 기간 동안 100% 수준을 유지하고 있습니다. 이는 코드가 실행되고 있지만 너무 오래 걸린다는 것을 나타냅니다. 따라서 Time Profiler를 사용하여 조사해야 합니다.
Art, Instruments에서 샘플링 데이터를 시각화하는 방법을 설명해 주시겠어요? 물론이죠. 애플리케이션이 실행될 때, CPU는 매초 수천 개의 샘플을 생성합니다. Instruments는 그 규모를 처리하도록 설계되어 있으며, 다양한 성능 분석 카테고리에 대한 시각화를 제공합니다. Time Profiler가 원시 실행을 콜 트리로 변환하는 방법을 살펴보겠습니다.
하드웨어 타이머를 사용하여 앱 실행 상태를 샘플링합니다. 일정한 간격으로요. 기본 샘플링 속도는 1밀리초입니다.
타이머가 작동하면 모든 코어의 현재 콜 스택을 기록합니다. 첫 번째 샘플에서 main이 saveNote를 호출합니다. 콜 트리에서 이 함수들은 각각 가중치 1을 받습니다. saveNote는 스택 하단에서 활발히 실행되는 함수이므로, 셀프 가중치 1을 받습니다.
1밀리초 후 두 번째 샘플이 실행됩니다. 이번에는 main이 renderCanvas를 호출하는 것을 샘플링하고, 그것이 drawStroke 함수를 호출합니다. 이들의 가중치도 트리에 추가됩니다.
세 번째 샘플에서 drawStroke가 완료되어, main과 renderCanvas를 샘플링합니다. main은 총 가중치 3으로 증가하고, renderCanvas는 가중치 2로 증가합니다.
빠른 swift_retain 호출을 주목하세요. 샘플 사이에 완전히 시작되고 끝났기 때문에 기록되지 않지만, 더 자주 호출될수록 샘플링될 가능성이 높아진다는 점을 기억하는 것이 중요합니다.
이 콜 트리가 조사를 이끄는 원시 데이터입니다. 하지만 한눈에 읽기가 어려울 수 있습니다. 이 데이터를 더 직관적으로 만들기 위해, Instruments는 플레임 그래프로 시각적으로 렌더링할 수 있습니다. 플레임 그래프는 전체 트리 구조를 공간적 블록으로 매핑합니다. 가중치 3의 main이 최상위 레벨을 형성합니다. main이 호출한 함수들인 renderCanvas와 saveNote가, 가중치에 비례하여 아래로 펼쳐지며, drawStroke 노드가 맨 아래에 위치합니다.
이 시각화에서 세로축은 콜 스택을 나타내며, 호출자가 위에, 피호출자가 아래로 확장됩니다. 가로축은 총 CPU 시간을 나타내지만, 시간순 타임라인이 아닌 집계된 보기입니다. 막대가 넓을수록 해당 함수가 더 많은 샘플에 나타난 것이므로, 비용이 많이 드는 코드 경로를 즉시 발견할 수 있습니다.
그러나 많은 곳에서 호출되는 코드의 경우, Swift 런타임 함수나 다양한 헬퍼 유틸리티처럼요. 플레임 그래프의 구조적 보기는 총 비용을 분산시킵니다. 실행 시간이 작은 조각들로 분산되어 이를 호출하는 모든 고유한 브랜치에 걸쳐 나타납니다. 이 분산으로 인해 어떤 특정 함수가 전체적으로 가장 많은 사이클을 소비했는지 파악하기 어렵습니다. 그 질문에 답하기 위해, Instruments는 새로운 분석 모드인 Top Functions를 도입합니다. 이 새로운 모드는 콜 계층을 무시합니다. 대신 분산된 모든 노드를 추출하여 합쳐서 하나의 블록으로 만듭니다.
이것은 셀프 메트릭을 사용하여 평가되며, 특정 함수 내부에서 직접 명령을 실행하는 데 소요된 시간을 계산합니다. Harjas, 데이터를 볼 준비가 된 것 같네요. 진행해 주세요. 감사합니다, Art. Instruments에서 프로파일을 볼 때, 기본 보기는 개요 콜 트리 표시입니다. 샘플 수를 볼 때 매우 유용합니다. 하지만 Art가 언급했듯이 플레임 그래프는 더 쉽게 스캔하고 시각적으로 문제를 발견할 수 있습니다. 콜 트리 위의 막대에 있는 세그먼트 컨트롤을 사용하여, 세부 정보 보기를 플레임 그래프 표시로 전환할 수 있습니다. 빠르게 스캔해 보면 시간이 여러 코드 경로에 걸쳐 나뉘어 있음을 캔버스의 렌더링 코드에서 확인할 수 있습니다. 해결해야 할 명확한 단일 문제는 없습니다. 오히려 이 다양한 코드 경로들이 합쳐져서 멈춤현상를 유발할 만큼 비용이 많이 드는 것입니다. Instruments의 새로운 Top Functions 모드를 시도해 보겠습니다. 콜 트리나 플레임 그래프에서 발견하기 어려운 것을 표면으로 드러낼 수 있을 것입니다. 이전에 사용한 것과 동일한 컨트롤에서 찾을 수 있습니다.
왼쪽에는 셀프 가중치 순으로 정렬된 모든 Top Functions 목록이 있습니다. 오른쪽에는 선택된 함수를 호출한 모든 코드 경로의 플레임 그래프가 표시됩니다. 올가미 선택 중 Top Function은 swift_project_boxed_opaque_existential입니다.
이 런타임 함수는 existential을 언래핑하는 역할을 하여 코드가 그 위에서 동작할 수 있도록 합니다. Xcode의 코딩 어시스턴트에게 드로잉 코드를 다시 작성하도록 요청하여 existential 대신 구체적 타입과 제네릭을 사용하도록 하겠습니다.
실행되는 동안 existential이 무엇인지, 그리고 코딩 어시스턴트에게 이 변경을 요청한 이유를 설명하겠습니다. Swift에서는 종종 변수가 프로토콜을 준수하는 모든 타입을 담을 수 있기를 원합니다. 컴파일 시점에 특정 타입을 알 필요 없이요. 이를 달성하는 한 가지 방법은 프로토콜 이름 앞에 any 키워드를 사용하는 것입니다. 이를 existential이라고 합니다. 가능한 타입이 크기 면에서 다양할 수 있기 때문에, existential은 접근하기 위해 추가 작업이 필요할 수 있으며 기본 값에 대해 동작합니다. 이것이 우리의 사용 사례에는 너무 비용이 많이 드는 것으로 판명됩니다. 성능이 중요할 때 existential에 대한 여러 대안이 있습니다 구체적 타입, 제네릭, 그리고 경우에 따라 열거형이 포함됩니다. 이러한 접근 방식은 컴파일러에 더 많은 정보를 제공하여, 더 나은 최적화를 가능하게 합니다. Swift의 제네릭에 대해 더 알아보려면, WWDC22의 "Embrace Swift generics" 세션을 시청하세요. 어시스턴트의 진행 상황을 확인해 보겠습니다.
코딩 어시스턴트가 해당 변경 사항을 완료한 것 같습니다. 업데이트된 트레이스를 Art에게 보내겠습니다. 감사합니다, Harjas. 우리가 적용한 수정 사항을 확인하기 위해, 서로 다른 창에 나란히 열어 Top Functions 데이터를 비교할 수 있습니다. 그러나 Instruments는 이제 단일 문서에서 실행 간 프로파일링 데이터를 직접 비교할 수 있게 해주어, 변경 사항 확인 작업 속도를 높이는 데 도움이 됩니다.
Instruments의 새로운 기능인 Run Comparisons를 소개합니다. 정확한 성능 델타를 계산하여 베이스라인 트레이스와 최적화된 트레이스의 모든 샘플을 상호 참조합니다. 스택의 모든 노드를 평가합니다. 이를 위해, Instruments는 베이스라인 실행에서 함수의 이전 버전을 최적화된 실행의 새 버전과 직접 매칭합니다.
매칭이 되면 델타를 계산하고 성능 차이에 따라 정렬합니다. 빨간 블록은 성능 회귀를 나타냅니다. 초록 블록은 성능 향상 또는 실행 시간 최적화를 나타냅니다. 그럼 사용해 보겠습니다. 노이즈 없이 정확한 비교를 위해, 먼저 두 실행을 필터링하여 올가미 선택에 대한 정확히 동일한 os_signpost 인터벌로 제한합니다.
그런 다음 메인 스레드의 샘플링 데이터를 비교하기 위해, 메인 스레드 트랙을 선택합니다.
그리고 중간 바의 비교 버튼을 클릭하면, 드롭다운 메뉴에서 베이스라인 실행을 선택할 수 있습니다.
이렇게 하면 사이드바에 비교 탭이 추가됩니다. 여러 비교를 만들 수 있으며, 협업을 더 쉽게 하기 위해 문서에 저장됩니다. 비교 트리는 텍스트 콜 트리로 시각화할 수 있습니다.
여기서 전반적인 실행 시간이 올가미 선택에서 감소했음을 확인할 수 있습니다.
플레임 그래프로 전환하면, 초록색으로 향상된 코드 경로와 빨간색으로 회귀된 경로를 볼 수 있습니다. 코딩 어시스턴트가 제네릭을 도입할 때 새 함수를 추가했으며, Run Comparisons는 이를 회귀로 표시합니다. Top Functions 보기에서 이제 가장 많이 향상된 것과 가장 많이 회귀된 것을 볼 수 있습니다. 기본적으로 Run Comparisons의 회귀가 상단에 정렬됩니다. 이 회귀는 코딩 어시스턴트가 existential 사용을 없애는 과정에서 추가한 새 함수들입니다.
정렬 순서를 반전하여 향상된 부분을 볼 수 있습니다.
여기서 swift_project_boxed_opaque_existential 호출이 완전히 제거되었습니다. 그리고 전반적으로 향상이 회귀보다 큽니다. 이는 구체적 타입과 제네릭을 도입하여 이 특정 런타임 오버헤드를 성공적으로 제거했음을 확인합니다. CPU 작업 최적화에 대해 더 알아보려면, WWDC25의 "Optimize CPU performance with Instruments" 세션을 시청하세요.
Harjas, 멈춤 현상 하나 해결, 두 개 남았네요. 맞습니다. 드로잉 코드를 최적화했으니, 베이스라인 실행으로 돌아가서 앱의 다른 부분을 계속 최적화할 수 있습니다. 아직 조사해야 할 멈춤 현상들이 여러 개 남아 있습니다.
안타깝게도 이것들은 관심 지점 트랙에 로그가 없어서 당시에 무슨 일이 있었는지 맥락을 파악하기 어렵습니다. 다른 맥락 파악 방법은 이 멈춤 현상 중에 Main Actor에 어떤 작업이 있는지 확인하는 것입니다. Instruments 27에는 새로운 Swift executors 도구가 있습니다.
이 도구는 Main Actor, 글로벌 동시 실행자, 그리고 프로세스의 모든 커스텀 실행자를 시각화합니다. 이 멈춤 현상들 각각에 대해, Main Actor 트랙은 renderThumbnail이라는 해당 Swift 작업을 표시합니다. 이 트랙을 선택하면 Main Actor에서 실행 중인 모든 작업의 요약을 볼 수 있습니다.
Main Actor에 여러 개의 render thumbnail 작업이 있으며 실행하는 데 수백 밀리초가 걸리는 것으로 보입니다.
이것이 노트 목록 스크롤이 부드럽지 않은 이유를 설명하는 데 도움이 될 수 있습니다. 진단 흐름을 따라 CPU 사용량을 확인해 보겠습니다. 트레이스를 이 멈춤 현상 중 하나로 필터링하겠습니다.
그리고 inspector를 사용하여 메인 스레드를 고정합니다.
이 기간 동안 Time Profiler는 메인 스레드의 CPU 사용량이 약 100%라고 보고합니다. 따라서 다른 시스템 리소스를 기다리는 것이 아니라, 이 작업들이 Main Actor에서 실행하는 데 너무 오래 걸리는 것입니다. 그렇다면 왜 이것이 문제일까요? 먼저 Main Actor가 무엇인지 검토하고 이 멈춤 현상을 어떻게 해결할 수 있는지 논의해 보겠습니다. Main Actor는 모든 사용자 인터페이스 업데이트와 상호 작용을 처리합니다. 애플리케이션은 모든 썸네일을 비동기적으로 렌더링합니다. 하지만 이 코드가 SwiftUI에서 호출되었기 때문에, Main Actor 컨텍스트를 상속했습니다. 이 작업들은 중요한 UI 업데이트와 Main Actor를 놓고 경쟁하여, 앱이 부드러운 경험을 제공하지 못하게 합니다. 이를 해결하려면 썸네일 렌더링을 스레드 풀로 라우팅해야 합니다. 이렇게 하면 Main Actor가 자유로워져 대기 중인 UI 이벤트가 부드럽게 실행됩니다.
이것은 썸네일을 생성하는 역할을 하는 코드입니다. task 이니셜라이저에 @concurrent 속성을 추가하여 리팩토링할 수 있습니다. 이렇게 하면 썸네일 렌더링 작업이 Main Actor에서 벗어나, 글로벌 실행자로 이동합니다. Swift 컴파일러는 이 코드 변경이 레이스 컨디션을 유발하지 않는지 확인합니다. 업데이트된 트레이스에서, Swift executors 도구는 썸네일 렌더링 작업이 Main Actor 트랙에서 글로벌 실행자 트랙으로 이동했음을 보여줍니다. 이것을 글로벌 동시 실행자로 이동하면 UI에서 멈춤 현상을 방지할 뿐만 아니라, UI 멈춤 현상을 방지할 뿐만 아니라, 이 썸네일들을 병렬로 렌더링할 수 있게 해줍니다.
Swift Concurrency 사용에 대해 더 알아보려면, WWDC25의 "Embracing Swift Concurrency"를 시청하세요. 좋아요, Art, 멈춤 현상 하나 더 남았네요! 마무리해 봅시다.
동시성 경합을 해결했으니, 마지막 멈춤 현상에 대해 베이스라인 실행으로 돌아가겠습니다. 저장을 누르면 사용자 인터페이스가 잠시 멈춥니다 관심 지점 트랙의 Write to File 인터벌을 사용하여 해당 멈춤 현상을 찾겠습니다.
inspector 범위를 설정하고 컨텍스트 메뉴에서 적절한 옵션을 클릭하여 확대하겠습니다.
이 단계에서 마이크로 멈춤 현상이 보고됩니다. 다시, CPU 사용량을 확인해 보겠습니다.
이 경우, 실제로 꽤 낮아서 약 20% 수준을 유지하고 있습니다.
진단은 낮은 CPU 사용량을 가리킵니다. 이 조건에서 인터페이스가 멈추면, 메인 스레드가 시스템 리소스를 기다리며 차단되었음을 알 수 있습니다. 왜 그런 일이 발생하는지 정확히 이해하기 위해, 스레드가 상태 간에 어떻게 전환되는지 살펴보겠습니다.
낮은 CPU 사용률은 오해의 소지가 있을 수 있습니다. 코드가 느리게 실행된다는 의미가 아니라, 스레드가 실행을 중단했다는 의미이기 때문입니다. System Trace 템플릿은 운영 체제가 애플리케이션을 언제, 왜 일시 중지하는지 정확하게 시각화합니다. 여기서 메인 스레드는 CPU 코어에서 활발히 실행 중입니다. 운영 체제는 대신 작업을 수행하고 하드웨어를 제어하기 위한 다양한 시스템 콜을 제공합니다. 하지만 리소스가 즉시 사용 가능하지 않으면 스레드는 차단 상태에 들어갑니다. 이 경우 커널은 스레드를 프로세서에서 제거합니다. 리소스가 준비되면 스레드는 실행 가능 상태가 되어, 코어로 돌아옵니다. 더 구체적으로 말하면, 하드웨어가 작업을 완료하더라도, 스레드가 즉시 실행을 시작하지는 않습니다. 먼저 실행 가능 상태에 들어가는데, 이는 리소스가 준비되었다는 의미이지만, 스레드가 OS 스케줄러를 위해 줄을 서야 하며 여유 CPU 코어가 할당되기를 기다려야 합니다.
이제 다시 줌 아웃합니다. 여기 강조된 차단 상태를 주목하세요. 대부분의 시간이 외부 의존성이 해결되기를 기다리며 차단된 상태에 있습니다. 해결되면 스레드는 잠시 깨어나 요청의 다음 단계를 조율합니다. 이 짧은 실행 순간들이 바로 그 20%의 CPU 사용률을 만드는 것입니다.
이 단계에서 스레드는 완전히 유휴 상태입니다. 이와 같은 단일 시스템 콜은 종종 여러 기반 의존성에 의존하며, 메인 스레드가 OS가 모든 것을 해결할 때까지 기다리도록 합니다. 마침내 코어로 돌아와 작업을 마무리합니다. 여기서는 알고리즘 최적화가 전혀 도움이 되지 않습니다. 최적화할 실행 중인 코드가 없기 때문입니다. Write to File 인터벌에서 무슨 일이 일어나고 있는지 함께 알아보겠습니다.
System Trace 템플릿을 사용한 이 멈춤 현상의 프로파일입니다. System Trace를 사용하면 스레드가 무엇을 하고 있었는지 정확히 볼 수 있습니다. 시스템 콜과 같은 주요 OS 개념도 포함해서요. inspector를 사용하여 메인 스레드를 고정하고 확대할 수 있습니다.
파일을 저장하는 동안 활동 레인에 많은 빈 공간이 표시됩니다. 이는 스레드가 차단되어 UI 업데이트가 방지되고 있음을 나타냅니다. 보이는 보라색 인터벌은 시스템 콜이 실행 중임을 나타냅니다. 하지만 syscall이 활성 상태라고 해서 스레드가 실제로 애플리케이션 코드를 실행하고 있다는 의미는 아닙니다. 이 인터벌 중 하나를 선택하겠습니다.
클릭하면, 클릭한 세그먼트 외에 더 많은 부분이 강조됩니다. 이는 코어에 있는 시간과 코어 밖의 시간 모두에 걸쳐 있는 하나의 연속적인 write 시스템 콜을 시각화합니다. 불투명한 세그먼트는 코어에서 활성으로 실행된 시간을 나타내며, 반투명한 세그먼트는 코어 외부에서 차단된 기간입니다. 왜 그렇게 오래 차단되어 있었는지 이해하기 위해, Inspector를 살펴볼 수 있습니다. Inspector는 이 시스템 콜에 전달된 정확한 인수를 보여줍니다. 대상 파일 디스크립터를 볼 수 있고, 버퍼의 메모리 주소,
그리고 가장 중요한 크기를 볼 수 있습니다.
메인 스레드에서 1.7기가바이트 이상의 데이터를 쓰려고 합니다. 성능 비용도 볼 수 있습니다. 이 단일 작업은 500밀리초 이상 걸렸으며, 그 중 거의 300밀리초가 디스크를 기다리며 코어 외부에서 소비되었습니다. 파일 쓰기가 메인 스레드에서 동기적으로 시작되었기 때문에, 애플리케이션은 저장소가 응답할 때까지 멈춥니다. 이를 수정하기 위해 파일 I/O를 백그라운드로 이동하는 코드를 리팩토링합니다. 이것이 해당 워크플로를 담당하는 코드 조각입니다. PropertyListEncoder 클래스를 사용하여 데이터를 직렬화하고 있으며, 병목 현상은 바로 이 줄입니다. data.write 메서드를 동기적으로 호출하고 있습니다. 이 원자적 쓰기가 메인 스레드에서 직접 실행되고 있기 때문에, 그것이 바로 그 차단을 유발한 원인입니다. 이 코드를 Swift task로 감쌀 수 있습니다. 이렇게 하면 인코딩과 파일 쓰기를 동시 스레드 풀로 밀어내어 Main Actor를 해제합니다. 파일 저장 중에 메인 스레드를 더 이상 차단하지 않는 것을 확인하는 또 다른 프로파일입니다. 이미 탐색해 두었습니다. Writing to File signpost 인터벌을 사용하여요. 메인 스레드에 더 이상 write 시스템 콜이 표시되지 않습니다.
이제 백그라운드 스레드에서 동일한 syscall을 찾을 수 있습니다.
이는 Apple Pencil 사용이 이제 부드럽게 느껴진다는 의미입니다. 앱을 열어 성과를 확인해 보겠습니다. 파일 I/O가 올바르게 라우팅되어, 문서 저장이 이제 백그라운드에서 이루어지며, 애플리케이션과 상호 작용이 가능합니다.
CPU 포화도도 최적화했기 때문에 그리고 리소스 경합도 해결했으며, 올가미 도구 사용과 노트 스크롤 모두 반응성을 유지합니다.
데이터를 따라가면서 베이스라인 실행에서 세 가지 유형의 멈춤 현상들을 모두 성공적으로 제거했습니다. 지속적으로 반응성 있는 애플리케이션을 개발하려면 프로파일링 도구를 특정 성능 증상에 맞추는 것이 필요합니다. CPU가 과부하 상태일 때, Top Functions를 사용하여 분산된 소프트웨어 오버헤드를 격리하고, Run Comparison으로 개선 사항을 확인하세요. 작업이 리소스를 다툴 때, Swift Concurrency 도구를 사용하여 액터 혼잡을 식별하세요.
그리고 스레드가 유휴 상태일 때, System Trace와 Inspector 패널을 활용하여 파일 I/O와 같은 동기적 차단 동작을 파악하세요.
이 워크플로를 자신의 코드베이스에 적용할 때, 프로파일링이 정확한지 확인하세요. 항상 릴리스 빌드를 프로파일링하세요. 그리고 os_signpost를 활용하여 Run Comparisons에 사용하는 인터벌이 신뢰할 수 있도록 하세요. 이 주제들을 더 깊이 탐구하려면 다음을 확인해 보세요. WWDC 2023의 "Analyze hangs with Instruments" 세션입니다. Instruments를 사용하면 어디를 봐야 할지 추측할 필요가 없습니다. 자주 프로파일링하고 데이터가 이야기를 들려주도록 하세요. 시청해 주셔서 감사합니다!
-
-
5:41 - Add signpost interval around Lasso Selection
// Add signpost interval around Lasso Selection import os.signpost let signposter = OSSignposter(subsystem: “Demo App", category: .pointsOfInterest) var lassoIntervalState: OSSignpostIntervalState? = nil func lassoSelectionUpdated() { lassoIntervalState = signposter.beginInterval("Lasso Selection") // Update selection in canvas… } func lassoSelectionEnded() { // Finalize lasso selection... signposter.endInterval("Lasso Selection", lassoIntervalState!) } -
12:11 - Existentials
// Existentials protocol Foo { } struct TypeA: Foo { } struct TypeB: Foo { } func bar(_ foo: any Foo) { } -
12:39 - Concrete Types
// Concrete types protocol Foo { } struct TypeA: Foo { } struct TypeB: Foo { } func bar(_ a: TypeA) { } func bar(_ b: TypeB) { } -
12:46 - Concrete Types + Generics
// Concrete types protocol Foo { } struct TypeA: Foo { } struct TypeB: Foo { } func bar(_ a: TypeA) { } func bar(_ b: TypeB) { } // Generics protocol Foo { } struct TypeA: Foo { } struct TypeB: Foo { } func bar<T: Foo>(_ generic: T) { } -
12:49 - Concrete Types + Generics + Enums
// Concrete types protocol Foo { } struct TypeA: Foo { } struct TypeB: Foo { } func bar(_ a: TypeA) { } func bar(_ b: TypeB) { } // Generics protocol Foo { } struct TypeA: Foo { } struct TypeB: Foo { } func bar<T: Foo>(_ generic: T) { } // Enums enum Foo { case a(TypeA) case b(TypeB) } struct TypeA { } struct TypeB { } func bar(_ enum: Foo) { } -
18:24 - Thumbnail Rendering
// Thumbnail rendering let drawingData = note.drawingData let canvasImages = note.decodeCanvas() thumbnail = await Task(name: "Render Thumbnail") { await renderThumbnail(drawingData: drawingData, canvasImages: canvasImages, size: CGSize(width: 300, height: 240)) }.value -
18:29 - Thumbnail Rendering Off Main Actor
// Thumbnail rendering off Main Actor let drawingData = note.drawingData let canvasImages = note.decodeCanvas() thumbnail = await Task(name: "Render Thumbnail") { @concurrent in await renderThumbnail(drawingData: drawingData, canvasImages: canvasImages, size: CGSize(width: 300, height: 240)) }.value -
24:12 - File Saving
// File saving let encoder = PropertyListEncoder() encoder.outputFormat = .binary guard let data = try? encoder.encode(snapshots) else { return } let id = signposter.beginInterval("Writing To File") try? data.write(to: fileURL, options: .atomic) signposter.endInterval("Writing To File", id) -
24:25 - File Saving off Main thread
// File saving

Task { @concurrent in
	let encoder = PropertyListEncoder()
	encoder.outputFormat = .binary
	guard let data = try? encoder.encode(snapshots) else { return }
	let id = signposter.beginInterval("Writing To File")
	try? data.write(to: fileURL, options: .atomic)
	signposter.endInterval("Writing To File", id)
}
-