-
Metal 게임의 성능 문제를 찾고 수정하기
강력한 Metal 도구로 찾기 어려운 게임 성능 문제를 추적하세요. Instruments의 Game Performance Overview를 사용하여 풍부한 성능 데이터를 수집하고, macOS의 metalperftrace와 iOS의 제어 센터로 백그라운드 추적을 실행하며, 새로운 StateReporting API를 사용하여 지표를 게임의 런타임 상태에 직접 연관시키는 방법을 알아보세요. 수시간 분량의 원격 측정 데이터를 명확하고 실행 가능한 인사이트로 전환하세요.
챕터
- 0:00 - 소개
- 1:51 - Metal 성능 지표
- 3:32 - 트레이스 수집
- 6:38 - 성능 트레이스 분석
- 10:08 - StateReporting으로 맥락 부여
- 17:48 - MetricKit으로 현장 데이터 수집
- 19:41 - 다음 단계
리소스
- Understanding the Metal Performance HUD metrics
- Monitoring your Metal app’s graphics performance
- Getting started with StateReporting
- Metal debugger
관련 비디오
Tech Talks
-
비디오 검색…
안녕하세요, 환영합니다.
저는 Metal Tools Team의 엔지니어 Ruiwei입니다. 부드럽고 일관된 프레임 속도는 플레이어에게 제공할 수 있는 가장 중요한 요소 중 하나입니다. 이것이 게임을 반응성 있고 완성도 높게 느끼게 하는 것이며 - 전체 플레이 세션에 걸쳐 그 부드러움을 유지하는 것이 핵심입니다. 필요한 모든 것을 제공하는 새로운 도구와 워크플로를 시연하겠습니다 긴 게임 세션에서 문제를 빠르게 수집하고 식별하기 위한. 훌륭하고 부드러운 게임 경험을 달성하는 것은 하나의 사이클입니다. 다양한 기기와 폼 팩터에서 게임을 플레이 테스트해야 하며, 성능 데이터를 수집하고, 결과를 분석하며, 성능 문제를 식별하고 수정해야 합니다. 그런 다음 다시 플레이 테스트하고 사이클을 반복합니다 성능 목표에 도달할 때까지. 플레이어가 게임을 몇 시간 동안 플레이하면서, 많은 조건이 변할 수 있습니다. 기기가 뜨거워지고 열 상태가 바뀔 수 있습니다. 플레이어가 그래픽 설정을 조정합니다. 다양한 레벨과 전투 사이를 이동합니다. 진정으로 부드러운 경험을 달성하려면, 측정해야 합니다 오랜 시간에 걸쳐 다양한 시나리오에서. 방법을 보여드리기 위해, 간단한 소개로 시작하겠습니다 사용 가능한 Metal 성능 메트릭에 대한. 그런 다음, 수집하는 새로운 도구와 워크플로를 보여드리겠습니다 오랜 시간에 걸쳐 트레이스를 분석합니다. 다음으로, 트레이스를 맥락화하는 방법을 시연하겠습니다. 언제든지 게임의 상태를 이해할 수 있도록. 그리고 마지막으로, 게임이 출시된 후 현장에서 데이터를 수집하는 방법. Metal 성능 메트릭으로 시작하겠습니다.
Metal 도구는 다양한 메트릭을 제공합니다. 이러한 메트릭은 다양한 세션 간에 비교하기 위한 기준선을 제공합니다 그리고 잠재적인 문제를 식별합니다. 예를 들어, 초당 프레임 수와 같은 타이밍 관련 메트릭, GPU 시간, 그리고 Frame Interval은 프레임의 페이싱을 알려줍니다 그리고 GPU가 얼마나 활용되고 있는지를 알려줍니다. 반면에, Layer sizes, Composition mode와 같은 메트릭, 그리고 MetalFX 관련 메트릭은 확인하는 데 도움을 줍니다 디스플레이 관련 설정이 올바르게 설정되어 있는지. 이 모든 메트릭을 한눈에 볼 수 있는 곳이 있습니다.
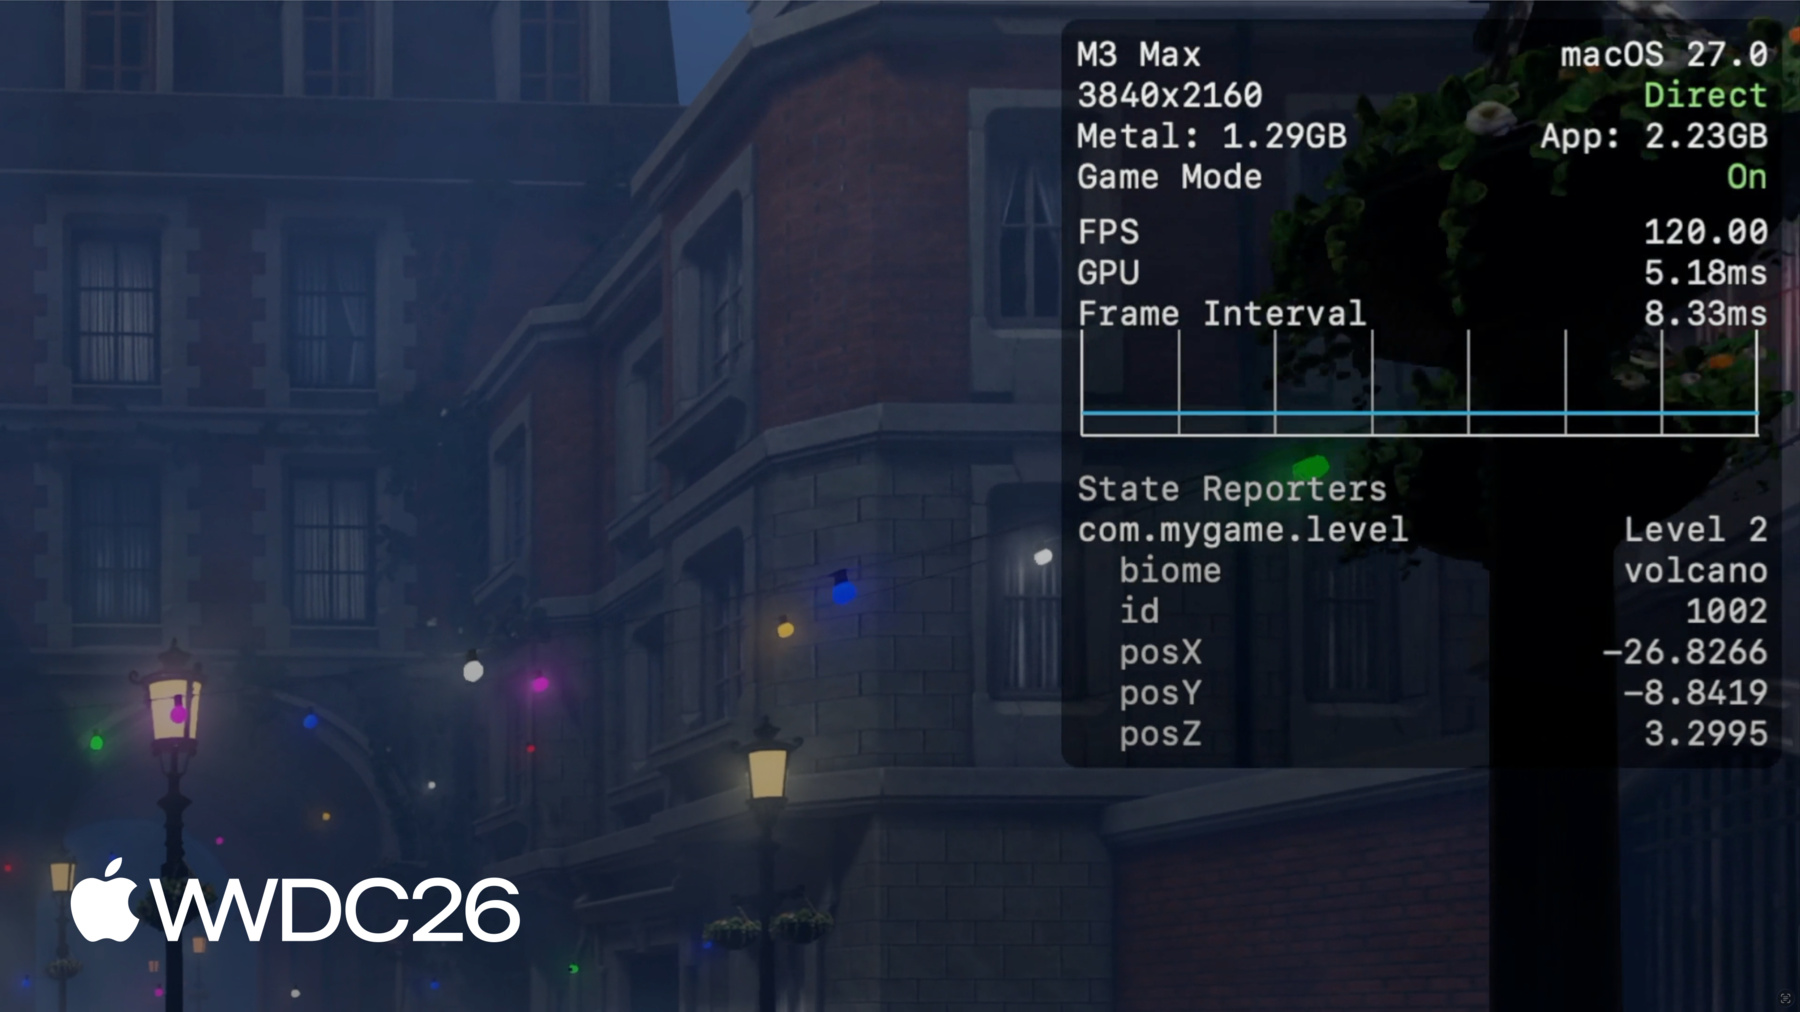
Metal Performance HUD는 FPS와 같은 성능 메트릭을 표시합니다. 메모리 사용량과 frame interval을 게임 콘텐츠 위의 오버레이에 표시합니다. 플레이하면서 게임이 어떻게 수행되는지 전반적인 감각을 제공하며, 다양한 커스터마이징 기능을 가지고 있습니다. 예를 들어, 설정 패널은 표시할 메트릭 목록을 커스터마이징할 수 있게 해줍니다. 각 개별 메트릭을 활성화하거나 비활성화할 수 있으며, 또는 프리셋에서 선택할 수 있습니다. 각 메트릭에 대해 더 자세히 알아볼 수 있습니다 그리고 Metal 도구 문서에서 HUD에 대해. "Metal 앱의 그래픽 성능 모니터링" 그리고 "Metal Performance HUD 메트릭 이해하기". HUD는 개발 중에 빠르게 확인하기에 좋지만, 오랜 시간 동안 메트릭을 저장하는 기능을 제공하지 않습니다. 프레임 드롭을 어디서 경험했는지 정확히 잊어버리기 쉽습니다, 특히 몇 분 또는 몇 시간 동안 플레이할 때.
그 수준의 세부 정보를 얻으려면, 성능 트레이스를 수집해야 합니다 오랜 시간에 걸쳐. 책상에서 게임을 테스트하기 위해, Instruments의 Game Performance Overview 템플릿을 사용할 수 있습니다.
시작하려면, Game Performance Overview 템플릿을 선택하세요 Instruments 템플릿 선택기에서. 집계된 Metal 성능 메트릭을 캡처합니다 Time Profiler CPU 샘플과 함께. Instruments를 사용하여 게임을 시작하거나, 또는 연결된 기기에서 이미 실행 중인 게임 세션에 연결할 수 있습니다. 준비가 되면, 녹화 버튼을 클릭하기만 하면 됩니다. 이것은 책상에서 게임을 테스트하면서 데이터를 수집하기에 이상적입니다 - 몇 분 이상 지속되는 세션. 하지만 정말 강력한 것이 있습니다. 게임이 실행되는 동안, 시스템은 항상 기록합니다 그리고 Metal 성능 및 리소스 사용 메트릭을 저장합니다. CPU, GPU, FPS, Memory와 같은 집계 및 선택적 프레임별 메트릭은 효율적으로 저장되며, 며칠 동안 보존됩니다. 이것은 몇 시간 동안 지속되는 긴 게임 세션의 경우, 그리고 여러 상태 변경을 포함하더라도, 게임 세션이 끝난 후 과거로 돌아가 데이터를 수집할 수 있습니다 - macOS 및 iOS 기기 모두에서 로컬로. 이것이 어떻게 작동하는지 시연하겠습니다. macOS에서는 metalperftrace를 통해 데이터를 수집할 수 있습니다. macOS 27의 새로운 커맨드 라인 도구. 추가 구성이 필요하지 않습니다. 단순히 metalperftace collect를 실행하세요 그리고 원하는 시간 기간을 --last로 전달하세요, 몇 시간에서 며칠까지. 예를 들어, 이 명령은 트레이스를 수집합니다 지난 5시간의 성능 메트릭을 포함하는. 또는, 명시적인 시작 및 종료 날짜를 전달할 수 있습니다 특정 시간 범위의 트레이스를 수집하기 위해.
이것이 macOS에서 과거를 돌아보고 트레이스를 수집하는 방법입니다. iOS에서 룩백 수집은 일회성 기기 설정이 필요합니다. 개발자 모드가 활성화된 상태에서, 개발자 설정으로 이동하여 Performance Trace를 활성화하세요. Lookback Collection을 선택하고, 트레이스가 얼마나 과거까지 포함할지 선택하세요.
마지막 단계로, 제어 센터로 이동하여 Performance Trace 버튼을 추가하세요.
이제 기기가 트레이스 수집 준비가 되었습니다. 평소처럼 게임 플레이 테스트를 시작할 수 있습니다. 끝나면, 제어 센터를 여세요. performance trace 버튼을 탭하면, 기기가 수집을 시작합니다 구성된 시간 기간 동안 트레이스를 처리합니다.
이 작업은 시간이 걸릴 수 있습니다. 그리고 처리가 완료되면 알림을 받게 됩니다. 수집된 트레이스는 사용 가능한 트레이스 파일 목록에 표시됩니다. 그리고 거기서 트레이스를 추가 분석을 위해 Mac으로 쉽게 전송할 수 있습니다. 이제 트레이스 수집 방법을 시연했으므로 - Instruments와 iOS 및 macOS 기기 모두에서, 다음 단계를 진행할 시간입니다: 분석하기. macOS에서는 메트릭의 개요를 인쇄하거나 내보낼 수 있습니다 metalperftrace를 통해. 또는 Instruments에서 트레이스를 열고 데이터를 시각적으로 탐색합니다. 둘 다 실제로 확인해 보겠습니다. 기록된 트레이스의 전반적인 성능을 살펴보려면, 단순히 트레이스 파일로 metalperftrace overview를 실행하세요. metalperftrace는 집계하고 전반적인 성능 데이터를 출력합니다 트레이스에 포함된 게임 세션의. 보고서는 각 프로세스에 대해 2개의 섹션으로 나뉩니다. 첫 번째 섹션에는 리소스 사용 통계가 포함됩니다. 메모리 사용량, CPU 시간, 디스크 활동 등. 두 번째 섹션에는 각 레이어에 대한 Metal 성능 메트릭이 포함됩니다. 예를 들어, 이 세션 동안, 평균 메모리 사용량은 약 2.1GB입니다. 평균 FPS는 약 60입니다.
그리고 보고서에는 메트릭에 대한 통계 값도 포함됩니다 frame time과 on-GPU time과 같은. 이것은 세션의 전반적인 성능에 대한 빠른 아이디어를 제공합니다. 트레이스에 여러 게임 세션이나 Metal 그래픽 앱이 있는 경우, 선택적 조건을 사용하여 원하는 정확한 프로세스의 데이터를 출력할 수 있습니다.
또한, --json을 전달하여 metalperftrace가 JSON 형식으로 출력하도록 할 수 있습니다. 이제 스크립트에 쉽게 입력할 수 있는 구조화된 출력을 얻습니다 회귀 테스트를 위한, 또는 AI 에이전트가 잠재적인 성능 문제를 자동으로 분류하기 위한.
Instruments는 더 깊은 분석을 위해 트레이스를 열고 시각화할 수도 있습니다 더 상세한 메트릭과 함께. 데이터는 타임라인에 표시되며, Instruments는 자동으로 값을 평가합니다 너무 많이 벗어나는 통계가 다른 색상으로 강조 표시됩니다. 예를 들어, 이 트레이스에서, FPS가 일정 기간 동안 떨어졌으며 노란색으로 표시됩니다. 세부 보기에는 통계 값이 표시됩니다: 각 메트릭의 최솟값, 최댓값, 평균, 표준 편차. 이 통계는 전체 트레이스에 대해 집계됩니다 또는 선택한 시간 범위에 대해. 시간 범위를 선택할 수 있습니다 그러면 Instruments가 자동으로 집계하고 선택한 기간에 대한 통계를 업데이트합니다. 여기서 평균 FPS가 해당 기간 동안 26으로 떨어졌으며, GPU 사용량은 매우 낮습니다.
여기서 더 깊이 파고들고 문제를 재현하려고 해야 하지만, 큰 도전이 있습니다. 프레임 속도 저하가 약 12분 지점에서 발생했다는 것을 알고 있지만, 그 시점에 게임이 무엇을 하고 있었는지 알지 못합니다.
이런 트레이스를 볼 때 평균 FPS만으로는 추가로 조사하기 위한 실행 가능한 컨텍스트가 충분하지 않습니다. 레벨의 특정 구역으로 인한 저하였을까요? 아니면 그래픽 설정이 변경되었을까요? 이것이 잠재적인 성능 문제를 식별할 때 컨텍스트가 중요한 이유입니다 그리고 트레이스를 분석합니다. 개별 문제를 조사하려면, 세밀한 데이터가 필요합니다 각 순간에 게임이 무엇을 하고 있었는지 알려주는. 따라서 다음으로, 트레이스에 컨텍스트를 추가하는 데 도움이 되는 새로운 API를 소개하겠습니다. StateReporting은 게임의 동작을 설명할 수 있게 해주는 새로운 API입니다 그리고 시간에 따른 상태. 그리고 네 가지 핵심 개념에 기반합니다. 모든 것은 도메인으로 시작됩니다. 도메인은 유한 상태 기계입니다 특정 기능 영역을 나타내는. 예를 들어, 플레이어 진행 상황을 추적하는 레벨 도메인을 정의할 수 있습니다.
각 도메인은 한 번에 하나의 상태일 수 있습니다.
각 상태는 "Level 1"과 같은 레이블로 시작됩니다. 선택적 안정 메타데이터를 포함할 수도 있습니다. 이것은 직렬화 가능한 모든 종류의 정보를 포함하는 불변 딕셔너리입니다 레이블 외에 현재 상태에 대한.
각 상태에는 휘발성 메타데이터도 포함할 수 있습니다. 이름에서 알 수 있듯이, 상태 내에서 변경될 수 있는 값에 사용합니다.
플레이어의 체력과 같이. 플레이어가 게임을 진행하면서, 상태 간에 전환할 수 있습니다 다른 레이블과 메타데이터로. 예를 들어, "Level 1"에서 "Level 2"로 전환합니다 플레이어가 다음 레벨로 진행할 때. 이것을 타임라인에 놓으면, 여러 도메인을 정의할 수 있습니다 게임의 특정 영역의 상태를 설명하기 위해.
예를 들어, 레벨 변경을 추적하는 레벨 도메인, 현재 그래픽 설정을 추적하는 그래픽 도메인, 그리고 네트워크 상태를 위한 네트워크 도메인.
이전 FPS 그래프로 돌아가면, 이제 트레이스를 맥락화할 수 있으며 즉시 개선이 필요한 영역을 알 수 있습니다. 그리고 최적화 노력을 집중할 수 있습니다.
StateReporting API는 Swift와 Objective-C 모두에서 사용 가능하며, 채택하기 쉽습니다.
게임의 현재 레벨을 보고하는 샘플 코드를 보여드리겠습니다. 먼저, 도메인을 생성합니다. 일반적으로 역방향 DNS 문자열이며, 해당 도메인의 리포터를 요청합니다. 리포터는 상태 기계의 인스턴스입니다 상태 전환을 보고하는 데 사용할 수 있는. 상태를 보고하려면, 레이블로 reportTransition을 사용하세요 현재 상태를 설명하기 위해.
선택적으로, 상태에 대한 추가 구조화된 정보를 포함하려면, stableMetadata 인수에 딕셔너리를 전달하기만 하면 됩니다. 휘발성 메타데이터의 경우, 다른 상태로 전환하지 않고 값을 업데이트할 수 있습니다 정보를 나타내는 딕셔너리와 함께 reportVolatileMetadataUpdate를 호출하여.
StateReporting은 제가 논의한 모든 도구와 긴밀하게 통합되어 있습니다: Metal Performance HUD, metalperftrace, 그리고 Instruments.
Metal Performance HUD에서, 상태 도메인 목록이 메트릭 설정 탭에 표시됩니다. 활성화하면 오버레이에 레이블, 안정 및 휘발성 메타데이터가 표시됩니다. 이것이 StateReporting 채택을 확인하는 가장 직접적인 방법입니다.
예를 들어, 여기서 저는 바이옴을 포함한 레벨 상태를 보고합니다 그리고 안정 메타데이터로 id, 그리고 휘발성 메타데이터로 플레이어 위치. 휘발성 플레이어 위치는 초당 한 번 보고되며, 오버레이를 통해 위치를 확인할 수 있습니다 플레이어가 이동할 때. metalperftrace에서, 개요를 출력할 때 상태 전환을 포함하는 트레이스에 대해, 보고서에는 도메인 목록이 포함됩니다, 전환 횟수, 그리고 마지막으로 알려진 상태.
전체 상태 전환 세부 정보를 알려면, 단순히 --include-state-transitions를 전달하세요. 이것은 시작 및 종료 타임스탬프와 함께 전체 상태 목록을 출력합니다.
metalperftrace는 자동으로 집계하고 메트릭을 보고할 수 있습니다 이러한 상태의 함수로.
모든 도메인 및 상태 전환에 대해 집계하도록 metalperftrace에 요청할 수 있으며, 또는 특정 도메인의 모든 상태 전환에 대해 집계하거나, 또는 도메인 내의 특정 상태 레이블에 대해 집계할 수 있습니다.
예를 들어, 그래픽이 높음으로 설정되었을 때의 평균 FPS를 보려면, 단순히 metalperftrace에 "High" 상태 레이블을 집계하도록 요청할 수 있습니다 그래픽 도메인에 대해.
보고서는 상세한 상태 정보, 활성화된 기간, 그리고 다른 도메인의 겹치는 상태 목록을 표시합니다. 예를 들어, 여기서 그래픽이 High로 설정되었을 때 평균 FPS는 약 24에 불과합니다.
시간에 따른 상태 전환을 더 시각적으로 살펴보려면, Instruments에서 트레이스를 열 수 있습니다.
상태 전환이 포함된 트레이스를 열 때, Instruments는 각 도메인에 대한 트랙을 생성합니다 Points of Interest 인스트루먼트의 일부로.
각 트랙은 상태 전환과 휘발성 업데이트를 그래프로 표시하며, 컨텍스트를 쉽게 이해할 수 있게 합니다.
개별 상태를 선택할 수 있으며, 사이드바에서 해당 상태의 세부 정보를 검사할 수 있습니다. 안정 및 휘발성 메타데이터와 같은. Metal 성능 메트릭과 결합하여, 그래픽 설정이 높음으로 변경되면서 프레임 속도가 떨어지기 시작했음을 확인했습니다. 그래픽 설정이 높음으로 변경되면서. 다음에 조사에 집중할 부분이 바로 그곳입니다. 문제를 재현하기 위한 충분한 컨텍스트가 확보되면, 다음 단계는 게임의 특정 지점을 더 깊이 살펴보는 것입니다.
상세한 CPU 및 GPU 스케줄링 데이터를 캡처할 수 있습니다 Instruments의 Metal system trace 템플릿을 사용하여.
또한 Xcode의 Metal 디버거를 사용하여 프레임을 캡처하고 프로파일링할 수 있습니다.
해당 도구에 대해 더 자세히 알아보려면, "Metal Developer Tools" 문서를 확인하세요. 그리고 "M3 및 A17 Pro를 위한 새로운 Metal 프로파일링 도구 알아보기".
게임에서 StateReporting을 채택할 때 염두에 두어야 할 몇 가지 모범 사례가 있습니다. 첫째, 계측하기 전에 도메인과 상태를 신중하게 설계하세요. 각 도메인은 다른 도메인과 개념적으로 직교해야 합니다. 단일 도메인에 너무 많은 차원을 표현하려 하지 마세요 - 그것은 추적하기 어렵게 만듭니다. 둘째, 너무 많은 상태 전환을 갖지 마세요. StateReporting은 추가 컨텍스트를 제공하도록 설계되었습니다 오랜 시간에 걸쳐 성능을 분석하기 위한. 고빈도 상태 변경을 위해 설계되지 않았습니다. 전환을 사용자 액션의 주기 또는 더 느린 것으로 제한하려고 노력하세요. 전환 속도가 너무 높으면 시스템이 제한합니다. 그리고 속도가 다시 제어되기 전까지 중요한 정보를 잃게 됩니다.
그리고 마지막으로, 상태의 정확성을 확인하세요 Metal Performance HUD 및 Instruments와 같은 도구를 사용하여. 전환이 예상대로 발생하고 합리적인지 확인하세요. 데이터를 잘못되고 이해하기 어렵게 만드는 엣지 케이스를 놓치기 쉽습니다.
되돌아보면, 이제 수집의 전체 그림을 갖게 되었습니다. 분석 및 성능 데이터를 맥락화하는 게임 출시 전 긴 게임 세션을 위한. 하지만 이러한 도구는 출시 이후에도 멈추지 않습니다.
게임이 플레이어 기기에 도착하면, 성능을 계속 모니터링하는 것이 중요합니다. 그리고 플레이어 경험에 영향을 미치는 예상치 못한 성능 저하를 포착합니다. 다음으로, 게임 출시 후 주요 Metal 성능 메트릭을 수집하는 방법을 다루겠습니다. 게임이 출시된 후. MetricKit은 두 가지 유형의 데이터를 제공하는 프레임워크입니다: 메트릭과 진단. 게임에 전력 및 성능 데이터에 대한 직접적인 인프로세스 접근을 제공합니다 보고서 형태로.
플레이어가 게임을 플레이하면서, MetricKit은 백그라운드에서 지속적으로 데이터를 수집합니다 그리고 게임에 일일 보고서를 전달합니다. 보고서에는 게임의 부드러움을 측정하는 메트릭이 포함됩니다. 그리고 기기 리소스를 얼마나 사용하고 있는지. macOS 및 iOS 27에서, MetricKit은 Metal 프레임 속도 정보를 노출합니다. 다른 흥미로운 성능 및 전력 메트릭과 함께. 또한 StateReporting 상태의 함수로 Metal 프레임 속도를 제공합니다. 프레임 속도는 집계되고 상태별로 그룹화됩니다 메트릭 보고서에서. 이 샘플 보고서에서, MetricKit은 전체 평균 프레임 속도를 보고합니다 시간 및 프레임 수와 함께. 또한 프레임 속도 정보를 세분화합니다 레벨 도메인의 상태별로. 이러한 메트릭과 더 많은 것들이 게임 프로세스에 전달됩니다 로컬 분석을 수행할 수 있는. 그리고 오프 기기 처리 및 집계를 위해 데이터를 패키징합니다. 이것을 통해 현장에서 게임의 성능을 모니터링할 수 있으며, 잠재적인 문제를 식별하여 조사하고 수정할 수 있습니다.
메트릭 외에도, MetricKit은 진단도 제공합니다 어떤 코드 경로가 성능 문제를 야기했는지 식별하는 데 도움이 되는. 메모리 예외와 같은. 게임이 메모리 한도를 초과하여 종료되면, 무슨 일이 있었는지에 대한 더 많은 통찰을 얻게 됩니다.
요약하면, iOS 및 macOS 27에서, Metal 성능 메트릭은 항상 시스템에 의해 기록됩니다. 과거를 돌아보고 성능 메트릭을 수집하는 방법을 시연했습니다 몇 시간에서 며칠에 걸쳐. 그리고 metalperftrace와 Instruments를 사용하여 해당 트레이스를 분석하는 방법.
또한 새로운 StateReporting API를 보여드렸습니다 트레이스에 컨텍스트를 추가하는 데 도움이 되는.
출시 후, MetricKit은 플레이어 기기에서 메트릭과 진단을 전달합니다.
시작하려면, StateReporting을 확인하세요. 게임에서 가장 중요한 도메인을 설계하세요 레벨, 그래픽, 네트워크 상태, 그리고 보고를 시작하세요. 게임을 플레이 테스트하고, 긴 게임 세션 트레이스를 수집하세요 그리고 부드러운 플레이어 경험이 있는지 확인하세요 지원되는 기기에서.
또한 MetricKit을 확인하는 것도 기억하세요. 그리고 플레이어 기기에서 일일 메트릭 보고서를 수집하세요. 사용 가능한 데이터와 MetricKit을 통합하는 방법에 대해 자세히 알아보려면, "새로운 MetricKit 만나기"를 확인하세요. 새로운 도구와 워크플로를 사용해 보세요. 그리고 Apple Platforms에서 여러분의 게임을 플레이하기를 기대합니다. 시청해 주셔서 감사합니다!
-
-
5:00 - Collect a trace with metalperftrace
# Collect the last 5 hours metalperftrace collect /tmp --last 5h # Output # Metal performance traces collected to: /tmp # /tmp/MetalPerfTrace_20260401_094100_to_144100.atrc # Or collect an explicit time range metalperftrace collect /tmp \ --start 2026-04-01T09:41:00 \ --end 2026-04-01T12:41:00 -
7:02 - Print a trace overview
metalperftrace overview /Data/MyGameTrace.atrc # [Modern Renderer pid:13833] # Mem: 2146.1 MiB (2343.9 Peak, 1199.4 Metal) # Total CPU Time: 2417.601s (33.17% Sys, 66.83% User) # Instructions: 9944836683668 (5.75% P, 94.25% E) # Cycles: 5176430469224 (4.45% P, 95.55% E) # Disk Reads / Writes: 317.37 / 0.04 MiB (Logical Write 0.04) # Layer 0x729293000 (3456x2104) Interval 300.065s Active 300.065s # 59.7 FPS 17735 Frames 188 Skipped # Frame Time avg: 16.74ms min: 8.33 max: 125.00 stddev: 3.70 # CPU Begin-to-Present avg: 3.99ms min: 1.40 max: 94.37 stddev: 1.80 # On-GPU Time avg: 13.39ms min: 5.24 max: 37.57 stddev: 1.43 # Next Drawable Wait avg: 0.26ms min: 0.00 max: 91.08 stddev: 1.75 # Shader Compilation Time: 0.000s (Total: 0, Cached: 18) -
7:58 - Filter by process and emit JSON
// Report state transitions #import <StateReporting/StateReporting.h> NSString *domain = @"com.mygame.level"; SRStateReporter *reporter = [SRStateReporter reporterForDomain:domain]; [reporter reportTransitionToStateLabel:@"Level 1" stableMetadata:nil volatileMetadata:nil]; [reporter reportTransitionToStateLabel:@"Level 1" stableMetadata:@{ @"id": @1001 } volatileMetadata:nil]; [reporter reportVolatileMetadataUpdate:@{ @"health": @100 }]; -
13:55 - Include full state transitions in overview
metalperftrace overview /Data/MyGameTrace.atrc --include-state-transitions # [States] # com.mygame.graphics # High (30.59%, 14.996s) raytracing: 1 shadow: ultra # Medium (69.38%, 34.012s) raytracing: 0 shadow: medium # com.mygame.level # Level 1 (20.47%, 10.033s) biome: forest id: 1001 # Level 2 (79.53%, 38.991s) biome: volcano id: 1002 -
14:15 - Aggregate metrics by state
# Aggregate across all domains / transitions
metalperftrace overview /Data/MyGameTrace.atrc --aggregate

# Aggregate one domain
metalperftrace overview /Data/MyGameTrace.atrc --aggregate \
  --domain com.mygame.graphics

# Aggregate a specific state label within a domain
metalperftrace overview /Data/MyGameTrace.atrc --aggregate \
  --domain com.mygame.graphics \
  --state-label "High"
-