-
网页检查器详解
网页检查器中封装了丰富的功能,旨在帮助您轻松地检查、调试和交付网页内容。简要了解网页检查器的最新功能,包括主要布局、标签、按钮和使其成为强大网页开发工具的其他功能。
资源
相关视频
WWDC23
Tech Talks
-
搜索此视频…
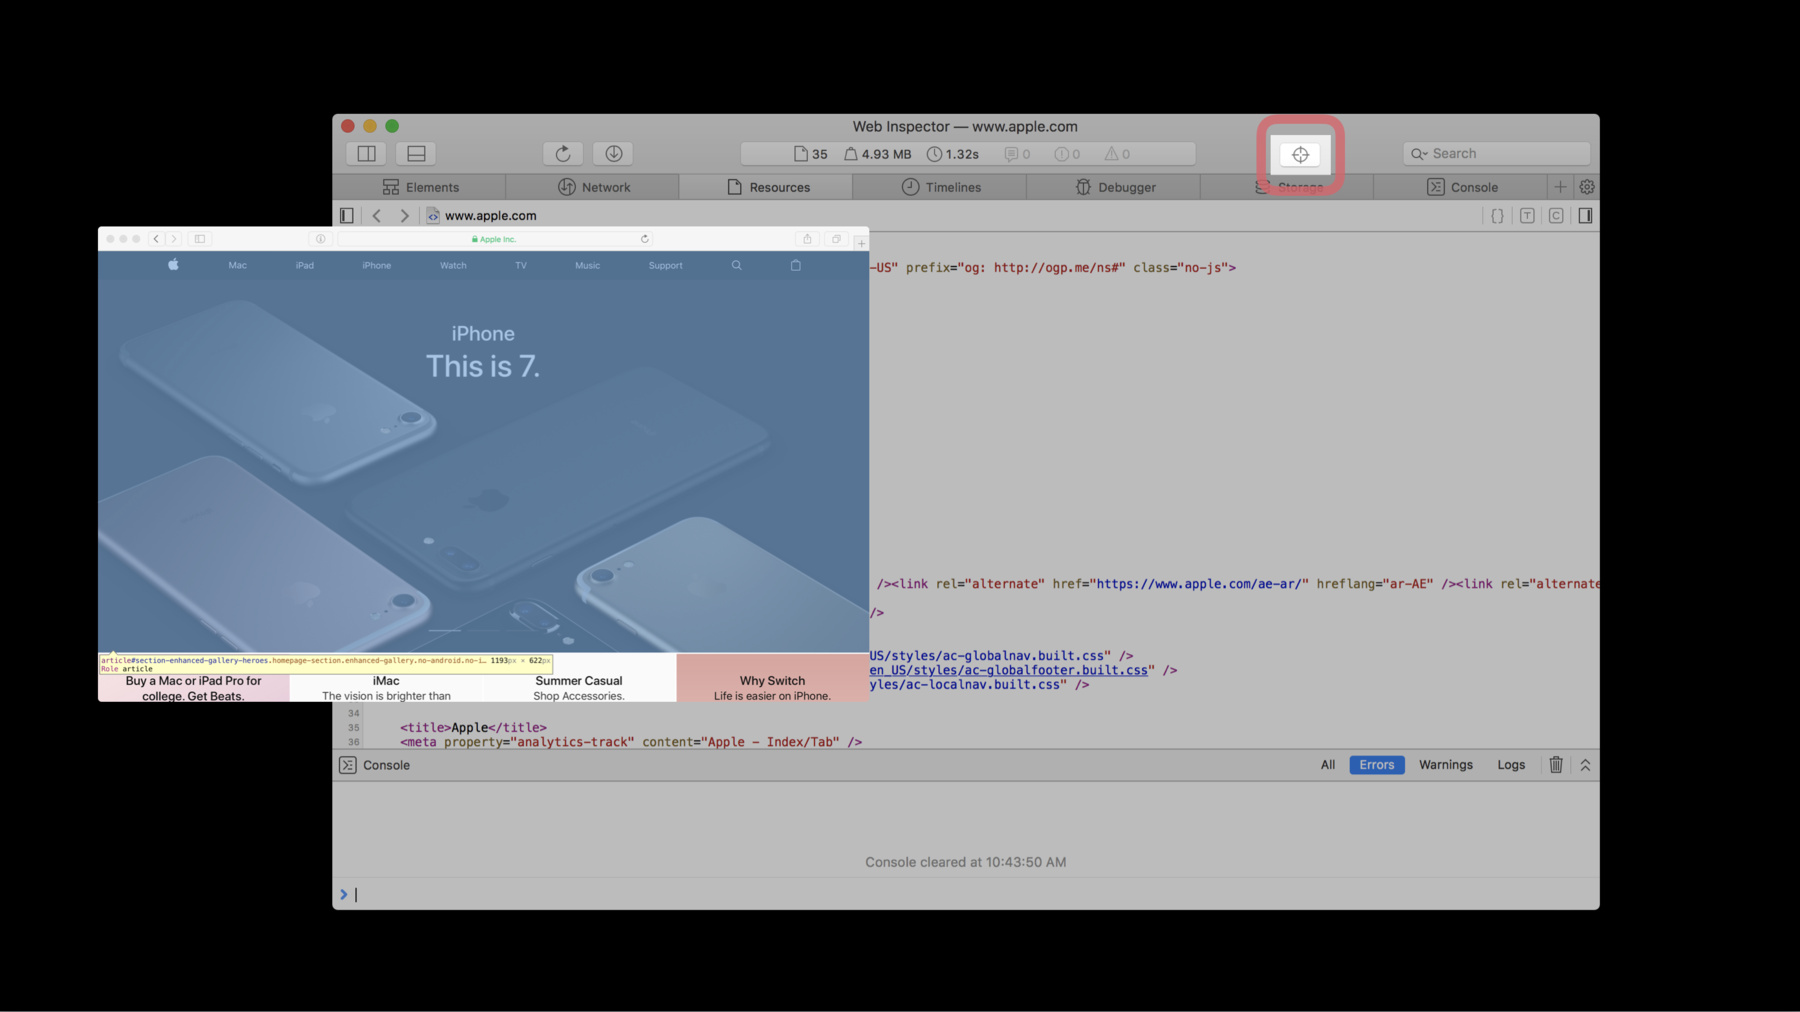
This is a five-minute walkthrough of all the features in Safari's browser development tool, Web Inspector. Let's get started. To see Web Inspector, first you will need to enable the Develop menu. To enable the Develop menu, click Preferences in the Safari menu. Go to the Advanced section, and check the check box at the bottom of the section to enable Develop options. After enabling these options, press "Command + Option + I" to open Web Inspector, or choose the Show Web Inspector option from the Develop menu. Web Inspector's tools are split into tabs. You can dismiss tabs and add them back with the plus tab. Across the bottom of every tab is a console bar. Click Escape to expand this bar into a mini console window. On the sides are two sidebars for Navigation and Details. The Navigation bar has its own filter at the bottom of the window. Choosing something in the Navigation sidebar changes the content of the main content area and the Details sidebar. Each sidebar can be shown or hidden. Then there's the main content area. This area saves your navigation history so you can move back and forward. There's also a selection path bar, which shows the entire path of the current resource.
Across the top of your tabs is the toolbar with docking options, a refresh button, a download button, a dashboard of page statistics, a global search bar, to search across all resources, and an element selection button. If you select an element, you will be taken to our first tab, the Elements tab. The Elements tab's main content is an editable DOM tree outline. The Details sidebar has three sections. The Nodes section shows additional information relating to the selected node. The Styles section has three views: Computed, Rules, and Visual. Styles lets you view and edit CSS properties. The layers section shows information about any compositing layers related to the selected element. You can navigate and edit the DOM using the jump bar. Across the top is a series of buttons to enable the print style sheet, show shadow DOM nodes, show compositing borders, and enable paint flashing. Next is the Network tab. This tab shows all the resources loaded by the current webpage. In addition to the default tab features, there are buttons to disable the cache and clear network items. To see headers, check the Details sidebar. To see the selected resource, click on the jump arrow next to the list item. Next is the Resources tab. This tab, like the Network tab also shows a list of resources and has default tab features. In addition, it has three buttons to examine your code. The pretty print tool unminifies your code. Type profiling annotates objects in your code with color-coded types. Code coverage dims code that hasn't been executed. The Timelines tab helps you check the performance of your webpage. Select your instruments and record events like a reload operation with the record timeline button. Once you stop recording, you can examine your timeline data either by events or captured frames. For more details, click on one of the instruments you recorded: Network Requests, Layout and Rendering, JavaScript and Events, Memory, or JavaScript Allocations. To clear your timeline, click the clear timeline button.
The Debugger includes many of the same tools in the Resource tab. It also has a Breakpoints sections in the left sidebar and a Scope Chain in the right sidebar. The Debugger controls to disable breakpoints and pause, continue, and step through your code, are in the top left corner of the tab. The Storage tab shows a persistent state that is available to web content being inspected, which can be refreshed. By default, it shows Cookies, Local Storage, and Session Storage. But as available, this tab also shows additional storage APIs, like WebSQL, IndexedDB, and Application Cache. Last is the Console. Besides showing messages logged by web content, this tab has buttons. To filter the console log, clear the console log and trigger garbage collection. For additional options, like log persistence, go to the Settings tab at the end of the tabs row. In summary, you can access Web Inspector by enabling the Develop Menu in Safari. Use Web Inspector to examine your webpages in Safari. To try the latest version of Web Inspector, download the Safari Technology Preview from the Apple Developer site. If you find bugs, report them at bugreport.apple.com. For more information and additional resources about Web Inspector, use the links in the resources section associated with this video. And that's your quick walkthrough of Web Inspector. Thanks for watching.
-