
What’s new in Xcode
Explore the tools to build the next great apps and games.
Xcode 27
Bring your ideas to life faster using coding agents in Xcode, powered by the model of your choice. Customize Xcode to the way you work. Manage all your devices in one place with Device Hub. Refine your apps further with updates to performance and testing tools. And bring your app to even more people around the world with enhancements to localization.
Xcode's coding assistant now supports multiple ways of working with agents, adapting to wherever you are in the development process. Whether you're generating an initial prototype, filling in implementation details, or polishing the final experience, agents can take on the right level of work at each stage. The coding assistant keeps you focused on the decisions that matter, like architecture, design, and the details that define your app, while handling repetitive or mechanical tasks in the background. Agents work equally well whether you're building solo or collaborating with a team, fitting naturally into existing workflows without requiring you to change how you work.


Simplify your localization efforts
Use coding agents to perform tasks like adding languages, updating string catalogs, and translating strings. Review translated output and iterate on your localizations — adding language-specific plural variants using the context of your app. Xcode provides context and language-specific style guidelines to agents so you can deliver a tailored experience to people around the world.

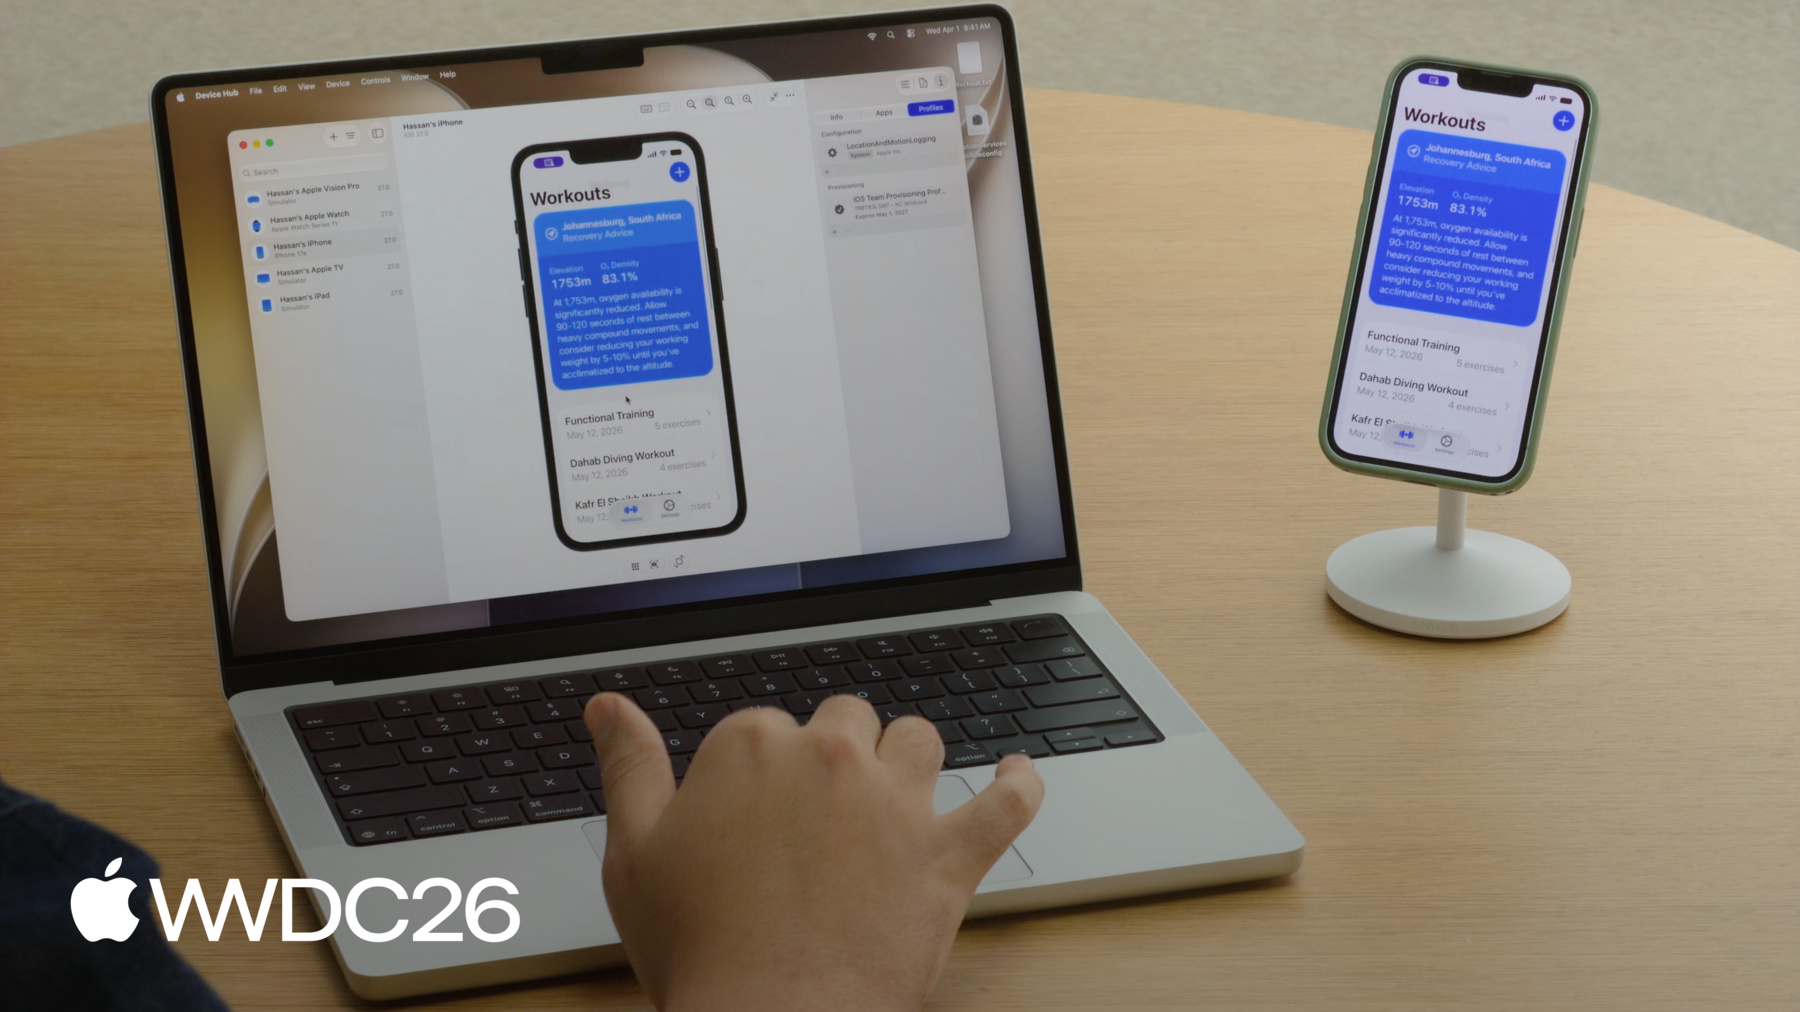
Device Hub
Device Hub accelerates your development workflows by bringing devices and simulators together in one place, without leaving your development environment. Quickly diagnose and reproduce issues, inspect device state, and streamline testing.
Instruments
Diagnose and resolve app responsiveness issues faster than ever with a refined workflow in Instruments. The Swift Concurrency instrument gives you visibility into async task scheduling, actor contention, and thread usage — making it easier to spot where concurrency is working against you. Time Profiler continues to be the go-to tool for identifying CPU bottlenecks, and System Trace provides a deeper system-level view when you need to understand how your app interacts with the OS, threads, and hardware resources.
New enhancements to top functions let you quickly surface the heaviest call stacks in your trace, and run comparisons make it straightforward to measure the impact of your changes side by side, so you can confirm a fix is actually working before shipping. Together, these tools form a clear, repeatable cycle: profile, identify, fix, and verify. Additional improvements across Instruments reduce the time spent in each step of that cycle, helping you deliver a smoother experience in less time.
Features are subject to change. Some capabilities and services may not be available in all regions or all languages; some feature availability may vary due to local laws and regulations.