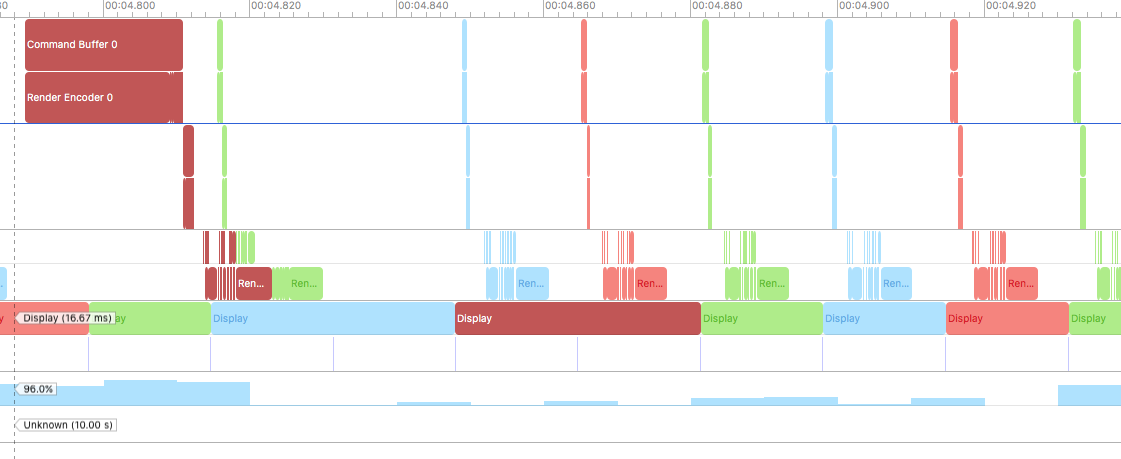
I am trying to figure out why our game cannot hit a 100% steady 60 FPS in the Core Animation FPS inspector. It seems to run at several 'ticks' at 60, then there is one 59, then a few 60s, etc. So I turned to the Metal Trace tool and indeed I can find a couple of "Surface was displayed for 33.xx ms" events. But by looking at the trace, I do not understand *why* this frame is displayed for that time. See the screenshot:
Edit: The image does not show up on the forums, so here is a direct link: http://storage.firigames.com/public/dev/dropped_frames.png
The selected red trace obviously has a very slow encoding step (for unknown reasons, the frames do not vary that dramatically), but by looking at the trace it seems that it should have been finished in time for vsync. Instead, the blue frame is displayed for two vsyncs, and then the red one is displayed for another two vsyncs, even though the next green frame is already finished. Anyone have some insight in what is happening here?
All recording on iOS 10 beta 6, using an iPad Pro 9.7".