-
Recherchez et résolvez les problèmes de performances dans vos jeux Metal
Traquez les problèmes de performances de jeu difficiles à identifier grâce à de puissants outils Metal. Découvrez comment collecter des données de performances riches à l'aide de Game Performance Overview dans Instruments, exécuter des traces en arrière-plan avec metalperftrace sur macOS et le centre de contrôle sur iOS, et utiliser la nouvelle API StateReporting pour corréler directement les métriques à l'état d'exécution de votre jeu. Transformez des heures de télémétrie en informations claires et exploitables.
Chapitres
- 0:00 - Introduction
- 1:51 - Métriques de performance Metal
- 3:32 - Collecte de traces
- 6:38 - Analyser les traces de performances
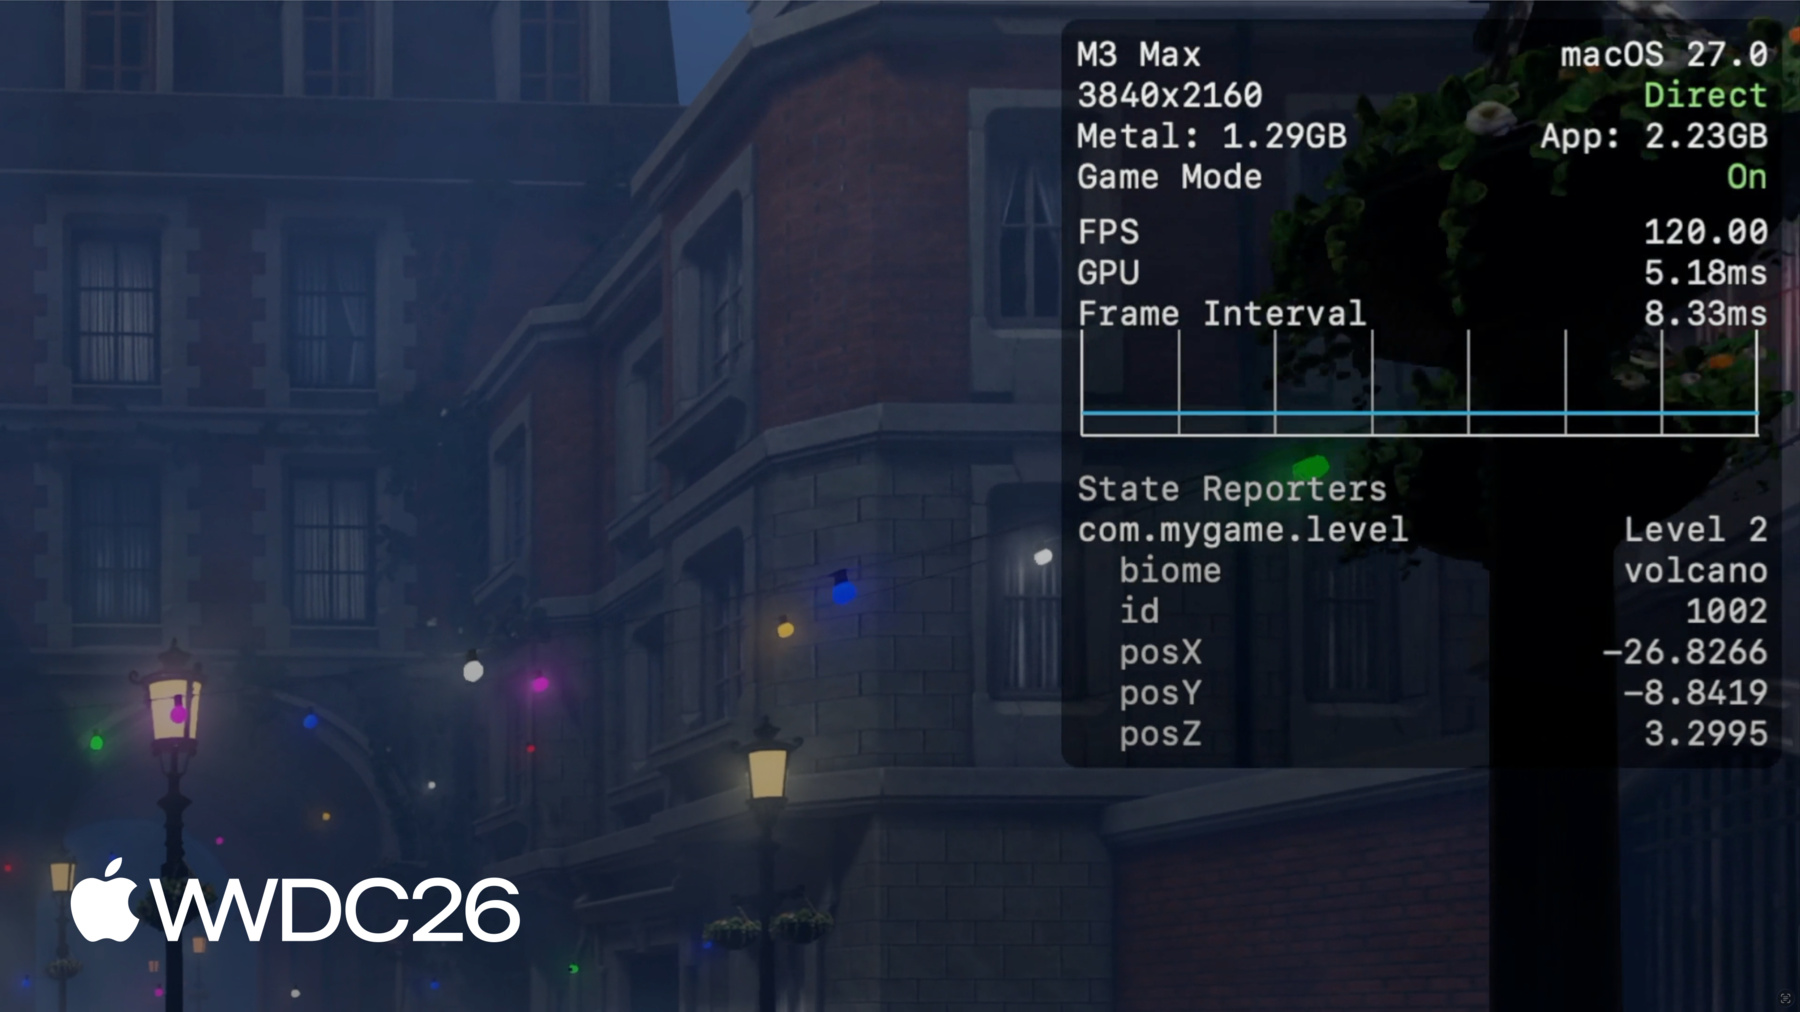
- 10:08 - Contextualiser avec StateReporting
- 17:48 - Collecter des données de terrain avec MetricKit
- 19:41 - Étapes suivantes
Ressources
- Understanding the Metal Performance HUD metrics
- Monitoring your Metal app’s graphics performance
- Getting started with StateReporting
- Metal debugger
Vidéos connexes
Tech Talks
-
Rechercher dans cette vidéo…
-
-
5:00 - Collect a trace with metalperftrace
# Collect the last 5 hours metalperftrace collect /tmp --last 5h # Output # Metal performance traces collected to: /tmp # /tmp/MetalPerfTrace_20260401_094100_to_144100.atrc # Or collect an explicit time range metalperftrace collect /tmp \ --start 2026-04-01T09:41:00 \ --end 2026-04-01T12:41:00 -
7:02 - Print a trace overview
metalperftrace overview /Data/MyGameTrace.atrc # [Modern Renderer pid:13833] # Mem: 2146.1 MiB (2343.9 Peak, 1199.4 Metal) # Total CPU Time: 2417.601s (33.17% Sys, 66.83% User) # Instructions: 9944836683668 (5.75% P, 94.25% E) # Cycles: 5176430469224 (4.45% P, 95.55% E) # Disk Reads / Writes: 317.37 / 0.04 MiB (Logical Write 0.04) # Layer 0x729293000 (3456x2104) Interval 300.065s Active 300.065s # 59.7 FPS 17735 Frames 188 Skipped # Frame Time avg: 16.74ms min: 8.33 max: 125.00 stddev: 3.70 # CPU Begin-to-Present avg: 3.99ms min: 1.40 max: 94.37 stddev: 1.80 # On-GPU Time avg: 13.39ms min: 5.24 max: 37.57 stddev: 1.43 # Next Drawable Wait avg: 0.26ms min: 0.00 max: 91.08 stddev: 1.75 # Shader Compilation Time: 0.000s (Total: 0, Cached: 18) -
7:58 - Filter by process and emit JSON
// Report state transitions #import <StateReporting/StateReporting.h> NSString *domain = @"com.mygame.level"; SRStateReporter *reporter = [SRStateReporter reporterForDomain:domain]; [reporter reportTransitionToStateLabel:@"Level 1" stableMetadata:nil volatileMetadata:nil]; [reporter reportTransitionToStateLabel:@"Level 1" stableMetadata:@{ @"id": @1001 } volatileMetadata:nil]; [reporter reportVolatileMetadataUpdate:@{ @"health": @100 }]; -
13:55 - Include full state transitions in overview
metalperftrace overview /Data/MyGameTrace.atrc --include-state-transitions # [States] # com.mygame.graphics # High (30.59%, 14.996s) raytracing: 1 shadow: ultra # Medium (69.38%, 34.012s) raytracing: 0 shadow: medium # com.mygame.level # Level 1 (20.47%, 10.033s) biome: forest id: 1001 # Level 2 (79.53%, 38.991s) biome: volcano id: 1002 -
14:15 - Aggregate metrics by state
# Aggregate across all domains / transitions
metalperftrace overview /Data/MyGameTrace.atrc --aggregate

# Aggregate one domain
metalperftrace overview /Data/MyGameTrace.atrc --aggregate \
  --domain com.mygame.graphics

# Aggregate a specific state label within a domain
metalperftrace overview /Data/MyGameTrace.atrc --aggregate \
  --domain com.mygame.graphics \
  --state-label "High"
-