-
Leve o Swift Charts para a terceira dimensão
Saiba como transformar seus gráficos 2D do Swift Charts em gráficos 3D com o Chart3D e visualizar seus conjuntos de dados de perspectivas completamente novas. Exiba seus dados em 3D, visualize superfícies matemáticas e personalize tudo, da câmera aos materiais, para deixar seus gráficos 3D mais intuitivos e agradáveis.
Para aproveitar ao máximo esta sessão, recomendamos que você esteja com a criação de gráficos 2D usando o Swift Charts.Capítulos
- 0:00 - Introdução
- 1:54 - Criar em 3D
- 5:05 - Gráficos de superfície
- 7:03 - Personalização
Recursos
Vídeos relacionados
WWDC24
WWDC22
-
Buscar neste vídeo...
-
-
2:03 - A scatterplot of a penguin's flipper length and weight
// A scatterplot of a penguin's flipper length and weight import SwiftUI import Charts struct PenguinChart: View { var body: some View { Chart(penguins) { penguin in PointMark( x: .value("Flipper Length", penguin.flipperLength), y: .value("Weight", penguin.weight) ) .foregroundStyle(by: .value("Species", penguin.species)) } .chartXAxisLabel("Flipper Length (mm)") .chartYAxisLabel("Weight (kg)") .chartXScale(domain: 160...240) .chartYScale(domain: 2...7) .chartXAxis { AxisMarks(values: [160, 180, 200, 220, 240]) { AxisTick() AxisGridLine() AxisValueLabel() } } .chartYAxis { AxisMarks(values: [2, 3, 4, 5, 6, 7]) { AxisTick() AxisGridLine() AxisValueLabel() } } } } -
2:39 - A scatterplot of a penguin's beak length and weight
// A scatterplot of a penguin's beak length and weight import SwiftUI import Charts struct PenguinChart: View { var body: some View { Chart(penguins) { penguin in PointMark( x: .value("Beak Length", penguin.beakLength), y: .value("Weight", penguin.weight) ) .foregroundStyle(by: .value("Species", penguin.species)) } .chartXAxisLabel("Beak Length (mm)") .chartYAxisLabel("Weight (kg)") .chartXScale(domain: 30...60) .chartYScale(domain: 2...7) .chartXAxis { AxisMarks(values: [30, 40, 50, 60]) { AxisTick() AxisGridLine() AxisValueLabel() } } .chartYAxis { AxisMarks(values: [2, 3, 4, 5, 6, 7]) { AxisTick() AxisGridLine() AxisValueLabel() } } } } -
2:51 - A scatterplot of a penguin's beak length and flipper length
// A scatterplot of a penguin's beak length and flipper length import SwiftUI import Charts struct PenguinChart: View { var body: some View { Chart(penguins) { penguin in PointMark( x: .value("Beak Length", penguin.beakLength), y: .value("Flipper Length", penguin.flipperLength) ) .foregroundStyle(by: .value("Species", penguin.species)) } .chartXAxisLabel("Beak Length (mm)") .chartYAxisLabel("Flipper Length (mm)") .chartXScale(domain: 30...60) .chartYScale(domain: 160...240) .chartXAxis { AxisMarks(values: [30, 40, 50, 60]) { AxisTick() AxisGridLine() AxisValueLabel() } } .chartYAxis { AxisMarks(values: [160, 180, 200, 220, 240]) { AxisTick() AxisGridLine() AxisValueLabel() } } } } -
3:28 - A scatterplot of a penguin's flipper length, beak length, and weight
// A scatterplot of a penguin's flipper length, beak length, and weight import SwiftUI import Charts struct PenguinChart: View { var body: some View { Chart3D(penguins) { penguin in PointMark( x: .value("Flipper Length", penguin.flipperLength), y: .value("Weight", penguin.weight), z: .value("Beak Length", penguin.beakLength) ) .foregroundStyle(by: .value("Species", penguin.species)) } .chartXAxisLabel("Flipper Length (mm)") .chartYAxisLabel("Weight (kg)") .chartZAxisLabel("Beak Length (mm)") .chartXScale(domain: 160...240, range: -0.5...0.5) .chartYScale(domain: 2...7, range: -0.5...0.5) .chartZScale(domain: 30...60, range: -0.5...0.5) .chartXAxis { AxisMarks(values: [160, 180, 200, 220, 240]) { AxisTick() AxisGridLine() AxisValueLabel() } } .chartYAxis { AxisMarks(values: [2, 3, 4, 5, 6, 7]) { AxisTick() AxisGridLine() AxisValueLabel() } } .chartZAxis { AxisMarks(values: [30, 40, 50, 60]) { AxisTick() AxisGridLine() AxisValueLabel() } } } } -
5:19 - A surface plot showing mathematical functions (x * z)
// A surface plot showing mathematical functions import SwiftUI import Charts var SurfacePlotChart: View { var body: some View { Chart3D { SurfacePlot(x: "X", y: "Y", z: "Z") { x, z in // (Double, Double) -> Double x * z } } } } -
5:43 - A surface plot showing mathematical functions
// A surface plot showing mathematical functions import SwiftUI import Charts var SurfacePlotChart: View { var body: some View { Chart3D { SurfacePlot(x: "X", y: "Y", z: "Z") { x, z in // (Double, Double) -> Double (sin(5 * x) + sin(5 * z)) / 2 } } } } -
5:46 - A surface plot showing mathematical functions (-z)
// A surface plot showing mathematical functions import SwiftUI import Charts var SurfacePlotChart: View { var body: some View { Chart3D { SurfacePlot(x: "X", y: "Y", z: "Z") { x, z in // (Double, Double) -> Double -z } } } } -
6:19 - Present a linear regression of the penguin data
// Present a linear regression of the penguin data import SwiftUI import Charts import CreateML import TabularData final class LinearRegression: Sendable { let regressor: MLLinearRegressor init<Data: RandomAccessCollection>( _ data: Data, x xPath: KeyPath<Data.Element, Double>, y yPath: KeyPath<Data.Element, Double>, z zPath: KeyPath<Data.Element, Double> ) { let x = Column(name: "X", contents: data.map { $0[keyPath: xPath] }) let y = Column(name: "Y", contents: data.map { $0[keyPath: yPath] }) let z = Column(name: "Z", contents: data.map { $0[keyPath: zPath] }) let data = DataFrame(columns: [x, y, z].map { $0.eraseToAnyColumn() }) regressor = try! MLLinearRegressor(trainingData: data, targetColumn: "Y") } func callAsFunction(_ x: Double, _ z: Double) -> Double { let x = Column(name: "X", contents: [x]) let z = Column(name: "Z", contents: [z]) let data = DataFrame(columns: [x, z].map { $0.eraseToAnyColumn() }) return (try? regressor.predictions(from: data))?.first as? Double ?? .nan } } let linearRegression = LinearRegression( penguins, x: \.flipperLength, y: \.weight, z: \.beakLength ) struct PenguinChart: some View { var body: some View { Chart3D { ForEach(penguins) { penguin in PointMark( x: .value("Flipper Length", penguin.flipperLength), y: .value("Weight", penguin.weight), z: .value("Beak Length", penguin.beakLength), ) .foregroundStyle(by: .value("Species", penguin.species)) } SurfacePlot(x: "Flipper Length", y: "Weight", z: "Beak Length") { flipperLength, beakLength in linearRegression(flipperLength, beakLength) } .foregroundStyle(.gray) } .chartXAxisLabel("Flipper Length (mm)") .chartYAxisLabel("Weight (kg)") .chartZAxisLabel("Beak Length (mm)") .chartXScale(domain: 160...240, range: -0.5...0.5) .chartYScale(domain: 2...7, range: -0.5...0.5) .chartZScale(domain: 30...60, range: -0.5...0.5) .chartXAxis { AxisMarks(values: [160, 180, 200, 220, 240]) { AxisTick() AxisGridLine() AxisValueLabel() } } .chartYAxis { AxisMarks(values: [2, 3, 4, 5, 6, 7]) { AxisTick() AxisGridLine() AxisValueLabel() } } .chartZAxis { AxisMarks(values: [30, 40, 50, 60]) { AxisTick() AxisGridLine() AxisValueLabel() } } } } -
7:50 - Adjust the initial chart pose (Default)
// Adjust the initial chart pose import SwiftUI import Charts struct PenguinChart: View { @State var pose: Chart3DPose = .default var body: some View { Chart3D(penguins) { penguin in PointMark( x: .value("Flipper Length", penguin.flipperLength), y: .value("Weight", penguin.weight), z: .value("Beak Length", penguin.beakLength) ) .foregroundStyle(by: .value("Species", penguin.species)) } .chart3DPose($pose) .chartXAxisLabel("Flipper Length (mm)") .chartYAxisLabel("Weight (kg)") .chartZAxisLabel("Beak Length (mm)") .chartXScale(domain: 160...240, range: -0.5...0.5) .chartYScale(domain: 2...7, range: -0.5...0.5) .chartZScale(domain: 30...60, range: -0.5...0.5) .chartXAxis { AxisMarks(values: [160, 180, 200, 220, 240]) { AxisTick() AxisGridLine() AxisValueLabel() } } .chartYAxis { AxisMarks(values: [2, 3, 4, 5, 6, 7]) { AxisTick() AxisGridLine() AxisValueLabel() } } .chartZAxis { AxisMarks(values: [30, 40, 50, 60]) { AxisTick() AxisGridLine() AxisValueLabel() } } } } -
8:02 - Adjust the initial chart pose (Front)
// Adjust the initial chart pose import SwiftUI import Charts struct PenguinChart: View { @State var pose: Chart3DPose = .front var body: some View { Chart3D(penguins) { penguin in PointMark( x: .value("Flipper Length", penguin.flipperLength), y: .value("Weight", penguin.weight), z: .value("Beak Length", penguin.beakLength) ) .foregroundStyle(by: .value("Species", penguin.species)) } .chart3DPose($pose) .chartXAxisLabel("Flipper Length (mm)") .chartYAxisLabel("Weight (kg)") .chartZAxisLabel("Beak Length (mm)") .chartXScale(domain: 160...240, range: -0.5...0.5) .chartYScale(domain: 2...7, range: -0.5...0.5) .chartZScale(domain: 30...60, range: -0.5...0.5) .chartXAxis { AxisMarks(values: [160, 180, 200, 220, 240]) { AxisTick() AxisGridLine() AxisValueLabel() } } .chartYAxis { AxisMarks(values: [2, 3, 4, 5, 6, 7]) { AxisTick() AxisGridLine() AxisValueLabel() } } .chartZAxis { AxisMarks(values: [30, 40, 50, 60]) { AxisTick() AxisGridLine() AxisValueLabel() } } } } -
8:09 - Adjust the initial chart pose (Custom)
// Adjust the initial chart pose import SwiftUI import Charts struct PenguinChart: View { @State var pose = Chart3DPose( azimuth: .degrees(20), inclination: .degrees(7) ) var body: some View { Chart3D(penguins) { penguin in PointMark( x: .value("Flipper Length", penguin.flipperLength), y: .value("Weight", penguin.weight), z: .value("Beak Length", penguin.beakLength) ) .foregroundStyle(by: .value("Species", penguin.species)) } .chart3DPose($pose) .chartXAxisLabel("Flipper Length (mm)") .chartYAxisLabel("Weight (kg)") .chartZAxisLabel("Beak Length (mm)") .chartXScale(domain: 160...240, range: -0.5...0.5) .chartYScale(domain: 2...7, range: -0.5...0.5) .chartZScale(domain: 30...60, range: -0.5...0.5) .chartXAxis { AxisMarks(values: [160, 180, 200, 220, 240]) { AxisTick() AxisGridLine() AxisValueLabel() } } .chartYAxis { AxisMarks(values: [2, 3, 4, 5, 6, 7]) { AxisTick() AxisGridLine() AxisValueLabel() } } .chartZAxis { AxisMarks(values: [30, 40, 50, 60]) { AxisTick() AxisGridLine() AxisValueLabel() } } } } -
9:15 - Adjust the initial chart pose and camera projection
// Adjust the initial chart pose and camera projection import SwiftUI import Charts struct PenguinChart: View { @State var pose = Chart3DPose( azimuth: .degrees(20), inclination: .degrees(7) ) var body: some View { Chart3D(penguins) { penguin in PointMark( x: .value("Flipper Length", penguin.flipperLength), y: .value("Weight", penguin.weight), z: .value("Beak Length", penguin.beakLength) ) .foregroundStyle(by: .value("Species", penguin.species)) } .chart3DPose($pose) .chart3DCameraProjection(.perspective) .chartXAxisLabel("Flipper Length (mm)") .chartYAxisLabel("Weight (kg)") .chartZAxisLabel("Beak Length (mm)") .chartXScale(domain: 160...240, range: -0.5...0.5) .chartYScale(domain: 2...7, range: -0.5...0.5) .chartZScale(domain: 30...60, range: -0.5...0.5) .chartXAxis { AxisMarks(values: [160, 180, 200, 220, 240]) { AxisTick() AxisGridLine() AxisValueLabel() } } .chartYAxis { AxisMarks(values: [2, 3, 4, 5, 6, 7]) { AxisTick() AxisGridLine() AxisValueLabel() } } .chartZAxis { AxisMarks(values: [30, 40, 50, 60]) { AxisTick() AxisGridLine() AxisValueLabel() } } } } -
9:24 - Customize the surface styles for a sinc function
// Customize the surface styles for a sinc function import SwiftUI import Charts struct SurfacePlotChart: View { var body: some View { Chart3D { SurfacePlot(x: "X", y: "Y", z: "Z") { x, z in let h = hypot(x, z) return sin(h) / h } } .chartXScale(domain: -10...10, range: -0.5...0.5) .chartZScale(domain: -10...10, range: -0.5...0.5) .chartYScale(domain: -0.23...1, range: -0.5...0.5) } } -
9:29 - Customize the surface styles for a sinc function (EllipticalGradient)
// Customize the surface styles for a sinc function import SwiftUI import Charts struct SurfacePlotChart: View { var body: some View { Chart3D { SurfacePlot(x: "X", y: "Y", z: "Z") { x, z in let h = hypot(x, z) return sin(h) / h } .foregroundStyle(EllipticalGradient(colors: [.red, .orange, .yellow, .green, .blue, .indigo, .purple])) } .chartXScale(domain: -10...10, range: -0.5...0.5) .chartZScale(domain: -10...10, range: -0.5...0.5) .chartYScale(domain: -0.23...1, range: -0.5...0.5) } } -
9:38 - Customize the surface styles for a sinc function (heightBased)
// Customize the surface styles for a sinc function import SwiftUI import Charts struct SurfacePlotChart: View { var body: some View { Chart3D { SurfacePlot(x: "X", y: "Y", z: "Z") { x, z in let h = hypot(x, z) return sin(h) / h } .foregroundStyle(.heightBased) } .chartXScale(domain: -10...10, range: -0.5...0.5) .chartZScale(domain: -10...10, range: -0.5...0.5) .chartYScale(domain: -0.23...1, range: -0.5...0.5) } } -
9:47 - Customize the surface styles for a sinc function (normalBased)
// Customize the surface styles for a sinc function

import SwiftUI
import Charts

struct SurfacePlotChart: View {
  var body: some View {
    Chart3D {
      SurfacePlot(x: "X", y: "Y", z: "Z") { x, z in
        let h = hypot(x, z)
        return sin(h) / h
      }
      .foregroundStyle(.normalBased)
    }
    .chartXScale(domain: -10...10, range: -0.5...0.5)
    .chartZScale(domain: -10...10, range: -0.5...0.5)
    .chartYScale(domain: -0.23...1, range: -0.5...0.5)
  }
}
-
-
- 0:00 - Introdução
O Swift Charts é compatível com gráficos 3D no iOS, macOS e visionOS 26. Crie visualizações em 3D que permitam que as pessoas explorem dados sob novas perspectivas.
- 1:54 - Criar em 3D
A abordagem de criação de um gráfico 3D é semelhante à de gráficos 2D. Explore como um único gráfico 3D pode representar várias perspectivas de gráficos 2D. Crie um gráfico de dispersão 3D com o PointMark e Chart3D. Gráficos 3D são interativos e podem ser girados para revelar diferentes informações, como clusters de dados. Muitas elementos gráficos usados em gráficos 2D foram reformulados para uso em 3D.
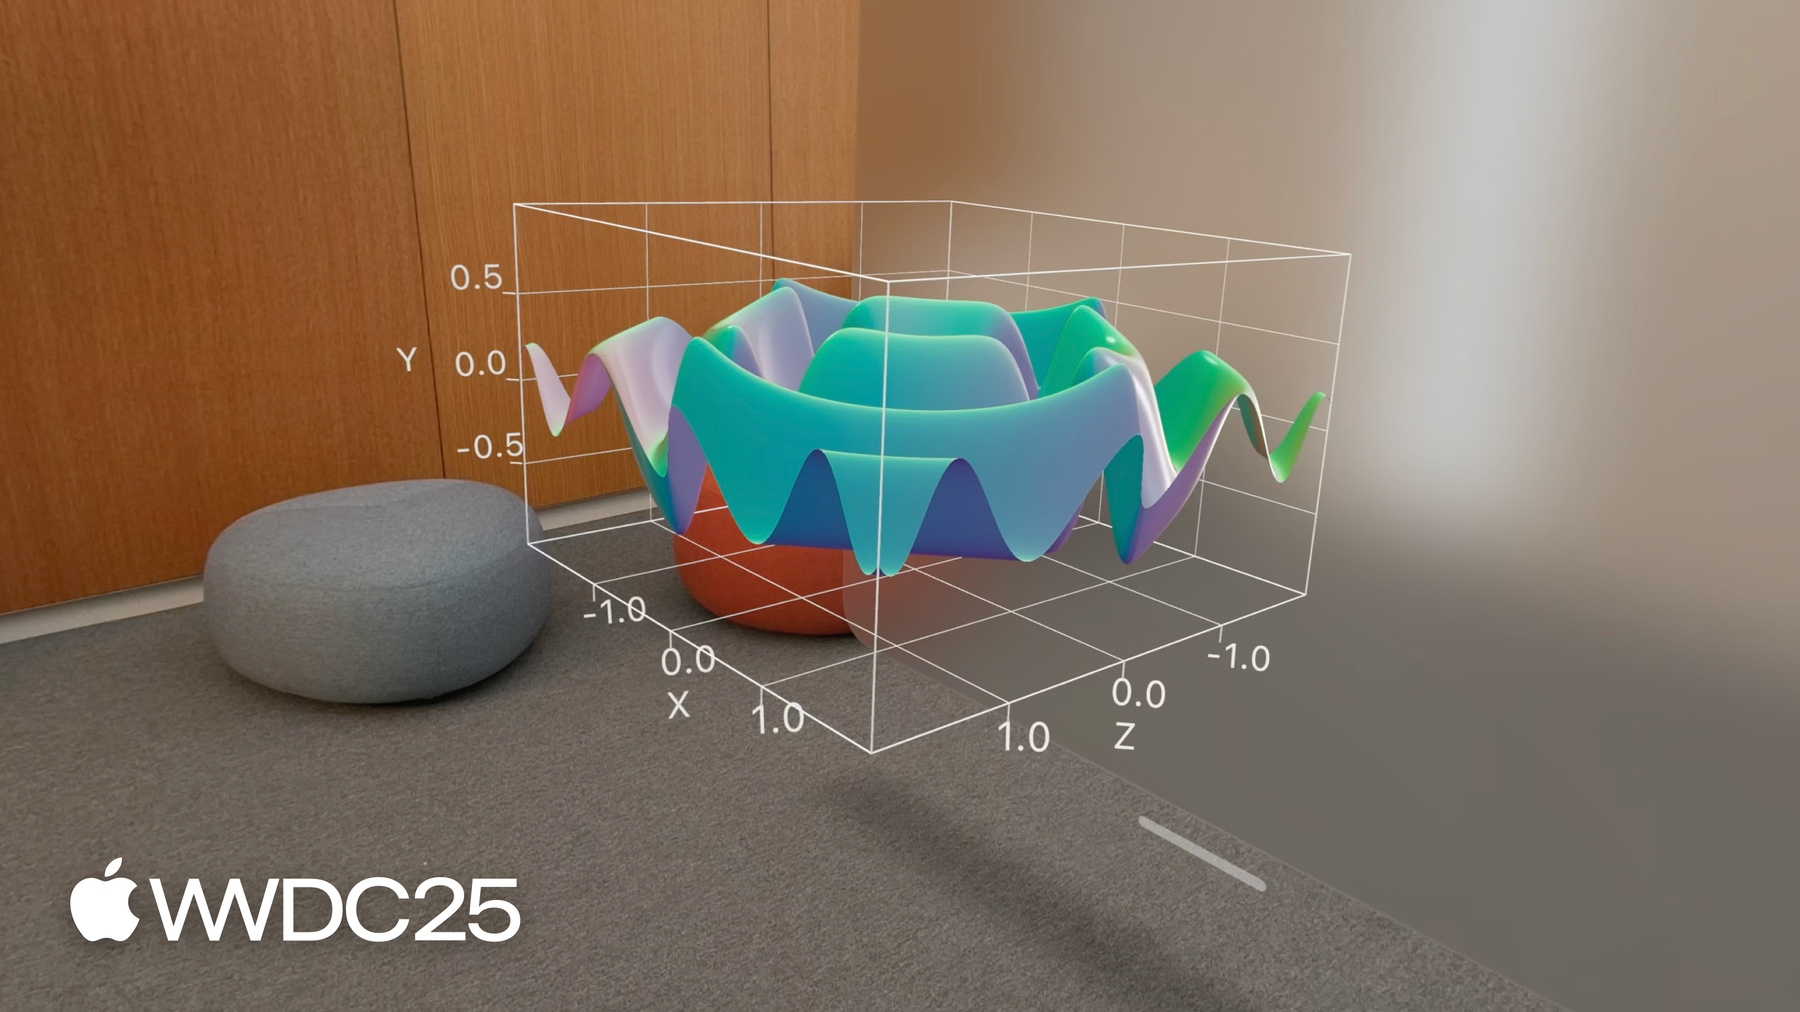
- 5:05 - Gráficos de superfície
SurfacePlot plota funções de 2 variáveis em 3D, criando uma superfície contínua. Forneça uma expressão que produza um valor y em termos de x e z. Essas superfícies podem ser simples, como um plano, ou mais complexas com formas interessantes.
- 7:03 - Personalização
O Swift Charts tem modificadores para personalizar a aparência de gráficos 3D. Defina o ângulo de visualização do gráfico com o modificador chart3DPose. Especifique o comportamento 3D do gráfico com o modificador chart3DCameraProjection. Há também novos estilos de primeiro plano para gráficos de superfície. Altere a cor em pontos posicionados no ângulo da superfície em um ponto específico, ou de acordo com a altura relativa. Essas técnicas, bem como muitos modificadores de gráficos 2D, personalizam gráficos 3D para torná-los visualmente atraentes.