-
Explore pie charts and interactivity in Swift Charts
Swift Charts has come full circle: Get ready to bake up pie and donut charts in your app with the latest improvements to the framework. Learn how to make your charts scrollable, explore the chart selection API for revealing additional details in your data, and find out how enabling additional interactivity can make your charts even more delightful.
Chapitres
- 0:20 - Pie charts
- 4:22 - Selection
- 7:49 - Scrolling
Ressources
Vidéos connexes
WWDC23
-
Rechercher dans cette vidéo…
-
-
2:06 - Stacked bar chart
Chart(data, id: \.name) { element in BarMark( x: .value("Sales", element.sales), stacking: .normalized ) .foregroundStyle(by: .value("Name", element.name)) } .chartXAxis(.hidden) -
2:44 - Pie chart
Chart(data, id: \.name) { element in SectorMark( angle: .value("Sales", element.sales) ) .foregroundStyle(by: .value("Name", element.name)) } -
3:05 - Pie chart with angular inset
Chart(data, id: \.name) { element in SectorMark( angle: .value("Sales", element.sales), angularInset: 1.5 ) .foregroundStyle(by: .value("Name", element.name)) } -
3:06 - Pie chart with corner radius
Chart(data, id: \.name) { element in SectorMark( angle: .value("Sales", element.sales), angularInset: 1.5 ) .cornerRadius(5) .foregroundStyle(by: .value("Name", element.name)) } -
3:33 - Donut chart
Chart(data, id: \.name) { element in SectorMark( angle: .value("Sales", element.sales), innerRadius: .ratio(0.618), angularInset: 1.5 ) .cornerRadius(5) .foregroundStyle(by: .value("Name", element.name)) } -
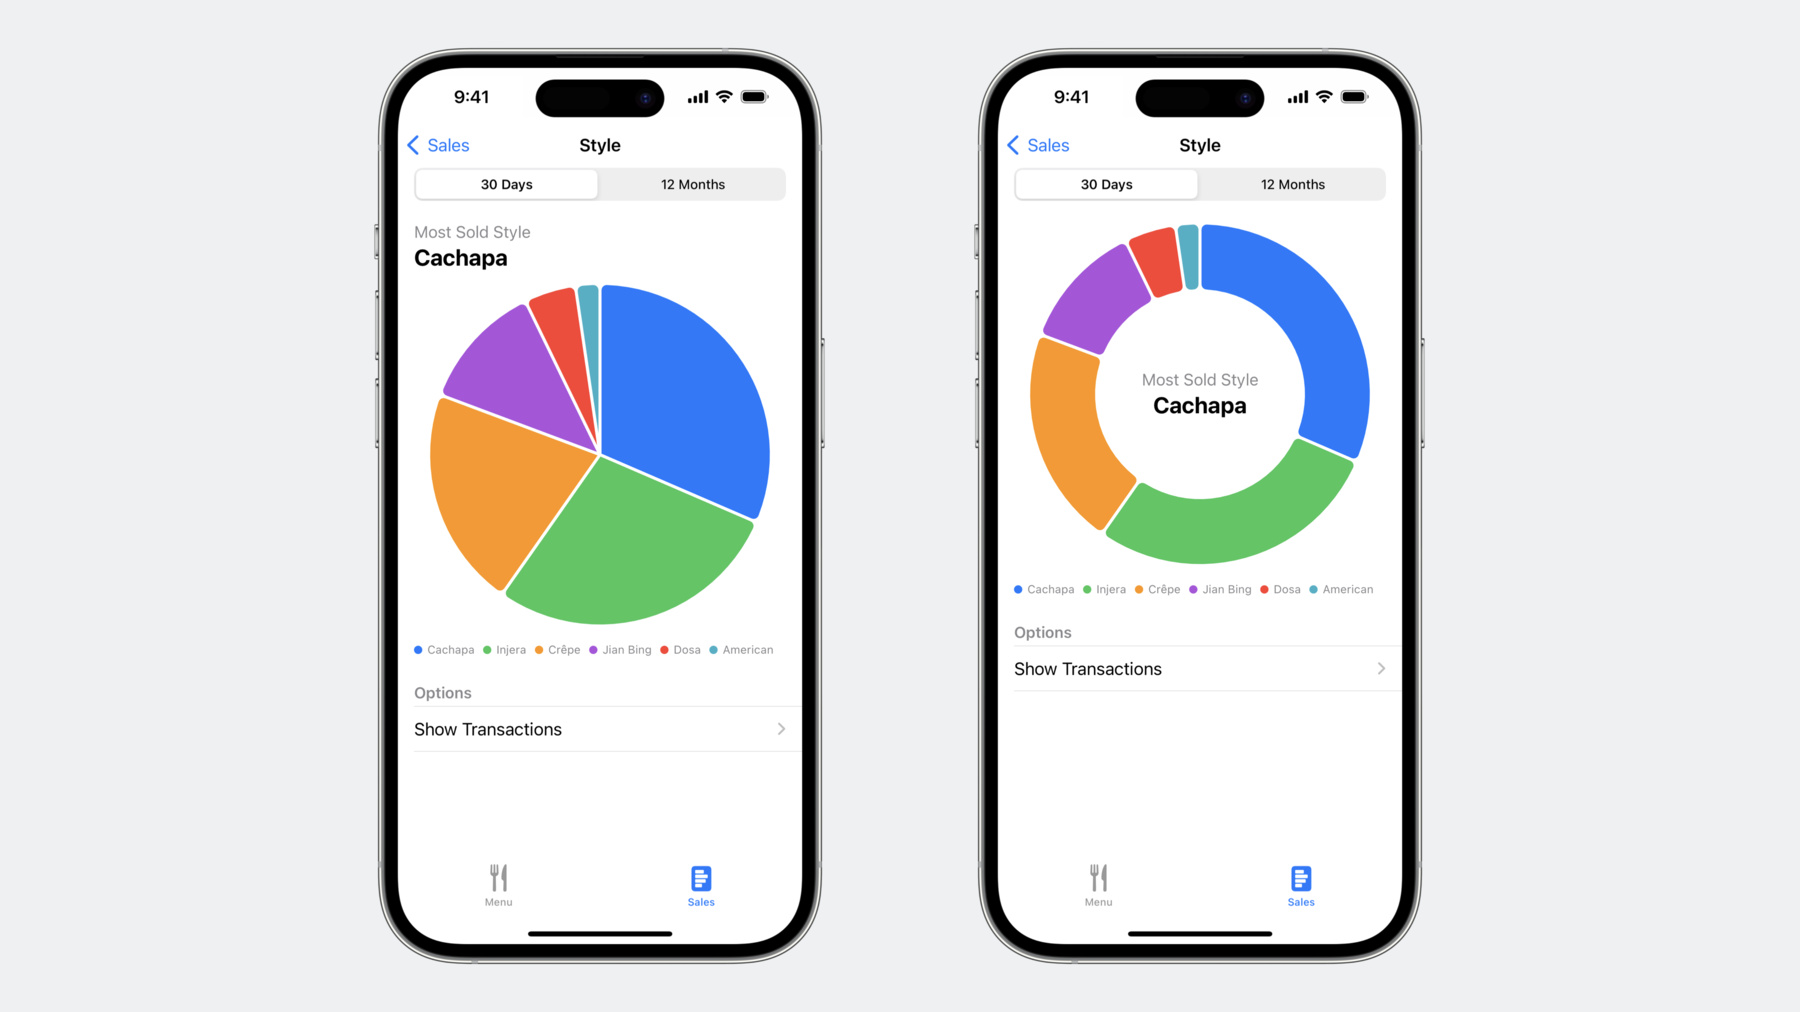
4:02 - Donut chart with text in the center
Chart(data, id: \.name) { element in SectorMark( angle: .value("Sales", element.sales), innerRadius: .ratio(0.618), angularInset: 1.5 ) .cornerRadius(5) .foregroundStyle(by: .value("Name", element.name)) } .chartBackground { chartProxy in GeometryReader { geometry in let frame = geometry[chartProxy.plotAreaFrame] VStack { Text("Most Sold Style") .font(.callout) .foregroundStyle(.secondary) Text(mostSold) .font(.title2.bold()) .foregroundColor(.primary) } .position(x: frame.midX, y: frame.midY) } } -
5:14 - Chart visualizing average sales by city
struct LocationDetailsChart: View { ... var body: some View { Chart { ForEach(data) { series in ForEach(series.sales, id: \.day) { element in LineMark( x: .value("Day", element.day, unit: .day), y: .value("Sales", element.sales) ) } .foregroundStyle(by: .value("City", series.city)) .symbol(by: .value("City", series.city)) .interpolationMethod(.catmullRom) } } ... } } -
5:39 - Chart selection modifier
struct LocationDetailsChart: View { @Binding var rawSelectedDate: Date? var body: some View { Chart { ForEach(data) { series in ForEach(series.sales, id: \.day) { element in LineMark( x: .value("Day", element.day, unit: .day), y: .value("Sales", element.sales) ) } .foregroundStyle(by: .value("City", series.city)) .symbol(by: .value("City", series.city)) .interpolationMethod(.catmullRom) } } .chartXSelection(value: $rawSelectedDate) } } -
5:47 - Processing raw selected date from chart selection binding
struct LocationDetailsChart: View { @Binding var rawSelectedDate: Date? var selectedDate: Date? { guard let rawSelectedDate else { return nil } return data.first?.sales.first(where: { let endOfDay = endOfDay(for: $0.day) return ($0.day ... endOfDay).contains(rawSelectedDate) })?.day } var body: some View { Chart { ForEach(data) { series in ForEach(series.sales, id: \.day) { element in LineMark( x: .value("Day", element.day, unit: .day), y: .value("Sales", element.sales) ) } .foregroundStyle(by: .value("City", series.city)) .symbol(by: .value("City", series.city)) .interpolationMethod(.catmullRom) } } .chartXSelection(value: $rawSelectedDate) } } -
6:06 - Rule mark as selection indicator
Chart { ForEach(data) { series in ForEach(series.sales, id: \.day) { element in LineMark( x: .value("Day", element.day, unit: .day), y: .value("Sales", element.sales) ) } } if let selectedDate { RuleMark( x: .value("Selected", selectedDate, unit: .day) ) .foregroundStyle(Color.gray.opacity(0.3)) .offset(yStart: -10) .zIndex(-1) } } .chartXSelection(value: $rawSelectedDate) -
6:20 - Selection popover
Chart { ForEach(data) { series in ForEach(series.sales, id: \.day) { element in LineMark( x: .value("Day", element.day, unit: .day), y: .value("Sales", element.sales) ) } } if let selectedDate { RuleMark( x: .value("Selected", selectedDate, unit: .day) ) .foregroundStyle(Color.gray.opacity(0.3)) .offset(yStart: -10) .zIndex(-1) .annotation( position: .top, spacing: 0, overflowResolution: .init( x: .fit(to: .chart), y: .disabled ) ) { valueSelectionPopover } } } .chartXSelection(value: $rawSelectedDate) -
7:07 - Range selection
Chart(data) { series in ForEach(series.sales, id: \.day) { element in LineMark( x: .value("Day", element.day, unit: .day), y: .value("Sales", element.sales) ) } ... } .chartXSelection(value: $rawSelectedDate) .chartXSelection(range: $rawSelectedRange) -
7:22 - Overriding default selection gesture
Chart(data) { series in ForEach(series.sales, id: \.day) { element in LineMark( x: .value("Day", element.day, unit: .day), y: .value("Sales", element.sales) ) } ... } .chartXSelection(value: $rawSelectedDate) .chartGesture { proxy in DragGesture(minimumDistance: 0) .onChanged { proxy.selectXValue(at: $0.location.x) } .onEnded { _ in selectedDate = nil } } -
7:31 - Selection in pie charts and donut charts
Chart(data, id: \.name) { element in SectorMark( angle: .value("Sales", element.sales), innerRadius: .ratio(0.618), angularInset: 1.5 ) .cornerRadius(5) .foregroundStyle(by: .value("Name", element.name)) .opacity(element.name == selectedName ? 1.0 : 0.3) } .chartAngleSelection(value: $selectedAngle) -
7:54 - Daily sales chart
Chart { ForEach(SalesData.last365Days, id: \.day) { BarMark( x: .value("Day", $0.day, unit: .day), y: .value("Sales", $0.sales) ) } .foregroundStyle(.blue) } -
8:07 - Daily sales chart with a scrollable axis
Chart { ForEach(SalesData.last365Days, id: \.day) { BarMark( x: .value("Day", $0.day, unit: .day), y: .value("Sales", $0.sales) ) } .foregroundStyle(.blue) } .chartScrollableAxes(.horizontal) -
8:11 - Setting the visible domain for a scrollable chart
Chart { ForEach(SalesData.last365Days, id: \.day) { BarMark( x: .value("Day", $0.day, unit: .day), y: .value("Sales", $0.sales) ) } .foregroundStyle(.blue) } .chartScrollableAxes(.horizontal) .chartXVisibleDomain(length: 3600 * 24 * 30) -
8:18 - Chart scroll position
Chart { ForEach(SalesData.last365Days, id: \.day) { BarMark( x: .value("Day", $0.day, unit: .day), y: .value("Sales", $0.sales) ) } .foregroundStyle(.blue) } .chartScrollableAxes(.horizontal) .chartXVisibleDomain(length: 3600 * 24 * 30) .chartScrollPosition(x: $scrollPosition) -
8:50 - Snapping in a scrolling chart
Chart {
  ForEach(SalesData.last365Days, id: \.day) {
    BarMark(
      x: .value("Day", $0.day, unit: .day),
      y: .value("Sales", $0.sales)
    )
  }
  .foregroundStyle(.blue)
}
.chartScrollableAxes(.horizontal)
.chartXVisibleDomain(length: 3600 * 24 * 30)
.chartScrollPosition(x: $scrollPosition)
.chartScrollTargetBehavior(
  .valueAligned(
    matching: DateComponents(hour: 0),
    majorAlignment: .matching(DateComponents(day: 1))))
-