-
Metal Shader Debugging and Profiling
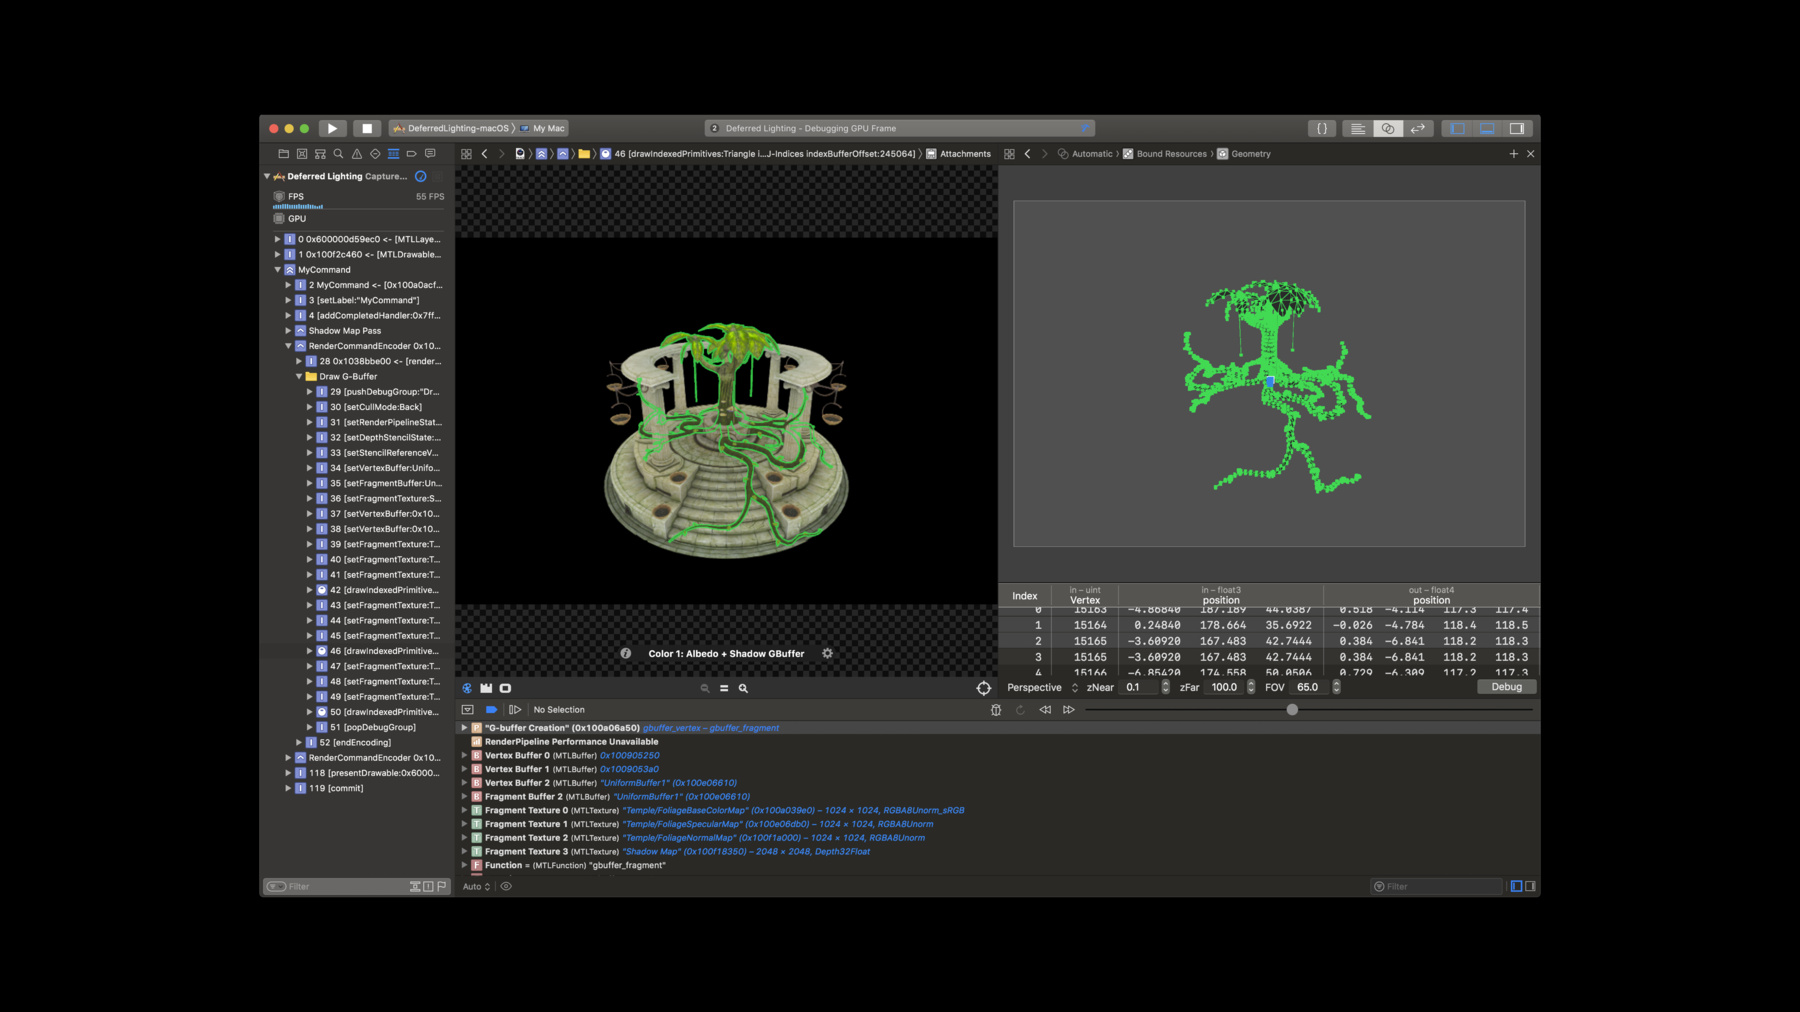
Metal provides powerful tools for analyzing shader behavior and optimizing performance. Dive into troubleshooting vertex-stage problems with new geometry viewing capabilities in Xcode. Use the shader debugger to step through vertex, fragment, and compute shader execution line-by-line. Get details about analyzing GPU workload, and check out shader profiler enhancements for A11 Bionic.
Recursos
- Optimizing GPU performance
- Debugging the shaders within a draw command or compute dispatch
- Analyzing resource dependencies
- Diapositivas de la presentación (PDF)
Videos relacionados
WWDC20
WWDC18
-
Buscar este video…
-