-
Lleva los gráficos Swift a la tercera dimensión
Aprende cómo llevar tus gráficos Swift 2D a la tercera dimensión con Chart3D y visualiza tus conjuntos de datos desde perspectivas completamente nuevas. Grafica tus datos en 3D, visualiza superficies matemáticas y personaliza todo, desde la cámara hasta los materiales, para que tus gráficos 3D sean más intuitivos y agradables.
Para aprovechar al máximo esta sesión, recomendamos familiarizarse con la creación de gráficos Swift 2D.Capítulos
- 0:00 - Introducción
- 1:54 - Trazado en 3D
- 5:05 - Gráfico de superficie
- 7:03 - Personalización
Recursos
Videos relacionados
WWDC24
WWDC22
-
Buscar este video…
-
-
2:03 - A scatterplot of a penguin's flipper length and weight
// A scatterplot of a penguin's flipper length and weight import SwiftUI import Charts struct PenguinChart: View { var body: some View { Chart(penguins) { penguin in PointMark( x: .value("Flipper Length", penguin.flipperLength), y: .value("Weight", penguin.weight) ) .foregroundStyle(by: .value("Species", penguin.species)) } .chartXAxisLabel("Flipper Length (mm)") .chartYAxisLabel("Weight (kg)") .chartXScale(domain: 160...240) .chartYScale(domain: 2...7) .chartXAxis { AxisMarks(values: [160, 180, 200, 220, 240]) { AxisTick() AxisGridLine() AxisValueLabel() } } .chartYAxis { AxisMarks(values: [2, 3, 4, 5, 6, 7]) { AxisTick() AxisGridLine() AxisValueLabel() } } } } -
2:39 - A scatterplot of a penguin's beak length and weight
// A scatterplot of a penguin's beak length and weight import SwiftUI import Charts struct PenguinChart: View { var body: some View { Chart(penguins) { penguin in PointMark( x: .value("Beak Length", penguin.beakLength), y: .value("Weight", penguin.weight) ) .foregroundStyle(by: .value("Species", penguin.species)) } .chartXAxisLabel("Beak Length (mm)") .chartYAxisLabel("Weight (kg)") .chartXScale(domain: 30...60) .chartYScale(domain: 2...7) .chartXAxis { AxisMarks(values: [30, 40, 50, 60]) { AxisTick() AxisGridLine() AxisValueLabel() } } .chartYAxis { AxisMarks(values: [2, 3, 4, 5, 6, 7]) { AxisTick() AxisGridLine() AxisValueLabel() } } } } -
2:51 - A scatterplot of a penguin's beak length and flipper length
// A scatterplot of a penguin's beak length and flipper length import SwiftUI import Charts struct PenguinChart: View { var body: some View { Chart(penguins) { penguin in PointMark( x: .value("Beak Length", penguin.beakLength), y: .value("Flipper Length", penguin.flipperLength) ) .foregroundStyle(by: .value("Species", penguin.species)) } .chartXAxisLabel("Beak Length (mm)") .chartYAxisLabel("Flipper Length (mm)") .chartXScale(domain: 30...60) .chartYScale(domain: 160...240) .chartXAxis { AxisMarks(values: [30, 40, 50, 60]) { AxisTick() AxisGridLine() AxisValueLabel() } } .chartYAxis { AxisMarks(values: [160, 180, 200, 220, 240]) { AxisTick() AxisGridLine() AxisValueLabel() } } } } -
3:28 - A scatterplot of a penguin's flipper length, beak length, and weight
// A scatterplot of a penguin's flipper length, beak length, and weight import SwiftUI import Charts struct PenguinChart: View { var body: some View { Chart3D(penguins) { penguin in PointMark( x: .value("Flipper Length", penguin.flipperLength), y: .value("Weight", penguin.weight), z: .value("Beak Length", penguin.beakLength) ) .foregroundStyle(by: .value("Species", penguin.species)) } .chartXAxisLabel("Flipper Length (mm)") .chartYAxisLabel("Weight (kg)") .chartZAxisLabel("Beak Length (mm)") .chartXScale(domain: 160...240, range: -0.5...0.5) .chartYScale(domain: 2...7, range: -0.5...0.5) .chartZScale(domain: 30...60, range: -0.5...0.5) .chartXAxis { AxisMarks(values: [160, 180, 200, 220, 240]) { AxisTick() AxisGridLine() AxisValueLabel() } } .chartYAxis { AxisMarks(values: [2, 3, 4, 5, 6, 7]) { AxisTick() AxisGridLine() AxisValueLabel() } } .chartZAxis { AxisMarks(values: [30, 40, 50, 60]) { AxisTick() AxisGridLine() AxisValueLabel() } } } } -
5:19 - A surface plot showing mathematical functions (x * z)
// A surface plot showing mathematical functions import SwiftUI import Charts var SurfacePlotChart: View { var body: some View { Chart3D { SurfacePlot(x: "X", y: "Y", z: "Z") { x, z in // (Double, Double) -> Double x * z } } } } -
5:43 - A surface plot showing mathematical functions
// A surface plot showing mathematical functions import SwiftUI import Charts var SurfacePlotChart: View { var body: some View { Chart3D { SurfacePlot(x: "X", y: "Y", z: "Z") { x, z in // (Double, Double) -> Double (sin(5 * x) + sin(5 * z)) / 2 } } } } -
5:46 - A surface plot showing mathematical functions (-z)
// A surface plot showing mathematical functions import SwiftUI import Charts var SurfacePlotChart: View { var body: some View { Chart3D { SurfacePlot(x: "X", y: "Y", z: "Z") { x, z in // (Double, Double) -> Double -z } } } } -
6:19 - Present a linear regression of the penguin data
// Present a linear regression of the penguin data import SwiftUI import Charts import CreateML import TabularData final class LinearRegression: Sendable { let regressor: MLLinearRegressor init<Data: RandomAccessCollection>( _ data: Data, x xPath: KeyPath<Data.Element, Double>, y yPath: KeyPath<Data.Element, Double>, z zPath: KeyPath<Data.Element, Double> ) { let x = Column(name: "X", contents: data.map { $0[keyPath: xPath] }) let y = Column(name: "Y", contents: data.map { $0[keyPath: yPath] }) let z = Column(name: "Z", contents: data.map { $0[keyPath: zPath] }) let data = DataFrame(columns: [x, y, z].map { $0.eraseToAnyColumn() }) regressor = try! MLLinearRegressor(trainingData: data, targetColumn: "Y") } func callAsFunction(_ x: Double, _ z: Double) -> Double { let x = Column(name: "X", contents: [x]) let z = Column(name: "Z", contents: [z]) let data = DataFrame(columns: [x, z].map { $0.eraseToAnyColumn() }) return (try? regressor.predictions(from: data))?.first as? Double ?? .nan } } let linearRegression = LinearRegression( penguins, x: \.flipperLength, y: \.weight, z: \.beakLength ) struct PenguinChart: some View { var body: some View { Chart3D { ForEach(penguins) { penguin in PointMark( x: .value("Flipper Length", penguin.flipperLength), y: .value("Weight", penguin.weight), z: .value("Beak Length", penguin.beakLength), ) .foregroundStyle(by: .value("Species", penguin.species)) } SurfacePlot(x: "Flipper Length", y: "Weight", z: "Beak Length") { flipperLength, beakLength in linearRegression(flipperLength, beakLength) } .foregroundStyle(.gray) } .chartXAxisLabel("Flipper Length (mm)") .chartYAxisLabel("Weight (kg)") .chartZAxisLabel("Beak Length (mm)") .chartXScale(domain: 160...240, range: -0.5...0.5) .chartYScale(domain: 2...7, range: -0.5...0.5) .chartZScale(domain: 30...60, range: -0.5...0.5) .chartXAxis { AxisMarks(values: [160, 180, 200, 220, 240]) { AxisTick() AxisGridLine() AxisValueLabel() } } .chartYAxis { AxisMarks(values: [2, 3, 4, 5, 6, 7]) { AxisTick() AxisGridLine() AxisValueLabel() } } .chartZAxis { AxisMarks(values: [30, 40, 50, 60]) { AxisTick() AxisGridLine() AxisValueLabel() } } } } -
7:50 - Adjust the initial chart pose (Default)
// Adjust the initial chart pose import SwiftUI import Charts struct PenguinChart: View { @State var pose: Chart3DPose = .default var body: some View { Chart3D(penguins) { penguin in PointMark( x: .value("Flipper Length", penguin.flipperLength), y: .value("Weight", penguin.weight), z: .value("Beak Length", penguin.beakLength) ) .foregroundStyle(by: .value("Species", penguin.species)) } .chart3DPose($pose) .chartXAxisLabel("Flipper Length (mm)") .chartYAxisLabel("Weight (kg)") .chartZAxisLabel("Beak Length (mm)") .chartXScale(domain: 160...240, range: -0.5...0.5) .chartYScale(domain: 2...7, range: -0.5...0.5) .chartZScale(domain: 30...60, range: -0.5...0.5) .chartXAxis { AxisMarks(values: [160, 180, 200, 220, 240]) { AxisTick() AxisGridLine() AxisValueLabel() } } .chartYAxis { AxisMarks(values: [2, 3, 4, 5, 6, 7]) { AxisTick() AxisGridLine() AxisValueLabel() } } .chartZAxis { AxisMarks(values: [30, 40, 50, 60]) { AxisTick() AxisGridLine() AxisValueLabel() } } } } -
8:02 - Adjust the initial chart pose (Front)
// Adjust the initial chart pose import SwiftUI import Charts struct PenguinChart: View { @State var pose: Chart3DPose = .front var body: some View { Chart3D(penguins) { penguin in PointMark( x: .value("Flipper Length", penguin.flipperLength), y: .value("Weight", penguin.weight), z: .value("Beak Length", penguin.beakLength) ) .foregroundStyle(by: .value("Species", penguin.species)) } .chart3DPose($pose) .chartXAxisLabel("Flipper Length (mm)") .chartYAxisLabel("Weight (kg)") .chartZAxisLabel("Beak Length (mm)") .chartXScale(domain: 160...240, range: -0.5...0.5) .chartYScale(domain: 2...7, range: -0.5...0.5) .chartZScale(domain: 30...60, range: -0.5...0.5) .chartXAxis { AxisMarks(values: [160, 180, 200, 220, 240]) { AxisTick() AxisGridLine() AxisValueLabel() } } .chartYAxis { AxisMarks(values: [2, 3, 4, 5, 6, 7]) { AxisTick() AxisGridLine() AxisValueLabel() } } .chartZAxis { AxisMarks(values: [30, 40, 50, 60]) { AxisTick() AxisGridLine() AxisValueLabel() } } } } -
8:09 - Adjust the initial chart pose (Custom)
// Adjust the initial chart pose import SwiftUI import Charts struct PenguinChart: View { @State var pose = Chart3DPose( azimuth: .degrees(20), inclination: .degrees(7) ) var body: some View { Chart3D(penguins) { penguin in PointMark( x: .value("Flipper Length", penguin.flipperLength), y: .value("Weight", penguin.weight), z: .value("Beak Length", penguin.beakLength) ) .foregroundStyle(by: .value("Species", penguin.species)) } .chart3DPose($pose) .chartXAxisLabel("Flipper Length (mm)") .chartYAxisLabel("Weight (kg)") .chartZAxisLabel("Beak Length (mm)") .chartXScale(domain: 160...240, range: -0.5...0.5) .chartYScale(domain: 2...7, range: -0.5...0.5) .chartZScale(domain: 30...60, range: -0.5...0.5) .chartXAxis { AxisMarks(values: [160, 180, 200, 220, 240]) { AxisTick() AxisGridLine() AxisValueLabel() } } .chartYAxis { AxisMarks(values: [2, 3, 4, 5, 6, 7]) { AxisTick() AxisGridLine() AxisValueLabel() } } .chartZAxis { AxisMarks(values: [30, 40, 50, 60]) { AxisTick() AxisGridLine() AxisValueLabel() } } } } -
9:15 - Adjust the initial chart pose and camera projection
// Adjust the initial chart pose and camera projection import SwiftUI import Charts struct PenguinChart: View { @State var pose = Chart3DPose( azimuth: .degrees(20), inclination: .degrees(7) ) var body: some View { Chart3D(penguins) { penguin in PointMark( x: .value("Flipper Length", penguin.flipperLength), y: .value("Weight", penguin.weight), z: .value("Beak Length", penguin.beakLength) ) .foregroundStyle(by: .value("Species", penguin.species)) } .chart3DPose($pose) .chart3DCameraProjection(.perspective) .chartXAxisLabel("Flipper Length (mm)") .chartYAxisLabel("Weight (kg)") .chartZAxisLabel("Beak Length (mm)") .chartXScale(domain: 160...240, range: -0.5...0.5) .chartYScale(domain: 2...7, range: -0.5...0.5) .chartZScale(domain: 30...60, range: -0.5...0.5) .chartXAxis { AxisMarks(values: [160, 180, 200, 220, 240]) { AxisTick() AxisGridLine() AxisValueLabel() } } .chartYAxis { AxisMarks(values: [2, 3, 4, 5, 6, 7]) { AxisTick() AxisGridLine() AxisValueLabel() } } .chartZAxis { AxisMarks(values: [30, 40, 50, 60]) { AxisTick() AxisGridLine() AxisValueLabel() } } } } -
9:24 - Customize the surface styles for a sinc function
// Customize the surface styles for a sinc function import SwiftUI import Charts struct SurfacePlotChart: View { var body: some View { Chart3D { SurfacePlot(x: "X", y: "Y", z: "Z") { x, z in let h = hypot(x, z) return sin(h) / h } } .chartXScale(domain: -10...10, range: -0.5...0.5) .chartZScale(domain: -10...10, range: -0.5...0.5) .chartYScale(domain: -0.23...1, range: -0.5...0.5) } } -
9:29 - Customize the surface styles for a sinc function (EllipticalGradient)
// Customize the surface styles for a sinc function import SwiftUI import Charts struct SurfacePlotChart: View { var body: some View { Chart3D { SurfacePlot(x: "X", y: "Y", z: "Z") { x, z in let h = hypot(x, z) return sin(h) / h } .foregroundStyle(EllipticalGradient(colors: [.red, .orange, .yellow, .green, .blue, .indigo, .purple])) } .chartXScale(domain: -10...10, range: -0.5...0.5) .chartZScale(domain: -10...10, range: -0.5...0.5) .chartYScale(domain: -0.23...1, range: -0.5...0.5) } } -
9:38 - Customize the surface styles for a sinc function (heightBased)
// Customize the surface styles for a sinc function import SwiftUI import Charts struct SurfacePlotChart: View { var body: some View { Chart3D { SurfacePlot(x: "X", y: "Y", z: "Z") { x, z in let h = hypot(x, z) return sin(h) / h } .foregroundStyle(.heightBased) } .chartXScale(domain: -10...10, range: -0.5...0.5) .chartZScale(domain: -10...10, range: -0.5...0.5) .chartYScale(domain: -0.23...1, range: -0.5...0.5) } } -
9:47 - Customize the surface styles for a sinc function (normalBased)
// Customize the surface styles for a sinc function

import SwiftUI
import Charts

struct SurfacePlotChart: View {
  var body: some View {
    Chart3D {
      SurfacePlot(x: "X", y: "Y", z: "Z") { x, z in
        let h = hypot(x, z)
        return sin(h) / h
      }
      .foregroundStyle(.normalBased)
    }
    .chartXScale(domain: -10...10, range: -0.5...0.5)
    .chartZScale(domain: -10...10, range: -0.5...0.5)
    .chartYScale(domain: -0.23...1, range: -0.5...0.5)
  }
}
-
-
- 0:00 - Introducción
Swift Charts admite gráficos 3D en iOS, macOS y visionOS 26. Crea visualizaciones 3D que permitan a las personas explorar datos desde nuevas perspectivas.
- 1:54 - Trazado en 3D
Hacer un gráfico 3D es similar al enfoque para hacer gráficos 2D. Explora cómo un solo gráfico 3D puede representar múltiples perspectivas de gráficos 2D. Construye un gráfico de dispersión 3D con PointMark y Chart3D. Los gráficos 3D son interactivos y se pueden rotar para revelar información diferente, como grupos de datos. Muchas marcas para gráficos 2D se reinventaron para 3D.
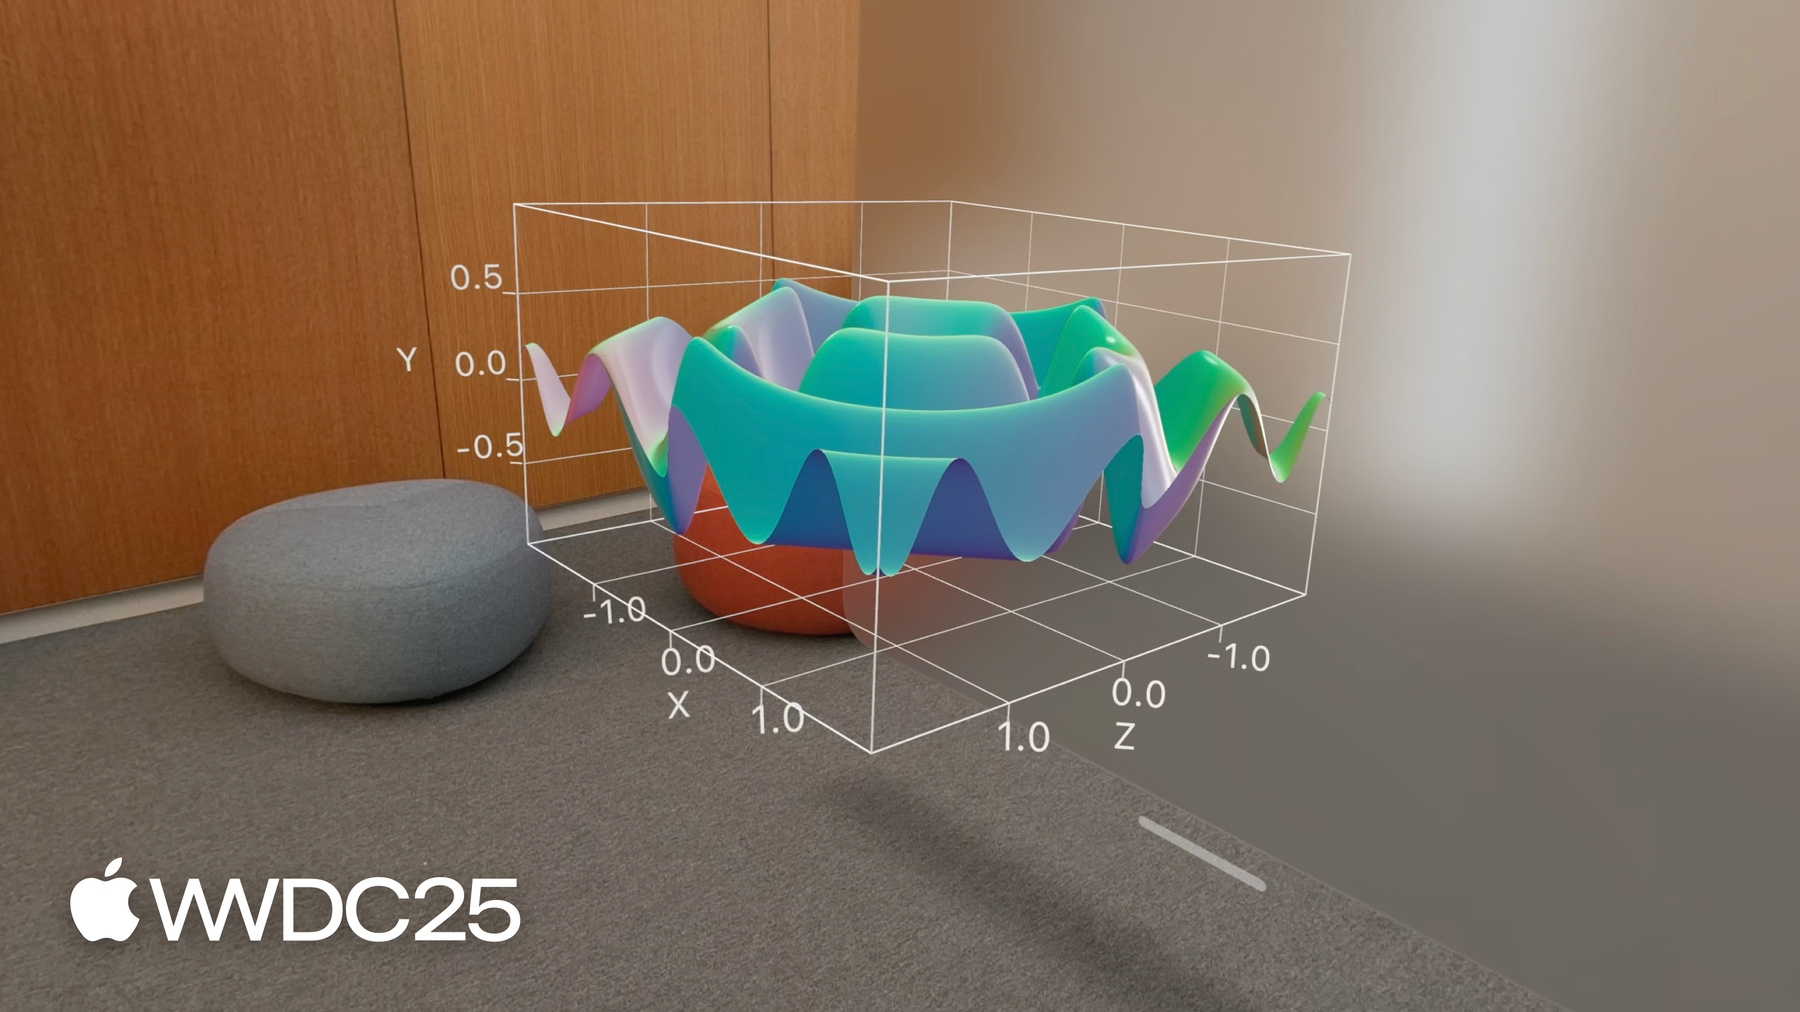
- 5:05 - Gráfico de superficie
SurfacePlot traza funciones de 2 variables en 3D, creando una superficie continua. Proporciona una expresión que produzca un valor Y en términos de X y Z. Estas superficies pueden ser simples, como un plano, o más complejas con formas interesantes.
- 7:03 - Personalización
Swift Charts tiene modificadores para personalizar la apariencia de los gráficos 3D. Establece el ángulo de visión del gráfico con el modificador chart3DPose. Especifica el comportamiento 3D del gráfico con el modificador chart3DCameraProjection. También hay nuevos estilos de primer plano para los gráficos de superficie. Cambia el color en los puntos pegados en el ángulo de la superficie en un punto particular o altura relativa. Estas técnicas, así como muchos modificadores de los gráficos 2D, personalizan los gráficos 3D para que sean hermosos.