-
Profile, fix, and verify: Improve app responsiveness with Instruments
Tackle app responsiveness issues with a clear workflow. Explore the Swift Concurrency instrument, Time Profiler, and System Trace to pinpoint bottlenecks. Discover how to use top functions and run comparisons to measure your improvements and confirm your fixes. And learn about other enhancements in Instruments which make each iteration of this cycle faster than ever, so you can deliver a smoother user experience in less time.
Chapters
- 0:00 - Introduction
- 1:12 - Diagnostic flow
- 7:06 - Sampling data visualization
- 16:01 - Execution contention
- 20:29 - System blocking
- 26:07 - Next steps
Resources
Related Videos
WWDC26
WWDC25
WWDC23
WWDC22
-
Search this video…
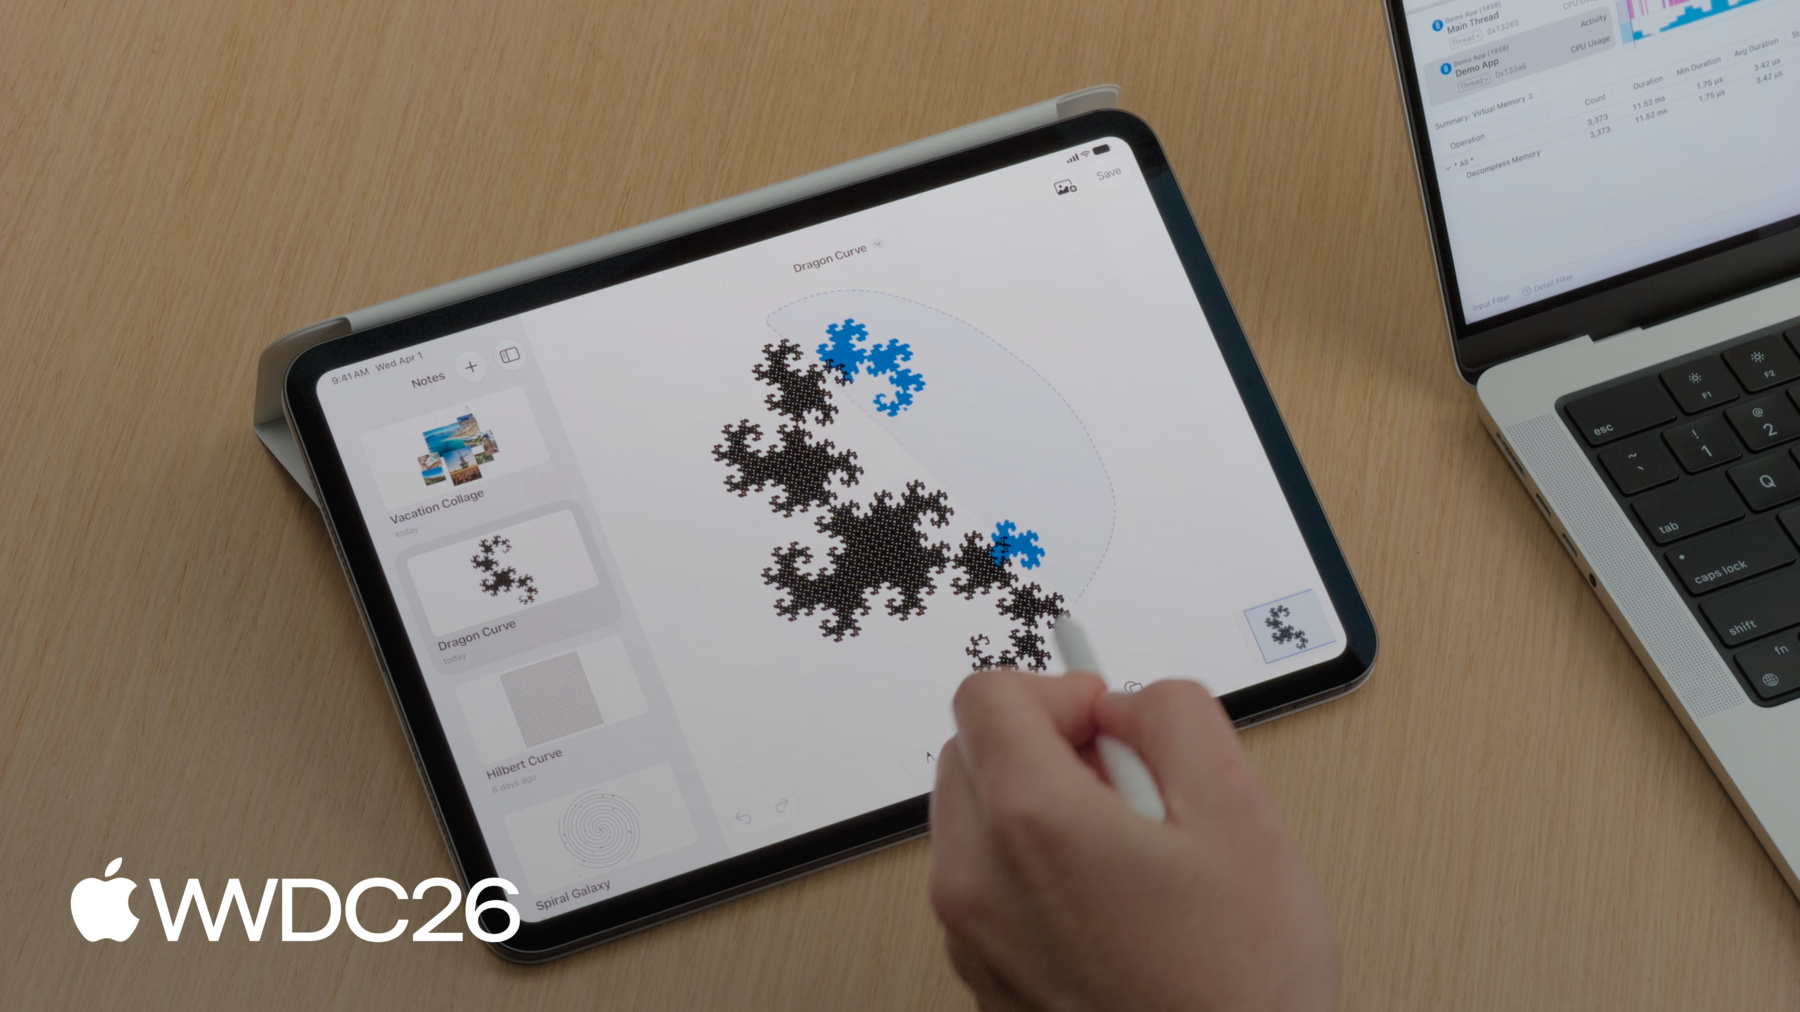
Hi, I'm Art, I work on Xcode. And I am Harjas from the Instruments team. Delivering a fluid user interface is the baseline for a great app. But there is a lot happening behind the scenes. Navigating the layers of the software stack can be confusing. Instruments 27 makes it easier than ever to understand how to make your apps feel fast and responsive.
It starts with app foundation. The Swift code you write is fast and expressive. But this code does not execute in isolation. Even simple code is hiding a lot of complexity.
The compiler and runtime inject dynamic dispatch, safety checks, and reference counting behind the scenes. Then, it relies on the Operating System for memory allocation, process scheduling, and I/O routing.
After that, OS delegates to the underlaying platform. This finally routes execution directly to the physical hardware. It is, also, worth noticing while I've highlighted a few common components here, there are many more compiler and system features at play. To help you triage performance issues, we will share a mental model to understand and optimize your app responsiveness. First, we will look at CPU saturation, and show you how to investigate periods of high system utilization. Next, we will discuss sampling data visualization, exploring how to interpret your profiling data. Then, we will look at execution contention, and examine what happens when tasks are starved for resources. And finally, we analyze system blocking, uncovering the root causes behind why your application stops processing. But before we dive in, let's establish the diagnostic flow. When an application drops frames or hangs. The first step is the Time Profiler. It provides high-level overview needed to orient yourself. From there, the question is: what is the CPU doing during the hang? If CPU usage is high, then the thread is busy and the work is taking too long. This points to a code performance bottleneck. When you hit a performance issue on the main thread, there are two ways to fix it. The first is code optimization: refactoring algorithms to execute faster. But, if the heavy workload is unavoidable, resolve it by offloading the work to a background task so the user interface remains responsive. If the application hangs but the processor is idle, optimizing algorithms won't be helpful. This, usually, suggest that the main thread is stuck waiting for a resource to free up. This block can fall into many categories, but some common ones are: waiting for the File I/O, waiting on a synchronization lock, or waiting for Inter-Process Communication. Because Time Profiler only monitors active CPU cycles, it provides no visibility into these events. We will demonstrate this workflow using a note-taking application, that we have been prototyping. This app allows me to draw, add images, and use a lasso tool to move elements around. But we've noticed three issues while testing the app.
Let's capture a profile to pin these issues down. We start right here in Xcode. To begin profiling, I will open the Product menu and select Profile.
This will create a release build of my application. A debug build trades off runtime performance for debug ability, so profiling data from debug builds can be misleading. Profiling a release build is crucial to get the most actionable data. Because my codebase utilizes Swift Concurrency, I will choose the Swift Concurrency template from the picker.
Within this template, we still have access to the Time Profiler instrument.
I'll start the recording, and switch over to iPad to record the workflows that were exhibiting performance issues during my testing.
When I hit save on a note, the pencil is not instantly responsive.
When I scroll through my notes, the UI is not smooth.
And when use the lasso tool, I noticed that it hangs.
Now, I stop the recording at the top left corner.
And we have a trace containing all the information about these three hangs.
Hey Harjas, the trace is ready. I'll AirDrop you the file, so we can start the investigation. Thanks, Art.
Instruments 27 makes it easy to read and interpret your data. The timeline at the top displays horizontal tracks for your tasks, actors, and executors. These tracks provide a high-level view of resource usage and events over time. Below the timeline is the detail area. This detail view is based on the selected track in the timeline, and each track provides its own set of details. You can switch between them by changing the selection with the pop-up button in the middle bar. On the right-hand side is a brand new Inspector panel. It surfaces additional details and actions based on selection in the timeline or the detail view. First, let's investigate why the lasso tool wasn't able to keep up with the pencil. To make this easier I am going to use a tool called OSSignpost. OSLog and OSSignpost offer a set of APIs to enable logging and tracing. For our use case, I added an os.signpost interval around lasso selection. I achieved this by using the OSSignposter type which has APIs to start and stop tracing an interval. When creating this signposter, I set the subsystem to "Demo App" so that I know it's related to my App. And, I set the category to points of interest, so that instruments will automatically surface this data in the points of interest track. Now, we can find the lasso selection interval in the timeline.
And use the context menu on the interval to filter the trace to this time period.
The hangs instrument shows that there were several hangs during lasso selection, which lines up with what Art was experiencing. As Art said earlier, we should check the CPU usage on the main thread during this hang. We can find that by expanding the process track, which reveals all the threads for this process. The main thread shows that CPU usage is high, staying around a 100% during this time period. Which suggests our code is executing, but it takes too long. So we should investigate using Time Profiler. Hey Art, can you walk through the ways we can visualize sampling data in Instruments. Absolutely. When your application is running, the CPU is generating thousands of samples every single second. Instruments is built to handle that scale, providing visualizations for different categories of performance analysis. Let's break down how the Time Profiler translates raw execution into a call tree.
It uses a hardware timer to sample the state of your app's execution at regular intervals. The default sampling rate is one millisecond.
When the timer fires, it records the current call stack on every core. In this first sample, main calls saveNote. In the call tree, each of these functions receives a weight of 1. Because saveNote is the function actively executing at the bottom of the stack, it receives a self-weight of 1.
A millisecond later, the second sample fires. This time, we sample main calling renderCanvas, which calls drawStroke function. Their weights are, also, added to the tree.
On the third sample, drawStroke has finished, so we sample main and renderCanvas. Main increments to a total weight of 3, and renderCanvas increments to a weight of 2.
Notice the fast swift_retain call. Because it started and finished entirely between the samples, it is never recorded, but it is important to note that the more frequent it called the more likely it will be sampled.
This call tree is the raw data driving your investigation. But, reading it can be difficult to parse at a glance. To make this data even more intuitive, Instruments can render it visually as a flame graph. The flame graph maps the all tree structure into spacial blocks. Main, with a weight of 3, forms the top level. The functions it called, renderCanvas and saveNote, cascade downwards proportionally to their weights, with drawStroke node sitting at the very bottom.
In this visualization, the vertical axis represents the call stack, with callers on top and callees growing downward. The horizontal axis represents total CPU time, but instead of a chronological timeline, it's an aggregated view. The wider the bar, the more samples that function appeared in, allowing you to instantly spot expensive code paths.
However, for code that is called from a lot of places, like Swift runtime functions and various helper utilities. The structural view of a flame graph distributes their total cost. The execution time is fractured into small pieces across every distinct branch that calls them. This distribution makes it difficult to answer which specific functions burned the most overall cycles. To answer that question, Instruments introduces new analysis mode Top Functions. This new mode discards the call hierarchy. Instead, it extracts every single scattered node and merges them together to form one block.
This is evaluated using the self metric, which calculates the amount of time spent executing instructions directly inside that specific function. Harjas, I think we are ready look at the data, take it away. Thanks Art. When viewing a profile in Instruments, the default view is an outline call tree display, this is great when looking at sample counts. But, as Art mentioned a flame graph can be easier to scan through and visually spot issues. Using the segmented control in the bar above the call tree, we can switch the detail view to display the flame graph. Doing a quick scan through it reveals that the time is split across different codepaths in the rendering code for our canvas. There is no single obvious issue to address. Rather, these different codepaths sum together to be costly enough to cause hangs. I am going to try the new top functions mode in Instruments, as it might surface something that would be harder to find in the call tree or the flame graph. This can be found in the same control we used before.
On the left hand side is a list of all the Top Functions sorted by self weight. The right hand side displays a flame graph of all the code paths that called into the selected function. The Top Function during lasso selection is swift_project_boxed_opaque_existential.
This runtime function is responsible for unwrapping an existential so our code can operate over it. I will ask the coding assistant in Xcode to rewrite our drawing code to use concrete types and generics instead of existentials.
While this is running, I want to explain what is an existential and why I asked the coding assistant to make this change. In Swift, we often want to have a variable that can hold any type conforming to a protocol without having to know the specific type at compile time. One way of achieving this is by using the any keyword before the protocol name, this is called an existential. Because the possible types can vary in size, existentials may require additional work to access and operate over the underlying value. This is proving to be too expensive for our use case. There are several alternatives to existentials when performance is paramount including concrete types, generics, and in some cases, enums. These approaches give the compiler more information, allowing for better optimizations. To learn more about generics in Swift, watch "Embrace Swift generics" from WWDC22. Let's check back in with the assistant.
It appears that the coding assistant has finished making those changes. I will send an updated trace over to you, Art. Thank you Harjas. To verify the fix we made, I could open them up side-by-side in different windows and compare the Top Functions data. However, Instruments now allows you to directly compare profiling data across runs in a single document, to help speedup the work of confirming your changes.
New in Instruments we're excited to introduce Run Comparisons. It computes the exact performance delta by cross-referencing all of samples from the baseline trace and optimized trace. It evaluates every node in the stack. To do this, Instruments matches the old version of a function from your baseline run directly to the new version in your optimized one.
Once matched, it calculates the delta and sorts them based on their performance difference. A red block indicates a performance regression. A green block indicates a performance improvement, or run time optimization. So, let's try it out. To ensure an accurate comparison without noise, we first filter both runs to the exact same os_signpost interval for the lasso selection.
Then, to compare sampling data on the main thread, I will select the main thread track.
And, by clicking the compare button in the middle bar, I can select my baseline run from the dropdown menu.
This will add a comparison tab in the sidebar. You can create multiple comparisons, and they are saved to the document to make collaboration easier. A comparison tree can be visualized as a textual call tree.
Here we can see that overall execution time for lasso selection has decreased.
Switching to a flame graph, we can see code paths that improved in green and the ones that regressed in red. When the coding assistant adopted generics it introduced new functions, which Run Comparisons will mark as regressions. And in Top Functions view we can now see what improved the most and what regressed the most. By default, regressions in Run Comparisons are sorted to the top. These regressions are new functions added by the coding assistant as it worked to eliminate the usage of existentials.
We can flip the sort order to see the improvements.
Here, the swift_project_boxed_opaque_existential call has been removed completely. And overall, the improvements out weight the regressions. This confirms that adopting concrete types and generics successfully eliminated this specific runtime overhead. To learn more about optimizing CPU work, watch the "Optimize CPU performance with Instruments" session from WWDC25. Harjas, 1 hang down, 2 to go. That's right. Now that we've optimized the drawing code, we can return to our baseline run and keep optimizing other aspects of the app. There are still several hangs that need to be investigated.
Unfortunately, these don't have any logs in the points of interest track to help contextualize what was happening at the time. Another way to contextualize this would be to see what tasks are on the Main Actor during these hangs. Instruments 27 has a new Swift executors instrument.
This instrument visualizes the Main Actor, the global concurrent executor, and any custom executors in your process. For each of these hangs, the Main Actor track shows a corresponding Swift task called renderThumbnail. We can select this track and a get a summary of all the tasks running on the Main Actor.
It appears that we have several render thumbnail tasks on the Main Actor taking a few hundred ms to run.
This could help explain why scrolling the list of notes wasn't smooth. Let's follow our diagnostic flow, and check the CPU usage. I will filter the trace to one of these hangs.
And use the inspector to pin the main thread.
In this period, time profiler reports that CPU usage of the main thread is around a 100%. So we aren't waiting on other system resources, these tasks are just taking too long to run on the Main Actor. So why is this a problem? Well, first let's review what the Main Actor is and then discuss how we can resolve this hang. The Main Actor is responsible for handling all user interface updates and interactions. The application renders all the thumbnails asynchronously. But because this code was called from SwiftUI, it inherited the Main Actor context. These tasks will compete with critical UI updates for the Main Actor, preventing the app from delivering a smooth experience. To resolve this, we must route the thumbnail rendering to the thread pool. This frees up the Main Actor, allowing the pending UI events to execute smoothly.
This is the code responsible for generating our thumbnails. We can refactor it by adding the @concurrent attribute to the task initializer, this will move the thumbnail rendering task off the Main Actor, and onto the global executor. The swift compiler will check that this code change does't introduce any race conditions. In the updated trace, the Swift executors instrument shows that the thumbnail rendering tasks have moved from the Main Actor track to the global executor track. Not only did moving this to the global concurrent executor prevent hangs in the UI, but it also allowed us to render these thumbnails in parallel.
To learn more about using Swift Concurrency, watch "Embracing Swift Concurrency" from WWDC25. Alright Art, one more hang left! Let's bring it home.
Now that the concurrency contention is resolved, let's return to our baseline run for the final hang. When we hit save, the user interface hangs for a short time. I am going to use the Write to File interval in the points of interest track to find this hang.
And I am going to set the inspector range and zoom in by clicking on appropriate option in the contextual menu.
There is a reported micro hang during this step. Again, let's check the CPU usage.
In this case, it's actually quite low, hovering around 20%.
The diagnostic points us to low CPU usage. When the interface freezes under these conditions, it tells us the main thread is blocked waiting on a system resource. To understand exactly why that happens, let's look at how threads transition between states. A low CPU utilization can be deceptive, because it doesn't mean your code is executing slowly, it means the thread has stopped running. System Trace template is built to visualize exactly when and why the operating system pauses your application. Here, the main thread is actively running on a CPU core. The operating system provides whole host of system calls to do work on your behalf and control the hardware. But when a resource isn't immediately available a thread enters the blocked state. When this occurs, the kernel evicts the thread from the processor. Only when the resource is finally ready, the thread becomes runnable, and returns to the core.
To be more specific, when the hardware eventually finishes the job, the thread doesn't immediately start executing. It first enters the runnable state, which means the resource is ready, but the thread has to wait in line for the OS scheduler to assign it a free CPU core.
Now, zooming back. Notice this blocked state highlighted here. It spends the vast majority of its time blocked waiting for that external dependency to resolve. When it is resolved the thread wakes up briefly to coordinate the next stage of the request. These brief moments of execution are exactly what cause that twenty percent of CPU utilization.
During this phase, the thread is completely idle. A single system call like this often relies on multiple underlying dependencies, forcing the main thread to wait until the OS resolves every single one of them. It finally returns to the core to finish the work. Optimizing algorithms yields no improvement here, because there is no code running to optimize. Let's find out together what is happening with the Write to File interval.
Here is a profile of this hang using the System Trace template. With System Trace, we can see exactly what the thread was doing, including key OS concepts like system calls. We can pin the main thread using the inspector, and zoom in.
It reveals that while saving the file, the activity lane shows a large amount of blank space. This indicates that the thread was blocked, preventing the UI from updating. The purple intervals you see indicate that a system call is running. However, just because a syscall is active does not mean the thread is actually executing the application code. I am going to select one of these intervals.
Notice, when I do so, more than just the segment I clicked is highlighted. This visualizes one continuous write system call that spans both on and off-core time. The opaque segments represent the time spent actively running on-core, while the translucent segments are the periods it was blocked off-core.
To understand why it was blocked for so long, we can look at the Inspector. The Inspector gives us the exact arguments passed to this system call. We can see the target file descriptor, the memory address of the buffer, and most importantly, the size.
It is trying to write over 1.7 gigabytes of data on the main thread. We can also see the performance cost. This single operation took over 500 milliseconds, and almost 300 of those milliseconds were spent off-core waiting for the disk. Because the file write was initiated synchronously on the main thread, the application freezes waiting for the storage to respond. To fix this, I will refactor the code to move the file I/O in the background. This is the snippet responsible for that workflow. We're using the PropertyListEncoder class to serialize our data, and the bottleneck is this line right here. We are calling the data.write method synchronously. Because this atomic write is executing directly on the main thread, it's exactly what caused that block. We, again, can wrap this code inside a Swift task. By doing this, we push the encoding and file writing onto concurrent thread pool and unblock the Main Actor. Here's another profile to verify that we no longer block the main thread during file saving. I have already navigated myself using the Writing to File signpost interval. The main thread no longer shows the write system call.
We can now find the same syscall on a background thread.
Which mean using the Apple Pencil should now feel fluid. Let's open the app and confirm the wins. With the file I/O properly routed, saving the document is now happening in the background, allowing interacting with the application.
And because we also optimized the CPU saturation and resource contention, using the lasso tool and scrolling my notes both remain responsive.
By following the data, we have successfully eliminated all three types of hangs from our baseline run. Consistently engineering responsive applications requires matching your profiling tool to the specific performance symptom.
When the CPU is overloaded, utilize Top Functions to isolate scattered software overhead, and use Run Comparison to verify your improvements. When the tasks fight for resources, use the Swift Concurrency instrument to identify actor congestion.
And when a thread is idle, leverage System Trace and the Inspector panel to uncover synchronous blocking behaviors like file I/O.
As you apply these workflows to your own codebases, ensure your profiling is accurate. Always profile a release build. And leverage os_signpost to make sure your intervals for run comparisons are reliable. To go even deeper into these topics, we highly recommend checking out "Analyze hangs with Instruments" session from WWDC 2023. With Instruments you never have to guess where to look. Profile often, and let the data tell the story. Thanks for watching!
-
-
5:41 - Add signpost interval around Lasso Selection
// Add signpost interval around Lasso Selection import os.signpost let signposter = OSSignposter(subsystem: “Demo App", category: .pointsOfInterest) var lassoIntervalState: OSSignpostIntervalState? = nil func lassoSelectionUpdated() { lassoIntervalState = signposter.beginInterval("Lasso Selection") // Update selection in canvas… } func lassoSelectionEnded() { // Finalize lasso selection... signposter.endInterval("Lasso Selection", lassoIntervalState!) } -
12:11 - Existentials
// Existentials protocol Foo { } struct TypeA: Foo { } struct TypeB: Foo { } func bar(_ foo: any Foo) { } -
12:39 - Concrete Types
// Concrete types protocol Foo { } struct TypeA: Foo { } struct TypeB: Foo { } func bar(_ a: TypeA) { } func bar(_ b: TypeB) { } -
12:46 - Concrete Types + Generics
// Concrete types protocol Foo { } struct TypeA: Foo { } struct TypeB: Foo { } func bar(_ a: TypeA) { } func bar(_ b: TypeB) { } // Generics protocol Foo { } struct TypeA: Foo { } struct TypeB: Foo { } func bar<T: Foo>(_ generic: T) { } -
12:49 - Concrete Types + Generics + Enums
// Concrete types protocol Foo { } struct TypeA: Foo { } struct TypeB: Foo { } func bar(_ a: TypeA) { } func bar(_ b: TypeB) { } // Generics protocol Foo { } struct TypeA: Foo { } struct TypeB: Foo { } func bar<T: Foo>(_ generic: T) { } // Enums enum Foo { case a(TypeA) case b(TypeB) } struct TypeA { } struct TypeB { } func bar(_ enum: Foo) { } -
18:24 - Thumbnail Rendering
// Thumbnail rendering let drawingData = note.drawingData let canvasImages = note.decodeCanvas() thumbnail = await Task(name: "Render Thumbnail") { await renderThumbnail(drawingData: drawingData, canvasImages: canvasImages, size: CGSize(width: 300, height: 240)) }.value -
18:29 - Thumbnail Rendering Off Main Actor
// Thumbnail rendering off Main Actor let drawingData = note.drawingData let canvasImages = note.decodeCanvas() thumbnail = await Task(name: "Render Thumbnail") { @concurrent in await renderThumbnail(drawingData: drawingData, canvasImages: canvasImages, size: CGSize(width: 300, height: 240)) }.value -
24:12 - File Saving
// File saving let encoder = PropertyListEncoder() encoder.outputFormat = .binary guard let data = try? encoder.encode(snapshots) else { return } let id = signposter.beginInterval("Writing To File") try? data.write(to: fileURL, options: .atomic) signposter.endInterval("Writing To File", id) -
24:25 - File Saving off Main thread
// File saving

Task { @concurrent in
	let encoder = PropertyListEncoder()
	encoder.outputFormat = .binary
	guard let data = try? encoder.encode(snapshots) else { return }
	let id = signposter.beginInterval("Writing To File")
	try? data.write(to: fileURL, options: .atomic)
	signposter.endInterval("Writing To File", id)
}
-
-
- 0:00 - Introduction
Overview of how Instruments 27 helps developers understand and optimize app responsiveness across the software stack abstraction layers.
- 1:12 - Diagnostic flow
Learn the four-step mental model — CPU saturation, sampling data visualization, execution contention, and system blocking — for systematically triaging hangs and frame drops.
- 7:06 - Sampling data visualization
Explore how Instruments' Call Tree, Flame Graph, and the new Top Functions mode transform raw CPU samples into actionable views for identifying performance bottlenecks.
- 16:01 - Execution contention
Discover how the Swift Executors instrument reveals when render-thumbnail tasks saturate the Main Actor, and how adding the @concurrent attribute moves work off the main thread to resolve UI hangs.
- 20:29 - System blocking
Use System Trace and the new Inspector panel to diagnose low-CPU hangs caused by synchronous file I/O blocking the main thread, and learn to fix them by moving the work to a background Swift task.
- 26:07 - Next steps
Key takeaways on matching the right Instruments template to each class of performance problem, plus links to related sessions on CPU optimization, Swift Concurrency, and hang analysis.