-
Find and fix performance issues in your Metal games
Track down hard-to-find game performance issues with powerful Metal tools. Discover how to collect rich performance data using Game Performance Overview in Instruments, run background traces with metalperftrace on macOS and Control Center on iOS, and use the new StateReporting API to correlate metrics directly to your game's runtime state. Turn hours of telemetry into clear, actionable insights.
Chapters
- 0:00 - Introduction
- 1:51 - Metal performance metrics
- 3:32 - Trace collection
- 6:38 - Analyze performance traces
- 10:08 - Contextualize with StateReporting
- 17:48 - Collect field data with MetricKit
- 19:41 - Next steps
Resources
- Understanding the Metal Performance HUD metrics
- Monitoring your Metal app’s graphics performance
- Getting started with StateReporting
- Metal debugger
Related Videos
Tech Talks
-
Search this video…
Hello, and welcome. I'm Ruiwei, an engineer with the Metal Tools Team. A smooth, consistent frame rate is one of the most important things you can deliver to your players. It is what makes your game feel responsive and polished - and maintaining that smoothness across an entire play session is key. I'll demonstrate new tools and workflows that give you everything you need to quickly collect and identify issues in long game sessions.
Achieving a great, smooth game experience is a cycle, you need to play test your game on many different devices and form factors, collect performance data, analyze the results, identify performance issues, and fix them. Then you play test again and repeat the cycle until you hit your performance targets. As players play your game for hours, many conditions could change. The device may heat up and thermal state shifts. The player adjusts graphics settings. They move between different levels and fights. To truly achieve a smooth experience, you need to measure across many different scenarios over long periods of time. To show you how, I will start off with a brief introduction to the Metal performance metrics that are available to you. Then, I will show you new tools and workflows that collect and analyze traces over long periods of time. Next, I will demonstrate how to contextualize the traces, so you understand the state of your game at any point in time. And finally, how to collect data in the field after your game ships. I will start with Metal performance metrics.
Metal tools provide a wide range of different metrics. These metrics give you a baseline to compare between different sessions and identify potential issues. For example, timing related metrics such as frames per second, GPU time, and Frame Interval tell you the pacing of your frames and how utilized the GPU is.
On the other hand, metrics such as layer sizes, composition mode, and MetalFX related metrics help you make sure the display related settings are set up correctly. There’s one place where you can take a quick glance at all of these metrics.
The Metal Performance HUD displays performance metrics such as FPS, memory usage, and frame interval in an overlay on top of the game's content. It gives you a broad sense of how your game is performing as you play, and it has a number of customization features. For example, the configuration panel allows you to customize the list of metrics to display.
You can enable or disable each individual metric, or choose from a preset.
You can learn more about each metric and the HUD in the Metal tools documentation. "Monitoring your Metal app's graphics performance" and "Understanding the Metal Performance HUD metrics". While the HUD is great for getting a quick read during development, it doesn't give you the ability to save the metrics for long durations. It’s easy to forget exactly where you encountered frame drops, especially when playing for minutes or hours.
To get that level of detail, you need to collect performance traces over long periods of time. For testing your game at desk, you can use the Game Performance Overview template in Instruments.
To start, choose the Game Performance Overview template in the Instruments template selector.
It captures aggregated Metal performance metrics as well as Time Profiler CPU samples.
You can either start your game using Instruments, or attach to an already running game session on connected devices.
Once ready, simply click the record button.
This is ideal for data collection while testing your game at your desk - sessions that last minutes or longer. But here's something really powerful.
While your game runs, the system is always recording and saving Metal performance and resource usage metrics.
Aggregated and optional per-frame metrics, such as CPU, GPU, FPS, and Memory are efficiently stored, and saved for days. This means for a long game session that lasts hours, and includes multiple state changes, you can look back in time and collect data after the game session wraps up - locally, on both macOS and iOS devices. I'll demonstrate how this works.
On macOS, you can collect the data through metalperftrace, a new command line tool in macOS 27.
No extra configuration needed. Simply run metalperftace collect and pass --last for the time duration you want, from hours to days. For example, this command collects a trace containing performance metrics for the last 5 hours.
Alternatively, you can pass an explicit start and end date to collect the trace for a specific time range.
That's how you can look-back and collect traces on macOS. On iOS, look-back collection requires a one time device setup.
With developer mode enabled, go to developer settings and Enable Performance Trace. Select Lookback Collection, and choose for how far back the trace will cover.
As a last step, go to control center, and add the Performance Trace button.
Now the device is ready for trace collection.
You can start play test the game as usual. After it wraps up, bring up the control center. At the tap of the performance trace button, the device will start collecting and processing the trace for the configured time duration.
This might take some time, and you will receive a notification once processing is done. The collected traces will appear in the Available Trace Files list. And from there you can easily transfer the trace to your Mac for further analysis.
Now that I have demonstrated how to collect traces - both with Instruments and on iOS and macOS devices, it's time for the next step: analyzing them. On macOS, you can either print or export an overview of the metrics through metalperftrace. Or open the traces in Instruments and explore the data visually. Let's check both in action. To take a look at the overall performance of a recorded trace, simply run metalperftrace overview with the trace file. metalperftrace will aggregate and print the overall performance data of the game sessions contained in the trace. The report is divided into 2 sections for each process. The first section contains the resource usage statistics, such as memory usage, CPU time, and disk activity. The second section contains Metal performance metrics for each layer. For example, During this session, the average memory usage is around 2.1GB.
The average FPS is about 60.
And the report also includes statistical values for metrics such as frame time and on-GPU time. This gives me a quick idea of the overall performance of the session.
If there were multiple game sessions or Metal graphics apps in the trace, an optional predicate can be used to print data for the exact process you want.
Additionally, you can also pass --json to make metalperftrace output in JSON format.
Now you get structured output that can be easily fed into scripts for regression testing, or AI agents to automatically triage potential performance issues.
Instruments can also open and visualize the traces for deeper analysis with more detailed metrics.
The data is plotted on a timeline, and Instruments automatically evaluates the values so that stats that deviate too much are highlighted in a different color.
For example, in this trace, the FPS dropped for a period of time and is marked in yellow. The detail view shows statistical values: min, max, average, and standard deviation for each metric. These stats are aggregated for the whole trace or the selected time range.
You can select a time range and Instruments will automatically aggregate and update the stats for the selected duration. Here the average FPS dropped to 26 for the duration, and GPU usage is really low.
This is where I need to dive deeper and try to reproduce an issue, but there is a big challenge. I know the frame rate drop happened at around the 12-minute mark, but I do not know what my game was doing at that point.
When looking at a trace like this there is not enough actionable context to investigate further with just an average FPS.
Was the drop due to a specific area of the level? Or did graphics settings change? This is why context matters when trying to identify potential performance issues and analyze traces. To investigate individual problems, you need granular data that tells you what the game was doing at each moment.
So next, I will introduce a new API that helps you to add context to the traces. StateReporting is a new API that lets you describe your game's behavior and state over time. And it is based on four core concepts. It all starts with a domain. Domains are finite state machines that represent specific areas of functionality.
For example, you can define a level domain that tracks the player progress.
Each domain can be in one state at a time.
Each state starts with a label, such as "Level 1".
It can also include optional stable metadata. This is a immutable dictionary that includes any kind of serializable info about the current state, in addition to the label.
Each state can also include volatile metadata. As the name suggests, you use it for values that can change within a state, like the health of the player. As the player progress through the game, you can transition between states with different label and metadata.
For example, transition from "Level 1" to "Level 2" when the player advances to the next level.
Putting this on a timeline, you can define multiple domains to describe the state of specific areas of the game.
For example, a level domain that tracks level changes, a graphics domain that tracks current graphics settings, and a network domain for the network status.
If we go back to the previous FPS Graph, now we can contextualize the trace and I can immediately notice areas that needs improvement, and focus my optimization efforts.
The StateReporting API is available for both Swift and Objective-C, and it is easy to adopt.
I'll show you some sample code that reports the current level of the game. First, create a domain, typically a reverse DNS string, and ask for a reporter for the domain. Reporters are instances of the state machine that can be used to report state transitions. To report a state, use reportTransition with a label to describe the current state.
Optionally, to include additional structured info about the state, simply pass a dictionary in the stableMetadata argument. For volatile metadata, you can update values without transitioning to another state by calling reportVolatileMetadataUpdate, with a dictionary representing the info.
StateReporting is also tightly integrated with all of the tools I've discussed: Metal Performance HUD, metalperftrace, and Instruments.
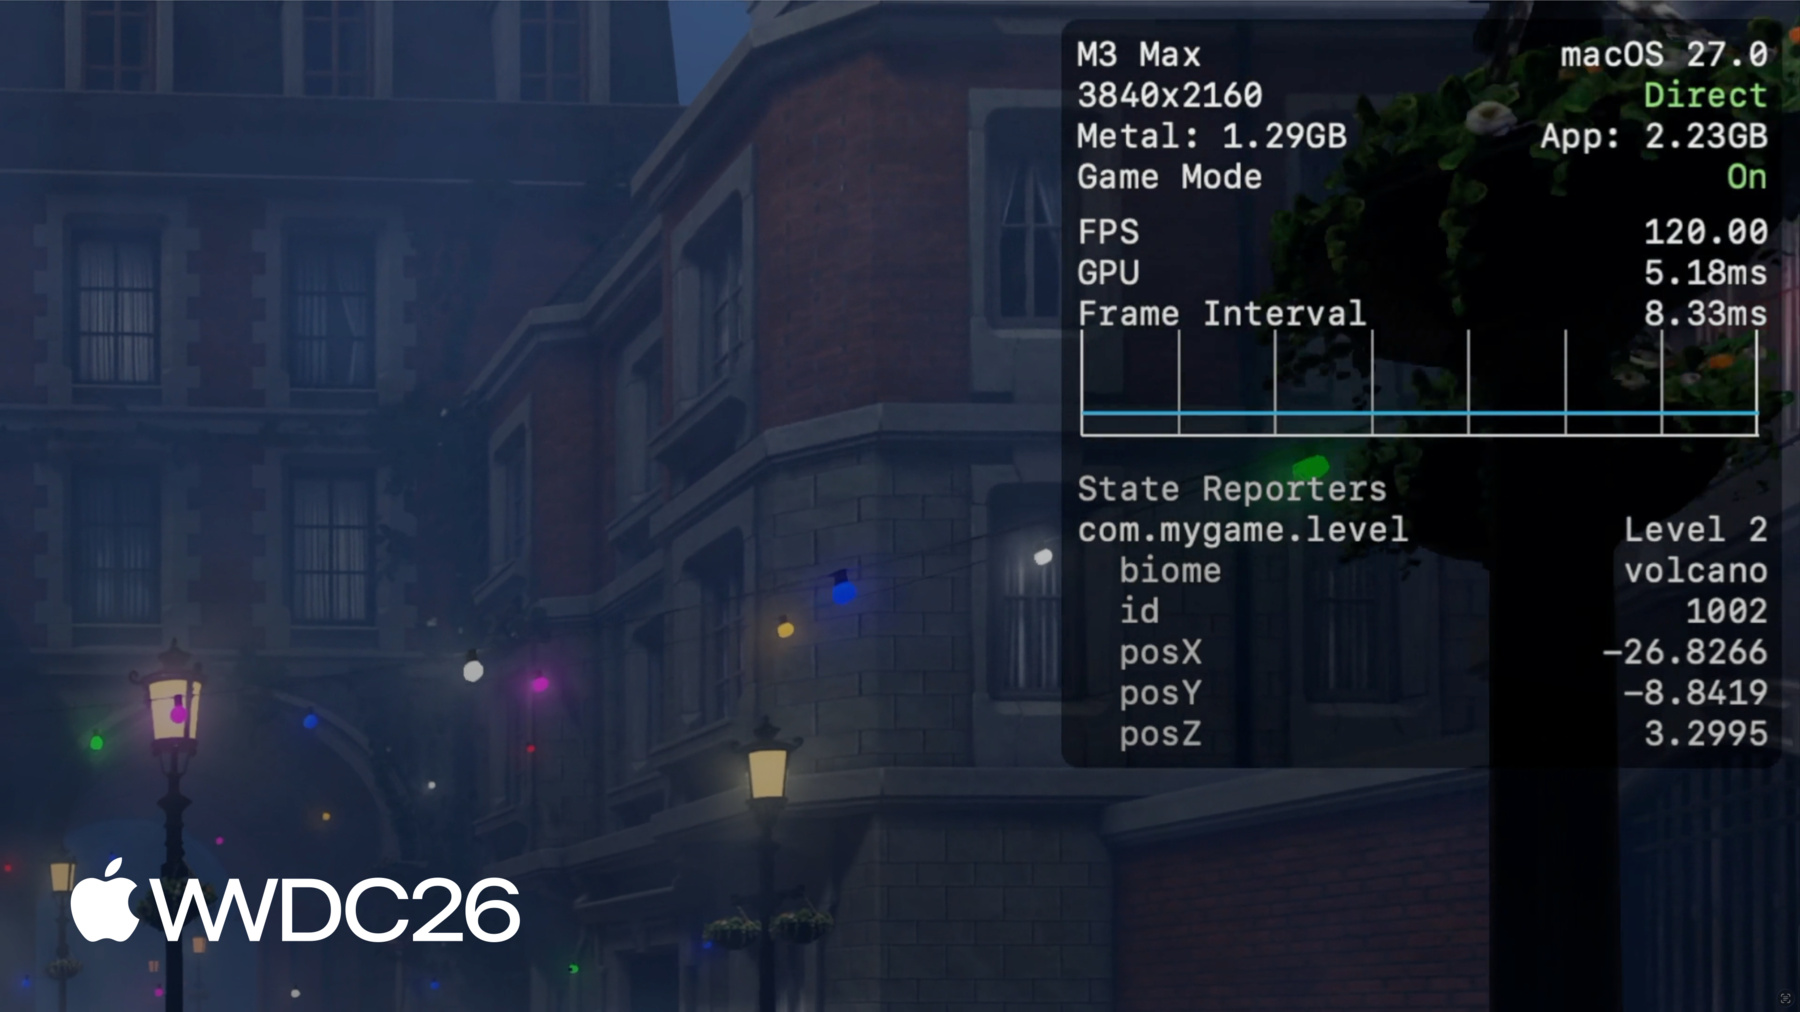
In the Metal Performance HUD, the list of state domains appears in the metrics configuration tab. Enable them and the overlay will display the label, stable and volatile metadata. This is the most direct way of checking your StateReporting adoption.
For example, here I'm reporting the level state with a biome and id as the stable metadata, and player position as the volatile metadata.
The volatile player position is reported once per second, and the overlay allows me to check the position as the player moves around. In metalperftrace, when printing the overview for traces containing state transitions, the report will contain a list of domains, the number of transitions, and the last known state.
To know the full state transition details, simply pass --include-state-transitions. This will print the full list of states with start and end timestamps.
metalperftrace can also automatically aggregate and report metrics as a function of these states.
You can ask metalperftrace to aggregate for all domains and state transitions, or aggregate for all state transitions for a specific domain, or aggregate for a specific state label within a domain.
For example, to see the average FPS when the graphics is set to high, I can simply ask metalperftrace to aggregate the "High" state label for the graphics domain.
The report will show detailed state info, how long it was active, and a list of overlapping states in other domains.
For example, here the average FPS is only about 24 when the graphics is set to High.
To get a more visual look at the state transitions over time, you can open the trace in Instruments.
When opening a trace with state transitions, Instruments will create a track for each domain as part of the Points of Interest instrument.
Each track graphs state transitions and volatile updates, making it easy to understand the context.
You can select individual states, and inspect the details of that state in the sidebar, such as the stable and volatile metadata.
Combined with the Metal performance metrics, I confirmed that the frame rate started dropping as graphics setting changed to high. That's where I'm going to focus my investigation next. Once there is enough context to reproduce the issue, the next step is taking a deeper look at specific points of the game.
You can capture detailed CPU and GPU scheduling data by using the Metal system trace template in Instruments.
You can also capture and profile frames by using the Metal debugger in Xcode.
To learn more about those tools, check "Metal Developer Tools" documentation, and "Discover new Metal profiling tools for M3 and A17 Pro".
There are a few best practices to keep in mind when you adopt StateReporting in your game.
First, carefully design your domains and states before instrumenting. Each domain should be conceptually orthogonal to the others. Don't try to represent too many dimensions in a single domain - that makes it hard to keep track of. Second, don't have too many state transitions. StateReporting is designed to provide extra context for analyzing performance over long periods of time. It is not designed for high-frequency state changes. Try to limit transitions to the cadence of user actions or slower. The system will throttle if the transition rate is too high, and you will loose important information until rate is back under control.
And lastly, confirm the correctness of your states using tools such as the Metal Performance HUD and Instruments.
Check that transitions make sense and occur when you expect. It is easy to miss edge cases that make the data wrong and hard to understand.
Looking back, you now have the full picture of collecting, analyzing, and contextualizing performance data for long game sessions before shipping the game. But these tools don't stop at launch.
Once the game lands on player devices, its important to keep monitoring the performance, and catch unexpected performance drops that impact player experience.
Next, I will cover how you can collect key Metal performance metrics after the game is released. MetricKit is a framework that provides two types of data: metrics and diagnostics. It gives your game direct in-process access to power and performance data in the form of reports.
As players play your game, MetricKit continuously collects data in the background and delivers a daily report to your game.
The report includes metrics that measures the smoothness of your game, and how hard it's using the device resources. In macOS and iOS 27, MetricKit exposes Metal frame rate information, along with a ton of other interesting performance and power metrics.
It also provides Metal frame rate as a function of your StateReporting states. The frame rate will be aggregated and grouped by state in your Metric reports.
In this sample report, MetricKit reports the overall average frame rate along with time and number of frames.
It also breaks down the frame rate information by the states in the level domain. These metrics and many more will be delivered to your game process where you can do local analysis. And also package up the data for off-device processing and aggregation.
This allows you to monitor performance of your game in the field, and identify potential issues that you can investigate and fix.
In addition to metrics, MetricKit also provides diagnostics that help you identify which code path caused a performance problem, such as memory exceptions.
When your game is terminated for exceeding its memory limit, you get more insight on what happened.
To recap, in iOS and macOS 27, Metal performance metrics are always being recorded by the system.
I demonstrated how to look-back and collect performance metrics spanning hours and days. And how to use metalperftrace and Instruments to analyze those traces.
I also showed a new StateReporting API that can help you add context to the traces.
Post shipping, MetricKit delivers metrics and diagnostics from players devices.
To get started, check out StateReporting. Design the domains that matter most in your game levels, graphics, network states, and start reporting them.
Play test the game, collect long game session traces and make sure there is a smooth player experience on supported devices.
Also remember to check out MetricKit, and collect daily metric reports from player devices. To learn more about the available data and how to integrate MetricKit, please check out "Meet the new MetricKit".
Try the new tools and workflows. And I cannot wait to play your game on Apple Platforms. Thank you for watching!
-
-
5:00 - Collect a trace with metalperftrace
# Collect the last 5 hours metalperftrace collect /tmp --last 5h # Output # Metal performance traces collected to: /tmp # /tmp/MetalPerfTrace_20260401_094100_to_144100.atrc # Or collect an explicit time range metalperftrace collect /tmp \ --start 2026-04-01T09:41:00 \ --end 2026-04-01T12:41:00 -
7:02 - Print a trace overview
metalperftrace overview /Data/MyGameTrace.atrc # [Modern Renderer pid:13833] # Mem: 2146.1 MiB (2343.9 Peak, 1199.4 Metal) # Total CPU Time: 2417.601s (33.17% Sys, 66.83% User) # Instructions: 9944836683668 (5.75% P, 94.25% E) # Cycles: 5176430469224 (4.45% P, 95.55% E) # Disk Reads / Writes: 317.37 / 0.04 MiB (Logical Write 0.04) # Layer 0x729293000 (3456x2104) Interval 300.065s Active 300.065s # 59.7 FPS 17735 Frames 188 Skipped # Frame Time avg: 16.74ms min: 8.33 max: 125.00 stddev: 3.70 # CPU Begin-to-Present avg: 3.99ms min: 1.40 max: 94.37 stddev: 1.80 # On-GPU Time avg: 13.39ms min: 5.24 max: 37.57 stddev: 1.43 # Next Drawable Wait avg: 0.26ms min: 0.00 max: 91.08 stddev: 1.75 # Shader Compilation Time: 0.000s (Total: 0, Cached: 18) -
7:58 - Filter by process and emit JSON
// Report state transitions #import <StateReporting/StateReporting.h> NSString *domain = @"com.mygame.level"; SRStateReporter *reporter = [SRStateReporter reporterForDomain:domain]; [reporter reportTransitionToStateLabel:@"Level 1" stableMetadata:nil volatileMetadata:nil]; [reporter reportTransitionToStateLabel:@"Level 1" stableMetadata:@{ @"id": @1001 } volatileMetadata:nil]; [reporter reportVolatileMetadataUpdate:@{ @"health": @100 }]; -
13:55 - Include full state transitions in overview
metalperftrace overview /Data/MyGameTrace.atrc --include-state-transitions # [States] # com.mygame.graphics # High (30.59%, 14.996s) raytracing: 1 shadow: ultra # Medium (69.38%, 34.012s) raytracing: 0 shadow: medium # com.mygame.level # Level 1 (20.47%, 10.033s) biome: forest id: 1001 # Level 2 (79.53%, 38.991s) biome: volcano id: 1002 -
14:15 - Aggregate metrics by state
# Aggregate across all domains / transitions
metalperftrace overview /Data/MyGameTrace.atrc --aggregate

# Aggregate one domain
metalperftrace overview /Data/MyGameTrace.atrc --aggregate \
  --domain com.mygame.graphics

# Aggregate a specific state label within a domain
metalperftrace overview /Data/MyGameTrace.atrc --aggregate \
  --domain com.mygame.graphics \
  --state-label "High"
-
-
- 0:00 - Introduction
Overview of the challenge of maintaining consistent frame rates in games across long play sessions, and a preview of the new tools and workflows for collecting, analyzing, and contextualizing Metal performance data.
- 1:51 - Metal performance metrics
A tour of the Metal performance metrics available through tools like the Metal Performance HUD, covering FPS, GPU time, frame interval, layer sizes, composition mode, and MetalFX-related metrics.
- 3:32 - Trace collection
How to collect performance traces using the Game Performance Overview template in Instruments for desk testing, and the new always-on system-level data collection on iOS and macOS that stores Metal performance metrics for days.
- 6:38 - Analyze performance traces
How to analyze collected traces using the metalperftrace command-line tool on macOS — printing overviews, exporting JSON for scripting or AI agents — and how to open and visualize traces in Instruments to identify FPS drops and other anomalies.
- 10:08 - Contextualize with StateReporting
Introduces the StateReporting API, which lets you describe your game's behavior and state over time using domains, states, and metadata. Learn how state transitions appear in the Metal Performance HUD, metalperftrace output, and Instruments tracks to make performance issues immediately actionable.
- 17:48 - Collect field data with MetricKit
How to use MetricKit in macOS and iOS 27 to collect Metal frame rate data and other performance metrics in the field after your game ships, including per-state breakdowns using StateReporting domains.
- 19:41 - Next steps
Key takeaways and recommended next steps: adopt StateReporting, try the new trace collection tools and metalperftrace CLI, and explore related Metal developer tools documentation.