-
Donnez une nouvelle dimension à Swift Charts avec la 3D
Découvrez comment donner une troisième dimension à vos graphiques Swift 2D avec Chart3D et visualiser vos ensembles de données sous des perspectives entièrement nouvelles. Représentez vos données en 3D, visualisez des surfaces mathématiques et personnalisez chaque élément, de la caméra aux matériaux, afin de rendre vos graphiques 3D encore plus intuitifs et attrayants.
Pour tirer le meilleur parti de cette séance, nous vous recommandons de vous familiariser avec la création de graphiques Swift 2D.Chapitres
- 0:00 - Introduction
- 1:54 - Tracé en 3D
- 5:05 - Tracé de surface
- 7:03 - Personnalisation
Ressources
Vidéos connexes
WWDC24
WWDC22
-
Rechercher dans cette vidéo…
-
-
2:03 - A scatterplot of a penguin's flipper length and weight
// A scatterplot of a penguin's flipper length and weight import SwiftUI import Charts struct PenguinChart: View { var body: some View { Chart(penguins) { penguin in PointMark( x: .value("Flipper Length", penguin.flipperLength), y: .value("Weight", penguin.weight) ) .foregroundStyle(by: .value("Species", penguin.species)) } .chartXAxisLabel("Flipper Length (mm)") .chartYAxisLabel("Weight (kg)") .chartXScale(domain: 160...240) .chartYScale(domain: 2...7) .chartXAxis { AxisMarks(values: [160, 180, 200, 220, 240]) { AxisTick() AxisGridLine() AxisValueLabel() } } .chartYAxis { AxisMarks(values: [2, 3, 4, 5, 6, 7]) { AxisTick() AxisGridLine() AxisValueLabel() } } } } -
2:39 - A scatterplot of a penguin's beak length and weight
// A scatterplot of a penguin's beak length and weight import SwiftUI import Charts struct PenguinChart: View { var body: some View { Chart(penguins) { penguin in PointMark( x: .value("Beak Length", penguin.beakLength), y: .value("Weight", penguin.weight) ) .foregroundStyle(by: .value("Species", penguin.species)) } .chartXAxisLabel("Beak Length (mm)") .chartYAxisLabel("Weight (kg)") .chartXScale(domain: 30...60) .chartYScale(domain: 2...7) .chartXAxis { AxisMarks(values: [30, 40, 50, 60]) { AxisTick() AxisGridLine() AxisValueLabel() } } .chartYAxis { AxisMarks(values: [2, 3, 4, 5, 6, 7]) { AxisTick() AxisGridLine() AxisValueLabel() } } } } -
2:51 - A scatterplot of a penguin's beak length and flipper length
// A scatterplot of a penguin's beak length and flipper length import SwiftUI import Charts struct PenguinChart: View { var body: some View { Chart(penguins) { penguin in PointMark( x: .value("Beak Length", penguin.beakLength), y: .value("Flipper Length", penguin.flipperLength) ) .foregroundStyle(by: .value("Species", penguin.species)) } .chartXAxisLabel("Beak Length (mm)") .chartYAxisLabel("Flipper Length (mm)") .chartXScale(domain: 30...60) .chartYScale(domain: 160...240) .chartXAxis { AxisMarks(values: [30, 40, 50, 60]) { AxisTick() AxisGridLine() AxisValueLabel() } } .chartYAxis { AxisMarks(values: [160, 180, 200, 220, 240]) { AxisTick() AxisGridLine() AxisValueLabel() } } } } -
3:28 - A scatterplot of a penguin's flipper length, beak length, and weight
// A scatterplot of a penguin's flipper length, beak length, and weight import SwiftUI import Charts struct PenguinChart: View { var body: some View { Chart3D(penguins) { penguin in PointMark( x: .value("Flipper Length", penguin.flipperLength), y: .value("Weight", penguin.weight), z: .value("Beak Length", penguin.beakLength) ) .foregroundStyle(by: .value("Species", penguin.species)) } .chartXAxisLabel("Flipper Length (mm)") .chartYAxisLabel("Weight (kg)") .chartZAxisLabel("Beak Length (mm)") .chartXScale(domain: 160...240, range: -0.5...0.5) .chartYScale(domain: 2...7, range: -0.5...0.5) .chartZScale(domain: 30...60, range: -0.5...0.5) .chartXAxis { AxisMarks(values: [160, 180, 200, 220, 240]) { AxisTick() AxisGridLine() AxisValueLabel() } } .chartYAxis { AxisMarks(values: [2, 3, 4, 5, 6, 7]) { AxisTick() AxisGridLine() AxisValueLabel() } } .chartZAxis { AxisMarks(values: [30, 40, 50, 60]) { AxisTick() AxisGridLine() AxisValueLabel() } } } } -
5:19 - A surface plot showing mathematical functions (x * z)
// A surface plot showing mathematical functions import SwiftUI import Charts var SurfacePlotChart: View { var body: some View { Chart3D { SurfacePlot(x: "X", y: "Y", z: "Z") { x, z in // (Double, Double) -> Double x * z } } } } -
5:43 - A surface plot showing mathematical functions
// A surface plot showing mathematical functions import SwiftUI import Charts var SurfacePlotChart: View { var body: some View { Chart3D { SurfacePlot(x: "X", y: "Y", z: "Z") { x, z in // (Double, Double) -> Double (sin(5 * x) + sin(5 * z)) / 2 } } } } -
5:46 - A surface plot showing mathematical functions (-z)
// A surface plot showing mathematical functions import SwiftUI import Charts var SurfacePlotChart: View { var body: some View { Chart3D { SurfacePlot(x: "X", y: "Y", z: "Z") { x, z in // (Double, Double) -> Double -z } } } } -
6:19 - Present a linear regression of the penguin data
// Present a linear regression of the penguin data import SwiftUI import Charts import CreateML import TabularData final class LinearRegression: Sendable { let regressor: MLLinearRegressor init<Data: RandomAccessCollection>( _ data: Data, x xPath: KeyPath<Data.Element, Double>, y yPath: KeyPath<Data.Element, Double>, z zPath: KeyPath<Data.Element, Double> ) { let x = Column(name: "X", contents: data.map { $0[keyPath: xPath] }) let y = Column(name: "Y", contents: data.map { $0[keyPath: yPath] }) let z = Column(name: "Z", contents: data.map { $0[keyPath: zPath] }) let data = DataFrame(columns: [x, y, z].map { $0.eraseToAnyColumn() }) regressor = try! MLLinearRegressor(trainingData: data, targetColumn: "Y") } func callAsFunction(_ x: Double, _ z: Double) -> Double { let x = Column(name: "X", contents: [x]) let z = Column(name: "Z", contents: [z]) let data = DataFrame(columns: [x, z].map { $0.eraseToAnyColumn() }) return (try? regressor.predictions(from: data))?.first as? Double ?? .nan } } let linearRegression = LinearRegression( penguins, x: \.flipperLength, y: \.weight, z: \.beakLength ) struct PenguinChart: some View { var body: some View { Chart3D { ForEach(penguins) { penguin in PointMark( x: .value("Flipper Length", penguin.flipperLength), y: .value("Weight", penguin.weight), z: .value("Beak Length", penguin.beakLength), ) .foregroundStyle(by: .value("Species", penguin.species)) } SurfacePlot(x: "Flipper Length", y: "Weight", z: "Beak Length") { flipperLength, beakLength in linearRegression(flipperLength, beakLength) } .foregroundStyle(.gray) } .chartXAxisLabel("Flipper Length (mm)") .chartYAxisLabel("Weight (kg)") .chartZAxisLabel("Beak Length (mm)") .chartXScale(domain: 160...240, range: -0.5...0.5) .chartYScale(domain: 2...7, range: -0.5...0.5) .chartZScale(domain: 30...60, range: -0.5...0.5) .chartXAxis { AxisMarks(values: [160, 180, 200, 220, 240]) { AxisTick() AxisGridLine() AxisValueLabel() } } .chartYAxis { AxisMarks(values: [2, 3, 4, 5, 6, 7]) { AxisTick() AxisGridLine() AxisValueLabel() } } .chartZAxis { AxisMarks(values: [30, 40, 50, 60]) { AxisTick() AxisGridLine() AxisValueLabel() } } } } -
7:50 - Adjust the initial chart pose (Default)
// Adjust the initial chart pose import SwiftUI import Charts struct PenguinChart: View { @State var pose: Chart3DPose = .default var body: some View { Chart3D(penguins) { penguin in PointMark( x: .value("Flipper Length", penguin.flipperLength), y: .value("Weight", penguin.weight), z: .value("Beak Length", penguin.beakLength) ) .foregroundStyle(by: .value("Species", penguin.species)) } .chart3DPose($pose) .chartXAxisLabel("Flipper Length (mm)") .chartYAxisLabel("Weight (kg)") .chartZAxisLabel("Beak Length (mm)") .chartXScale(domain: 160...240, range: -0.5...0.5) .chartYScale(domain: 2...7, range: -0.5...0.5) .chartZScale(domain: 30...60, range: -0.5...0.5) .chartXAxis { AxisMarks(values: [160, 180, 200, 220, 240]) { AxisTick() AxisGridLine() AxisValueLabel() } } .chartYAxis { AxisMarks(values: [2, 3, 4, 5, 6, 7]) { AxisTick() AxisGridLine() AxisValueLabel() } } .chartZAxis { AxisMarks(values: [30, 40, 50, 60]) { AxisTick() AxisGridLine() AxisValueLabel() } } } } -
8:02 - Adjust the initial chart pose (Front)
// Adjust the initial chart pose import SwiftUI import Charts struct PenguinChart: View { @State var pose: Chart3DPose = .front var body: some View { Chart3D(penguins) { penguin in PointMark( x: .value("Flipper Length", penguin.flipperLength), y: .value("Weight", penguin.weight), z: .value("Beak Length", penguin.beakLength) ) .foregroundStyle(by: .value("Species", penguin.species)) } .chart3DPose($pose) .chartXAxisLabel("Flipper Length (mm)") .chartYAxisLabel("Weight (kg)") .chartZAxisLabel("Beak Length (mm)") .chartXScale(domain: 160...240, range: -0.5...0.5) .chartYScale(domain: 2...7, range: -0.5...0.5) .chartZScale(domain: 30...60, range: -0.5...0.5) .chartXAxis { AxisMarks(values: [160, 180, 200, 220, 240]) { AxisTick() AxisGridLine() AxisValueLabel() } } .chartYAxis { AxisMarks(values: [2, 3, 4, 5, 6, 7]) { AxisTick() AxisGridLine() AxisValueLabel() } } .chartZAxis { AxisMarks(values: [30, 40, 50, 60]) { AxisTick() AxisGridLine() AxisValueLabel() } } } } -
8:09 - Adjust the initial chart pose (Custom)
// Adjust the initial chart pose import SwiftUI import Charts struct PenguinChart: View { @State var pose = Chart3DPose( azimuth: .degrees(20), inclination: .degrees(7) ) var body: some View { Chart3D(penguins) { penguin in PointMark( x: .value("Flipper Length", penguin.flipperLength), y: .value("Weight", penguin.weight), z: .value("Beak Length", penguin.beakLength) ) .foregroundStyle(by: .value("Species", penguin.species)) } .chart3DPose($pose) .chartXAxisLabel("Flipper Length (mm)") .chartYAxisLabel("Weight (kg)") .chartZAxisLabel("Beak Length (mm)") .chartXScale(domain: 160...240, range: -0.5...0.5) .chartYScale(domain: 2...7, range: -0.5...0.5) .chartZScale(domain: 30...60, range: -0.5...0.5) .chartXAxis { AxisMarks(values: [160, 180, 200, 220, 240]) { AxisTick() AxisGridLine() AxisValueLabel() } } .chartYAxis { AxisMarks(values: [2, 3, 4, 5, 6, 7]) { AxisTick() AxisGridLine() AxisValueLabel() } } .chartZAxis { AxisMarks(values: [30, 40, 50, 60]) { AxisTick() AxisGridLine() AxisValueLabel() } } } } -
9:15 - Adjust the initial chart pose and camera projection
// Adjust the initial chart pose and camera projection import SwiftUI import Charts struct PenguinChart: View { @State var pose = Chart3DPose( azimuth: .degrees(20), inclination: .degrees(7) ) var body: some View { Chart3D(penguins) { penguin in PointMark( x: .value("Flipper Length", penguin.flipperLength), y: .value("Weight", penguin.weight), z: .value("Beak Length", penguin.beakLength) ) .foregroundStyle(by: .value("Species", penguin.species)) } .chart3DPose($pose) .chart3DCameraProjection(.perspective) .chartXAxisLabel("Flipper Length (mm)") .chartYAxisLabel("Weight (kg)") .chartZAxisLabel("Beak Length (mm)") .chartXScale(domain: 160...240, range: -0.5...0.5) .chartYScale(domain: 2...7, range: -0.5...0.5) .chartZScale(domain: 30...60, range: -0.5...0.5) .chartXAxis { AxisMarks(values: [160, 180, 200, 220, 240]) { AxisTick() AxisGridLine() AxisValueLabel() } } .chartYAxis { AxisMarks(values: [2, 3, 4, 5, 6, 7]) { AxisTick() AxisGridLine() AxisValueLabel() } } .chartZAxis { AxisMarks(values: [30, 40, 50, 60]) { AxisTick() AxisGridLine() AxisValueLabel() } } } } -
9:24 - Customize the surface styles for a sinc function
// Customize the surface styles for a sinc function import SwiftUI import Charts struct SurfacePlotChart: View { var body: some View { Chart3D { SurfacePlot(x: "X", y: "Y", z: "Z") { x, z in let h = hypot(x, z) return sin(h) / h } } .chartXScale(domain: -10...10, range: -0.5...0.5) .chartZScale(domain: -10...10, range: -0.5...0.5) .chartYScale(domain: -0.23...1, range: -0.5...0.5) } } -
9:29 - Customize the surface styles for a sinc function (EllipticalGradient)
// Customize the surface styles for a sinc function import SwiftUI import Charts struct SurfacePlotChart: View { var body: some View { Chart3D { SurfacePlot(x: "X", y: "Y", z: "Z") { x, z in let h = hypot(x, z) return sin(h) / h } .foregroundStyle(EllipticalGradient(colors: [.red, .orange, .yellow, .green, .blue, .indigo, .purple])) } .chartXScale(domain: -10...10, range: -0.5...0.5) .chartZScale(domain: -10...10, range: -0.5...0.5) .chartYScale(domain: -0.23...1, range: -0.5...0.5) } } -
9:38 - Customize the surface styles for a sinc function (heightBased)
// Customize the surface styles for a sinc function import SwiftUI import Charts struct SurfacePlotChart: View { var body: some View { Chart3D { SurfacePlot(x: "X", y: "Y", z: "Z") { x, z in let h = hypot(x, z) return sin(h) / h } .foregroundStyle(.heightBased) } .chartXScale(domain: -10...10, range: -0.5...0.5) .chartZScale(domain: -10...10, range: -0.5...0.5) .chartYScale(domain: -0.23...1, range: -0.5...0.5) } } -
9:47 - Customize the surface styles for a sinc function (normalBased)
// Customize the surface styles for a sinc function

import SwiftUI
import Charts

struct SurfacePlotChart: View {
  var body: some View {
    Chart3D {
      SurfacePlot(x: "X", y: "Y", z: "Z") { x, z in
        let h = hypot(x, z)
        return sin(h) / h
      }
      .foregroundStyle(.normalBased)
    }
    .chartXScale(domain: -10...10, range: -0.5...0.5)
    .chartZScale(domain: -10...10, range: -0.5...0.5)
    .chartYScale(domain: -0.23...1, range: -0.5...0.5)
  }
}
-
-
- 0:00 - Introduction
Swift Charts prend en charge les graphiques 3D sous iOS, macOS et visionOS 26. Créez des visualisations 3D qui permettent aux utilisateurs d’explorer les données sous de nouveaux angles.
- 1:54 - Tracé en 3D
La création d’un graphique 3D est similaire à celle d’un graphique 2D. Découvrez comment un seul graphique 3D peut représenter plusieurs perspectives de graphiques 2D. Créez un nuage de points 3D avec PointMark et Chart3D. Les graphiques 3D sont interactifs et vous pouvez les faire pivoter pour révéler différentes informations, telles que des groupes de données. De nombreuses marques pour les graphiques 2D ont été repensées pour la 3D.
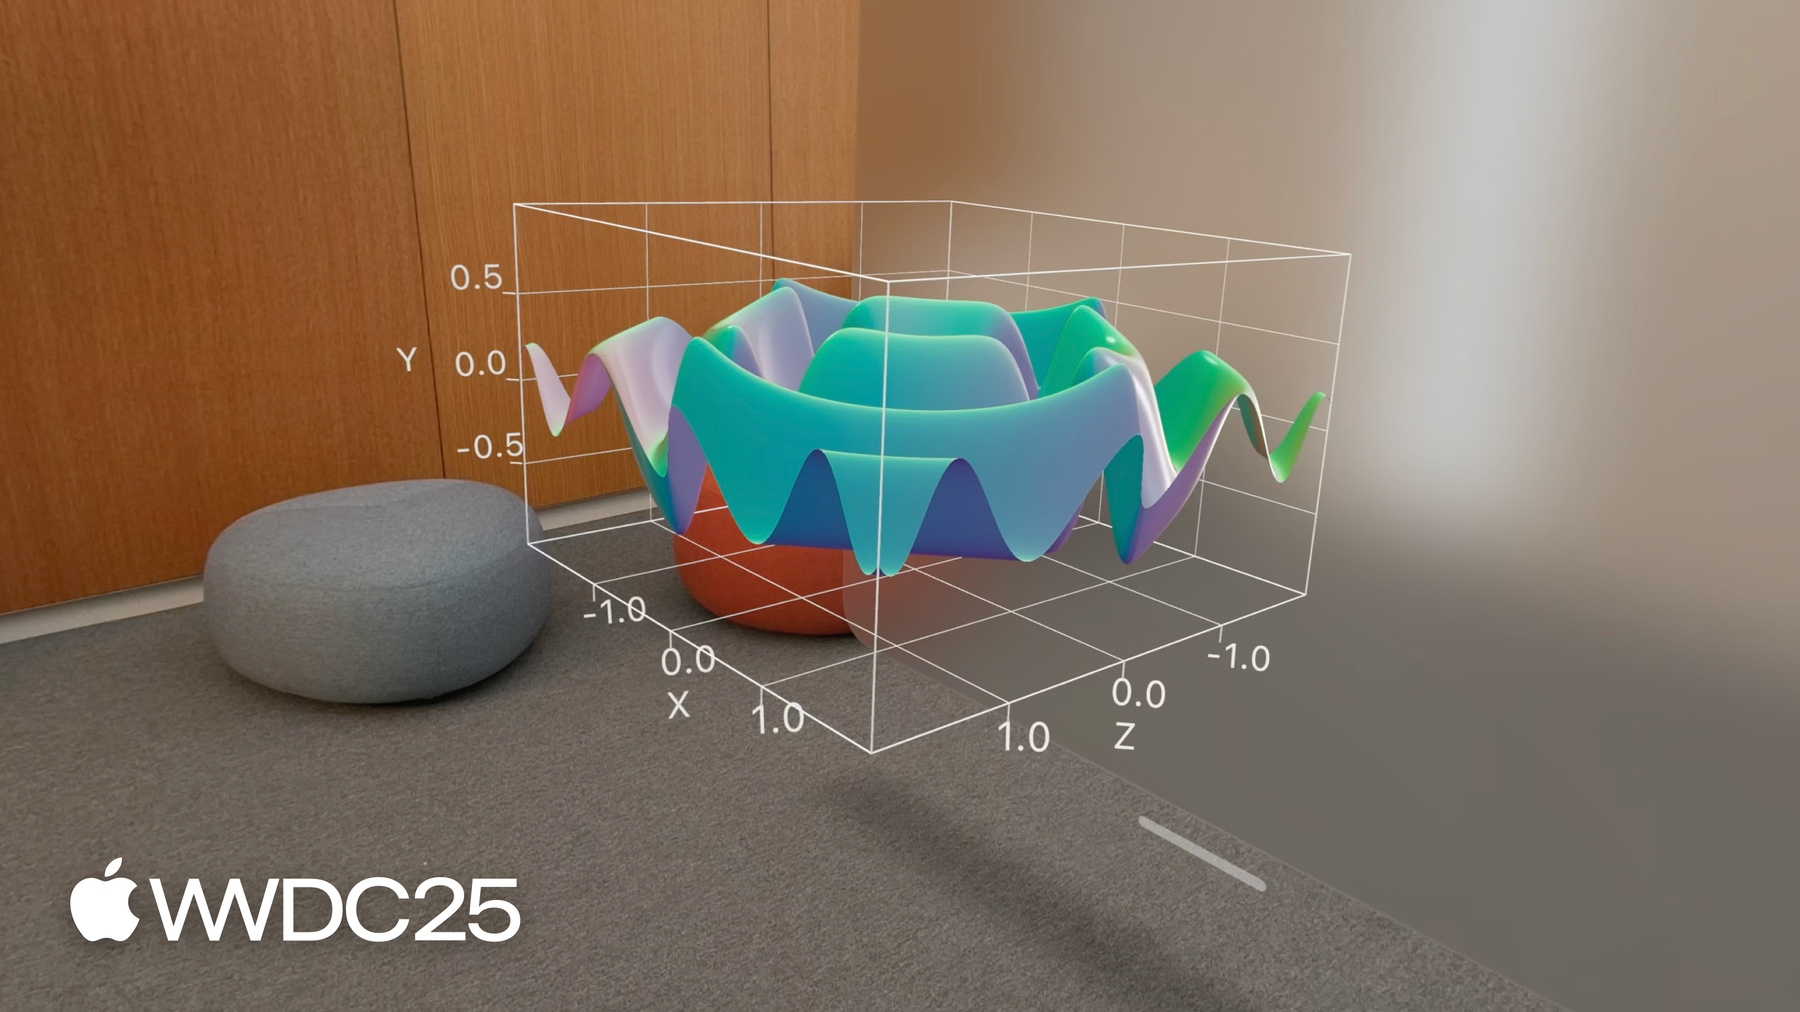
- 5:05 - Tracé de surface
SurfacePlot trace des fonctions de 2 variables en 3D et crée ainsi une surface continue. Que ce soit pour dessiner un simple plan ou pour créer des formes plus élaborées aux reliefs captivants, il suffit d’entrer une expression qui définit la hauteur y selon les coordonnées x et z du plan horizontal.
- 7:03 - Personnalisation
Swift Charts offre plusieurs options pour personnaliser l’aspect des graphiques en 3D. Vous pouvez ajuster l’angle de visualisation grâce à la fonction chart3DPose, et définir le rendu 3D avec chart3DCameraProjection. Les graphiques de surface bénéficient aussi de nouvelles options de style. Vous pouvez notamment modifier la couleur des points selon leur position ou leur hauteur relative sur la surface. En combinant ces fonctionnalités avec les nombreux paramètres déjà disponibles pour les graphiques 2D, vous pouvez créer des visualisations 3D élégantes et sur mesure.