

-
Maximize your monetization efforts with App Store Connect Analytics
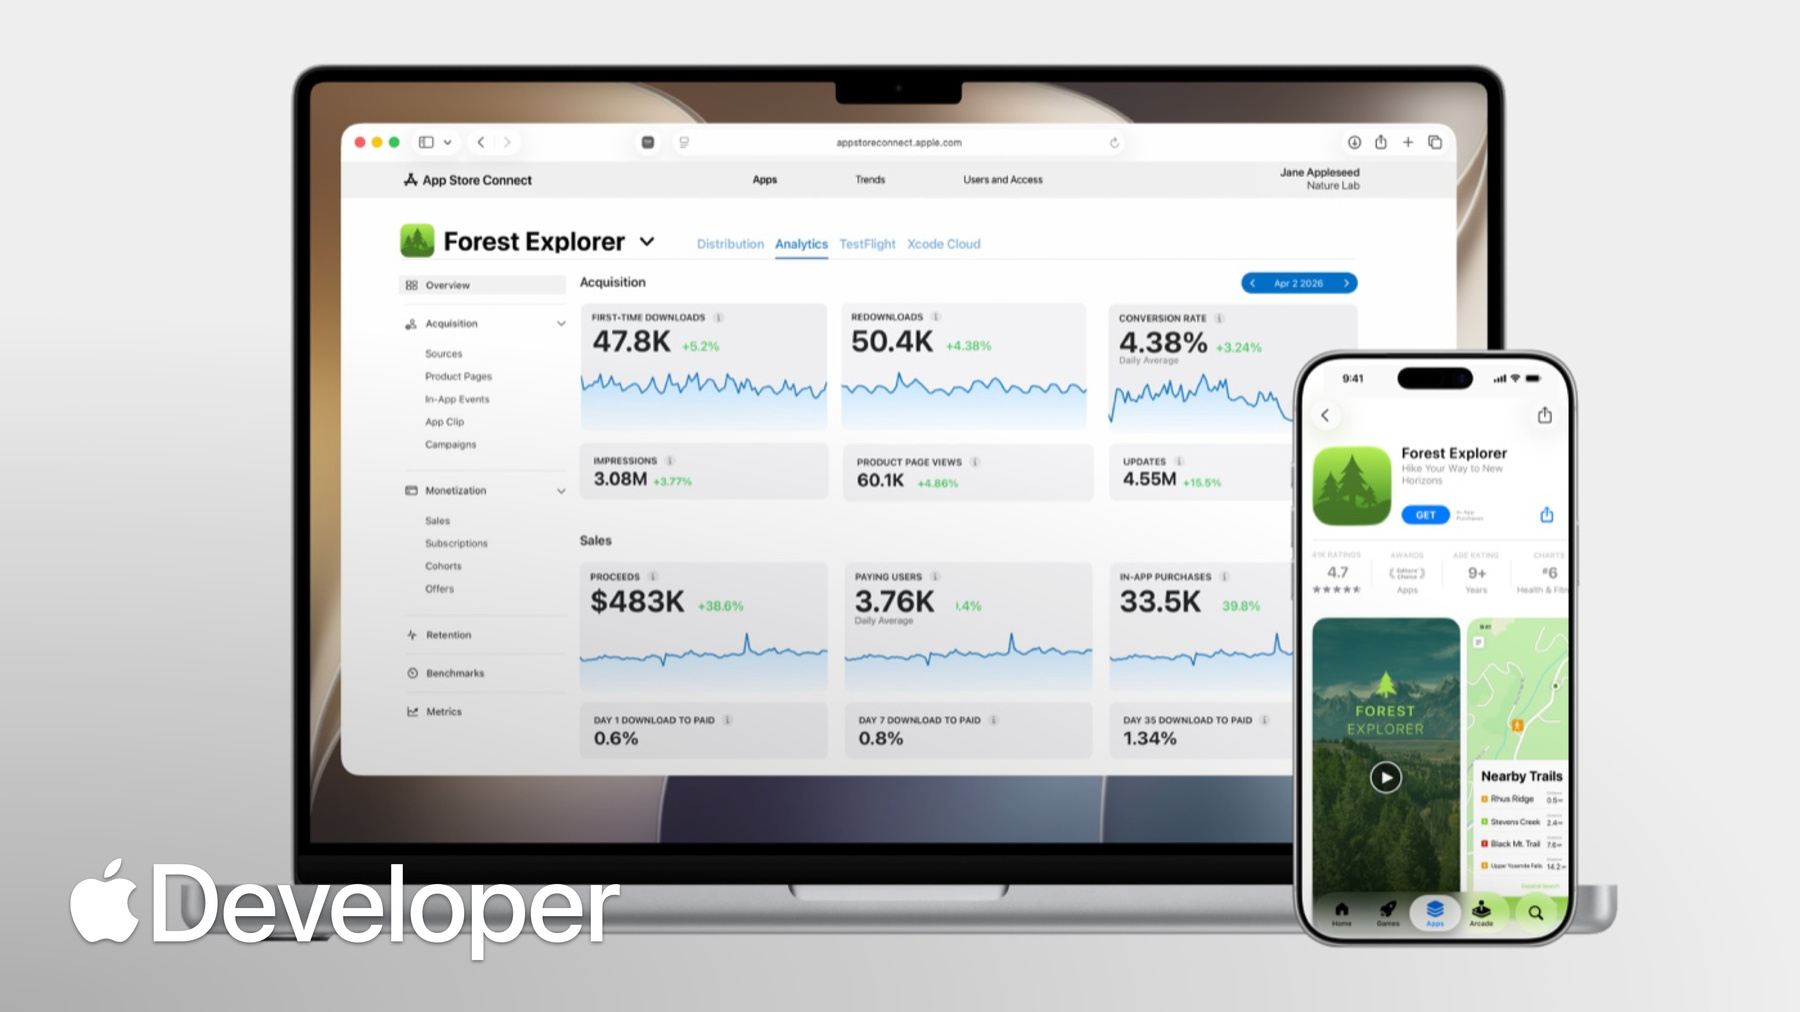
Learn how you can drive growth using App Store Connect Analytics. You'll explore key metrics and find out how to leverage monetization features to optimize your revenue strategy.
Resources
-
Search this video…
Hi, my name is Nick, a product manager on the App Store. Today I'm excited to talk to you about how data and analytics can help you maximize your monetization efforts on the App Store.
I'll start by showing you where you can go to analyze your in-app purchases. Then I'll dive deeper into measuring subscription and offer performance. And lastly, I'll talk about how you can export all of this data into your own systems using the Analytics Data API.
Let's get started.
Apple in-app purchase is a powerful commerce system that makes it easy for you to monetize your app at scale across all of Apple's platforms, and App Store Connect gives you over 100 metrics to measure your app's success. To access it, simply click on the analytics tab at the top of App Store Connect.
This will bring you to the analytics homepage where all of your data lives. The Analytics Home page is organized based on the customer journey, with acquisition metrics appearing at the top and sales metrics appearing below.
For apps using in-app purchases, the monetization section is enabled in the sidebar, providing you with convenient access to all revenue metrics for your app. Let's check it out by clicking on the sales tab.
Your sales dashboard is broken down into multiple sections. At the top, we show you three of the most important metrics for monitoring the health of your business on the App Store: Proceeds, which is the amount of money you’ve earned; Paying users, which is the number of users who made a purchase in the app; and in-app purchases, which is the total number of purchases those users made.
Clicking on one of the metrics will take you to the detailed metrics page, where you can analyze your data over time. You also have access to many more metrics in here to help you analyze different aspects of your app business.
You can find these in the metrics picker, allowing you to analyze data on sales, paying users, and refund rates.
You can also filter each metric by over a dozen different fields, such as by device, region, or campaign. So you can dig deeper into what's driving your business forward.
Now that we understand the basics, let's go to the cohorts page and dig deeper into payer behavior.
The cohorts page gives you advanced metrics that let you analyze user behavior over time.
This dashboard has two important metrics at the top: Download to Paid conversion and Accumulated Proceeds. Download to paid conversion tells you how long it typically takes for a user to make their first purchase, and what percentage of people make a purchase at all. For example, after one day, 1% of users who downloaded this app made a purchase and after 60 days it's up to 3%.
And the accumulated proceeds chart shows how much money each user spends in your app after downloading it, and how much they continue to spend over time. These two charts are very helpful for managing your marketing, because they can tell you how much you can afford to spend and how long it might take before you get a return on your marketing investment.
Below the cohort charts, we also show you peer group benchmarks so you can compare your app's performance to apps like yours.
Looking at the download to paid conversion metric and its corresponding benchmark, you can see that 3% of downloaders are turning into paying users after 35 days, which is between the 25th and 50th percentile of the app's peer group. And this means that this app's payer conversion rate is slightly below average.
At the same time, accumulated proceeds show a steady growth. And by day 35, users are spending around $25 on the app.
For this metric, the app's performance is above the 75th percentile, showing that users who spend in this app typically spend more than they do in similar apps.
Let's dive even deeper into these metrics by clicking on See All. This brings you to the cohort analysis page. Now this is an important view, so let's take a moment to understand it.
To do that, let's focus on the second row here in the table. Here you can see that out of 59,000 users who downloaded the app in the month of May, 2.9% of them made their first paid in-app purchase within 35 days of downloading the app.
To see an average of these metrics over the past 12 months. You can look at the top row. In this example, the day 35 download to paid conversion for the app is 3% as we saw before.
Additionally, the colors in this chart help you visualize the build up of paying users over time, making it easy to see an entire year's worth of data in a single chart.
You can select from several different cohort metrics to analyze different stages of the customer funnel, including download to paid and proceeds per download, which we covered earlier, and also download to offer conversion and subscription retention, which we'll cover later.
You can also add filters to focus on a specific subset of users. Let's add a filter to look at users who downloaded our app through one of our custom product pages.
After applying the filter, you'll notice that in this case, only 1.3% of people who downloaded through our running custom product page made a purchase within the first 35 days. And that's much lower than the 3% average we saw before. And so this means that the users who came in from our running custom product page are less likely to make a purchase compared to the rest of the user base.
With this insight, you have a number of options. Perhaps you could improve the onboarding experience for runners to clearly surface the value proposition early on. You could also try to add more features for runners, so they're more likely to see value in your app. Or maybe you want to focus on a different kind of user entirely that engages more with what your app offers.
Now that you understand how to analyze in-app purchases, let's explore how you can analyze subscription and offer performance for apps with auto renewable subscriptions. The subscription section will be enabled in the sidebar, giving you a wealth of information about your app subscription performance.
At the top, you'll see the total number of active plans, which includes users on free trials, paid offers, and full price subscriptions. You'll also see the number of users on a paid plan, which excludes offers, as well as monthly recurring revenue from all paid plans.
Below that, the Net Paid Plans chart can help you see what's driving changes in your fully paid subscriber base over time. Events that add to your subscriber base are shown on the top, including new plan starts and the number of plans that converted from offer to paid. And events that subtract from your paid subscriber base are shown at the bottom, including the number of plans that churned out or moved from a paid state to an offer state. With this chart, you can quickly see if you should focus more on improving subscriber acquisition or preventing subscriber churn.
Further down the page. You can also see subscription retention, which tells you what percentage of your subscribers remain subscribed at least one month, three months, six months, and 12 months after initially subscribing, and we'll dig deeper into this later.
And lastly, you can also break down your results by plan name. So you can see which of your plans are most popular.
To dive deeper into your subscription performance, check out the Inline Metrics page. This page includes more than 50 metrics grouped into categories: States, Events, and Monthly Recurring Revenue.
The state metrics provide a snapshot of your subscription business at a particular point in time. For example, as of today, how many plans are currently on an offer? How many are currently paying full price, and how many have a billing issue? On the other hand, the event metrics show what happened on a particular day. For example, how many offer starts, plan renewals or churns happened yesterday or last week? Now that we understand these metrics, let's navigate back to the cohorts view and select the subscription retention metric in the dropdown. This chart will give us a rich understanding of retention and churn over time.
While this chart looks similar to the payer conversion chart, the retention view shows what percent of users are keeping their subscriptions in the months after they originally subscribed to your app.
For example, if you look at the month six column in the top row, you can see that on average, 73% of users are still subscribed six months after they initiated their subscriptions.
Like before, we can also filter this data in many different ways. Let's apply the running Custom product page filter to see how long users who downloaded the app from the Running Theme product page stayed subscribed for.
With this filter applied, we can see that the month six average subscription retention for runners is 81%, higher than the 73% across all subscribers, meaning that our runners tend to stay subscribed longer than average. And this is the type of nuanced analysis that's critical to making smart decisions about your app business.
Let’s now look at the offers section, which is enabled if you have free trials or paid offers in your app. Similar to the other summary pages, the offers summary provides an overview of offer performance. It includes data about active offers, offer starts, offer growth drivers, and the breakdown by territory and source.
You also have the inline metrics page for this one too, which includes metrics like offer starts, offer renewals, offer to paid conversions, and more. This way, you can measure the full offer lifecycle and see which offers give you the best results.
Lastly, let's look at how you can download monetization data at scale.
App Store Connect provides you with an analytics API that you can use to easily export data into your own systems.
These reports include data across the full app lifecycle, and you can find all of your monetization data in the purchases, subscription state, subscription event, and retention messaging reports. You can refer to the detailed documentation on developer.apple.com to learn more about what's inside.
We covered a lot of topics today, so here are the key highlights. You can measure your app's monetization with over 100 metrics in App Store Connect. You can analyze payer behavior, including download to paid conversion and accumulated proceeds to help you inform your marketing spend. You can understand how your app stacks up to apps like yours with peer group benchmarks. You can uncover deep insights with advanced charts and filters, and you can export your monetization data at scale using the analytics API.
For even more information, please refer to our comprehensive analytics guide, also available on developer.apple.com, which includes detailed explanations of all the data available in App Store Connect. Thank you so much for watching and I can't wait to see what you'll build.
-