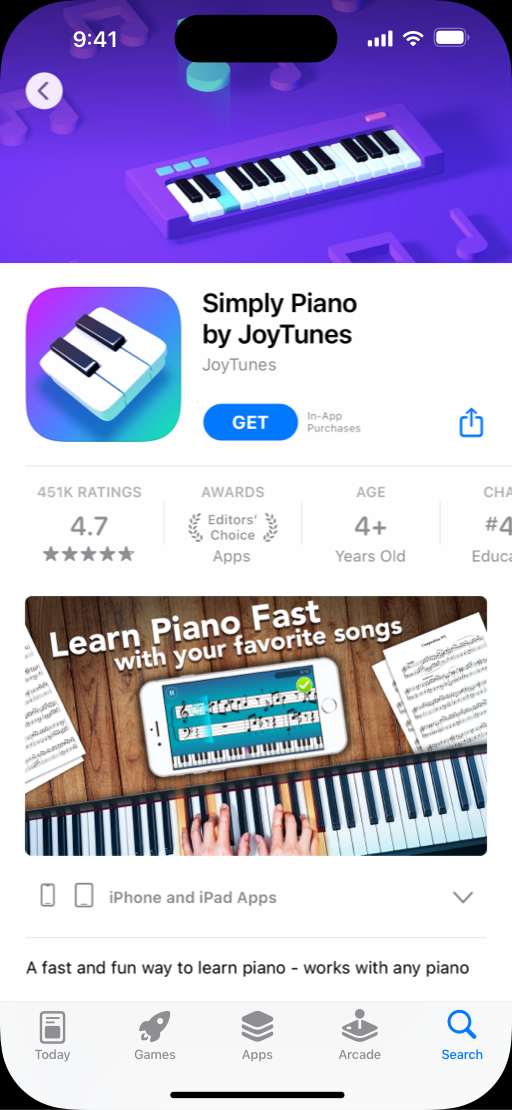
Hypothesis: Adding an app preview video as the first asset on the product page will result in higher conversion compared to only screenshots.
Test details:
Duration: 12 days
Assets tested: App preview video
Number of treatments: 1
Results: The original product page without an app preview video outperformed the treatment, contrary to the developer’s hypothesis.
3%
Conversion rate increase 100% confidence
Control
Treatment +3%
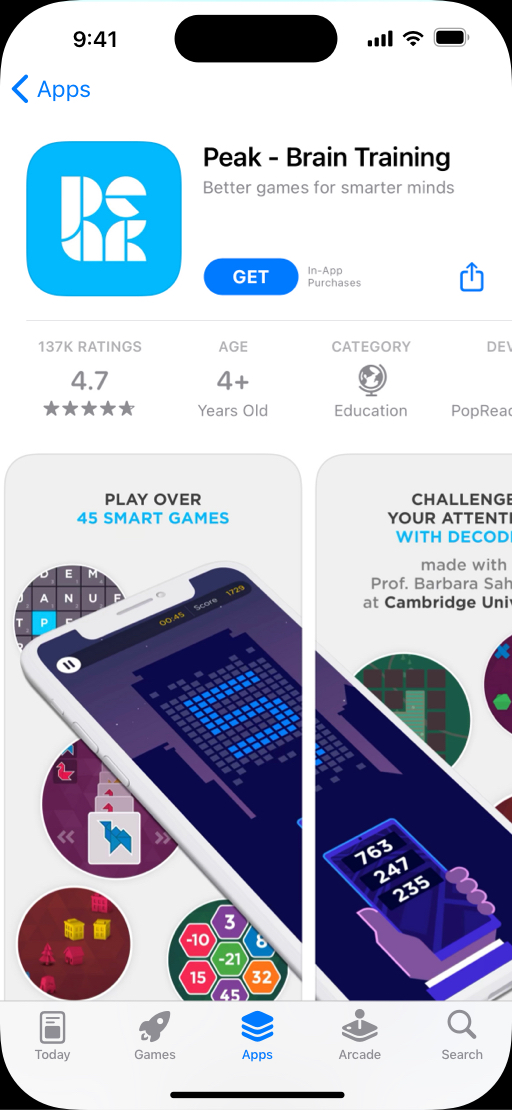
Developer story
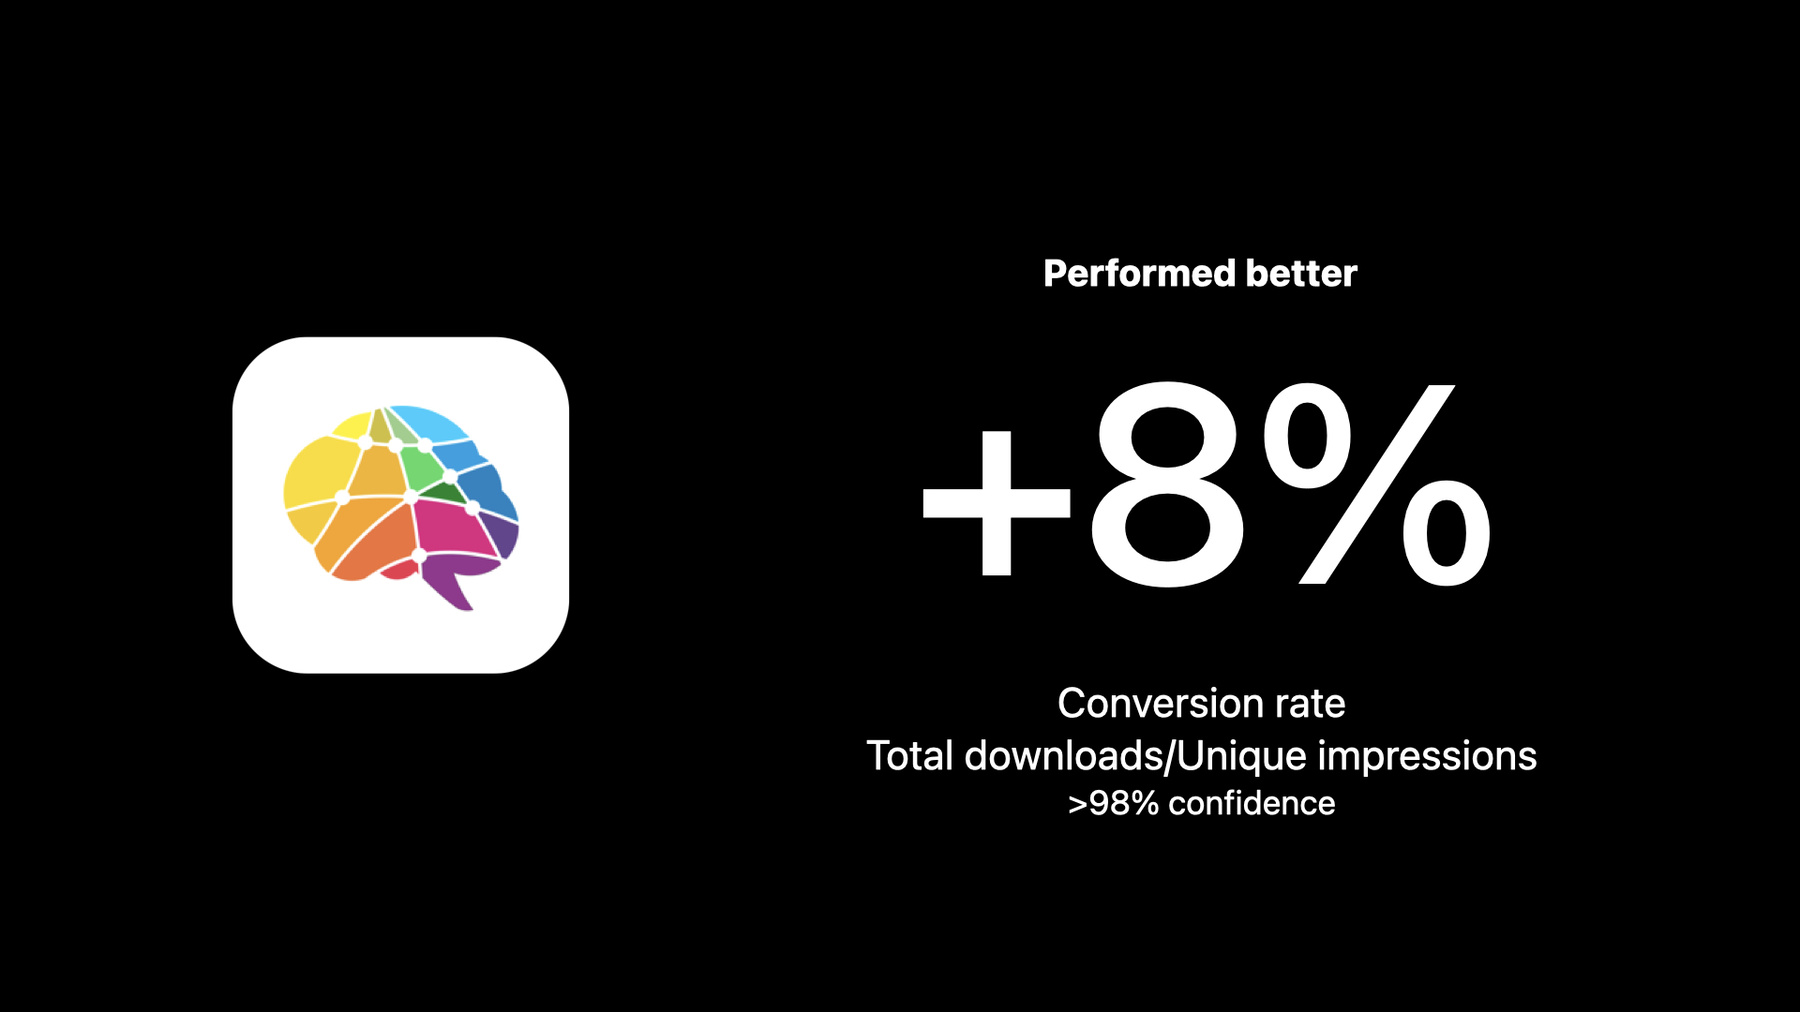
Peak Brain Training
Hypothesis: App icons with a robot design will convert better than other icon designs.
Test details:
Duration: 44 days
Assets tested: App icons
Number of treatments: 3
Results: The brain icon performed better than the robots icon and other icon designs tested. The developer went further by reviewing the top treatment’s performance to better understand in-app engagement and purchase conversion within their app.
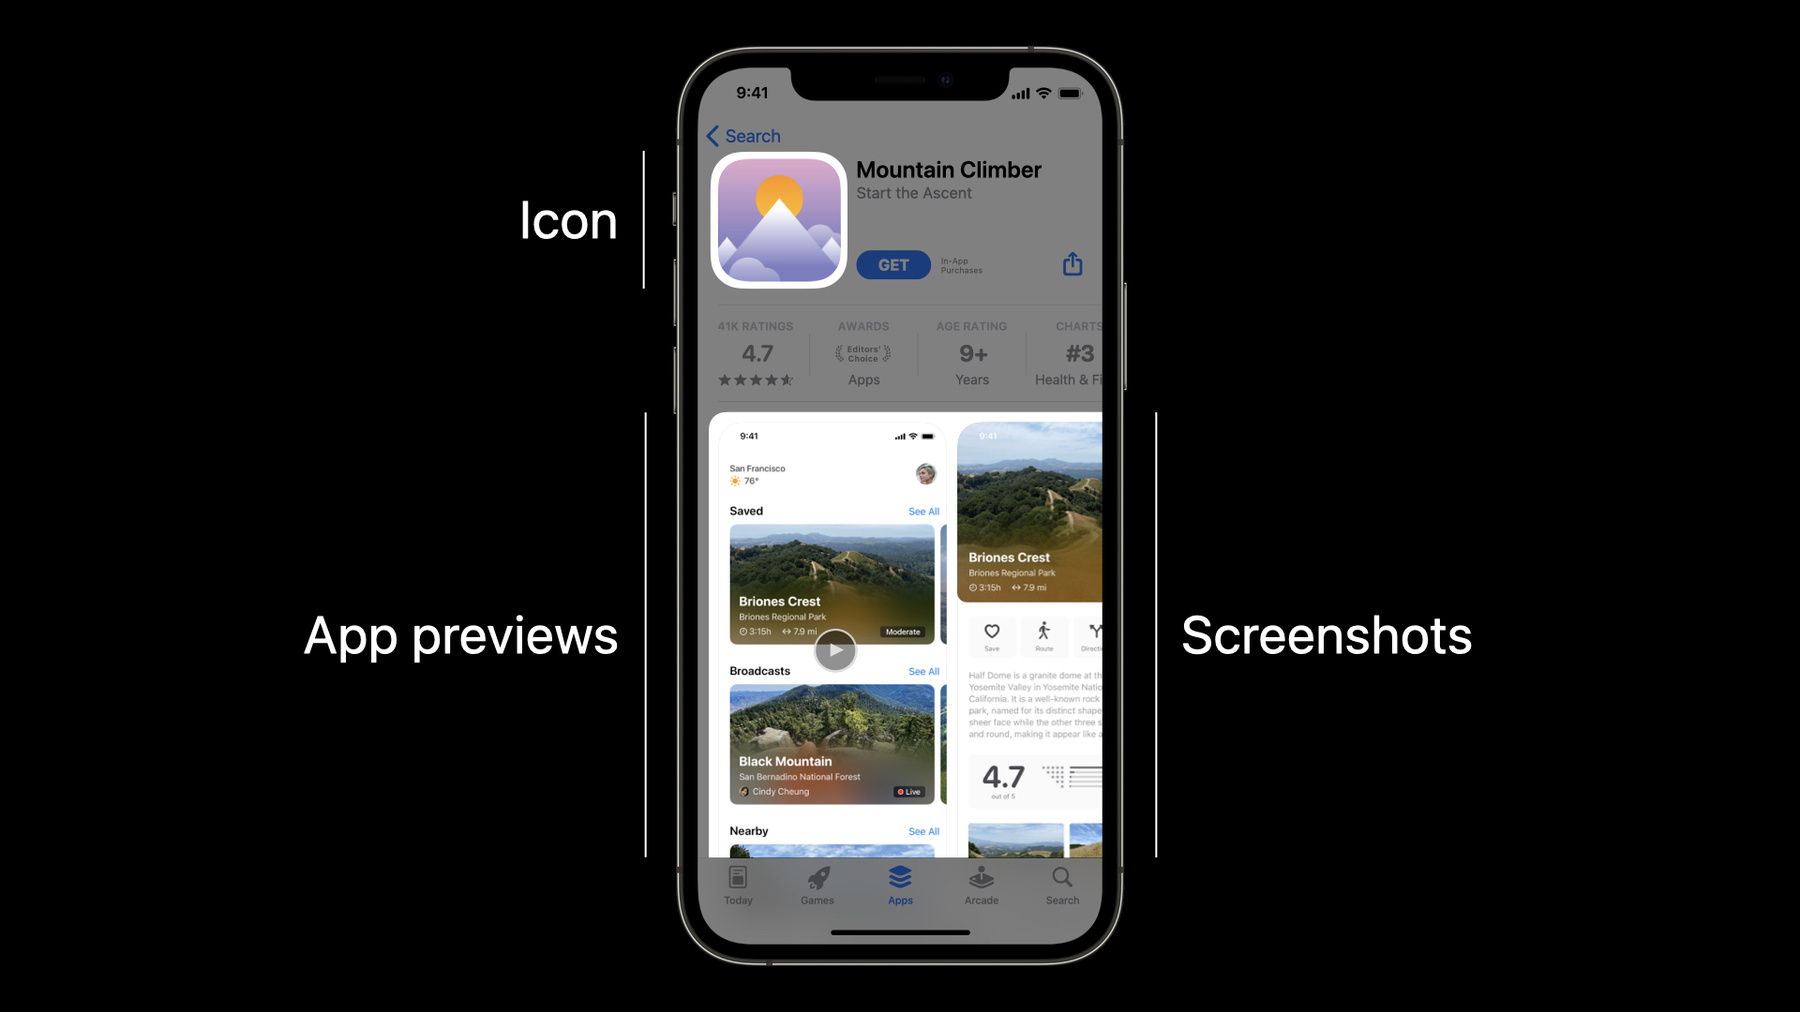
Compare different app icons, screenshots, and app previews on your App Store product page to find out which resonate with people most. Test up to three alternate product page versions against your original, view the results in App Analytics, and set the best performing version to display to everyone on the App Store.
Use product page optimization to test different elements of your App Store product page (or pre-order page) — including app icons, screenshots, and app preview videos — to understand which results in the most engagement. As your test progresses, you can compare how each treatment performs against your original product page, then optimize your product page using this information.
For example, you can find out if:
Showcasing a certain character or value proposition gets better results.
Highlighting a particular feature or culturally relevant content for a specific localization results in an uptick in downloads in that location.
Changing your app icon to a different style or color improves your conversion rate.
Including seasonal content leads to more downloads.
To do so, you’ll create alternate versions of your product page, called treatments. These will be shown to a percentage of randomly selected people on the App Store in iOS and iPadOS 15 or later, who will see the same treatment for the duration of your test. If a treatment includes an alternate app icon, this icon will display on the App Store as well as on their device (if they’ve downloaded your app). Like your original product page, any alternate screenshots, app preview videos, or icons used in your treatments may appear in search results, as well as on the Today, Games, and Apps tabs.
Provide a reference name. Name your test in up to 64 characters. Be descriptive so you can easily identify your test when viewing results in App Analytics — for example, “Spring 2022 Icon Color Test with 3 icons.”
Select the number of treatments. A test can include up to three treatments with alternate app icons, screenshots, and app previews.
Choose your traffic proportion. Select the percentage of people who will be selected at random to be shown a treatment instead of your original App Store product page. For example, if you allocate 40% of your traffic to your test and have two treatments, each treatment receives 20% of your total traffic and your original product page receives the remaining 60% of your total traffic. People will see the same treatment whenever they visit the App Store throughout the duration of the test.
Each treatment can be localized in all of the languages that your app supports, or just those you choose. Keep in mind that your test may take longer to reach meaningful results, depending on the localizations you’ve selected.
Estimate your test duration. While this step is optional, it can help you understand if you’re likely to reach your desired conversion rate within 90 days. To see how long it might take to reach your goal, choose your desired improvement in conversion rate. Your app’s existing performance data, such as daily impressions and new downloads, are used to generate this estimate. Based on this selected conversion rate, you’ll see the estimated test duration and the number of impressions you’d need to reach an outcome with at least 90% confidence in the results. This estimate is provided as a guide and won’t impact the test. A test runs for 90 days or until you manually stop it within that time. If the estimate is more than 90 days, you may want to change your criteria — for example, by creating fewer treatments or increasing traffic allocation.
Set up test treatments. By default, each treatment includes your original app icon, screenshots, and app previews unless you provide alternate metadata. Consider how many elements you change in a treatment so you can more easily determine which one led to a particular result. Keep in mind that the more treatments you include in a test, the longer it may take to reach conclusive results.
You can create one test at a time which will run for up to 90 days. Keep in mind that you cannot change a test once it’s started. Before you can publish your test, any new metadata that you'd like to include in your treatments must be approved by App Review. If you plan to include any alternate app icons, you'll need to include all variants of your icon in the binary of your published app. Product page optimization tests that don't include any alternate app icons can be submitted for review independent of a new app version.
To view your test’s progress once it’s started, visit App Analytics in App Store Connect and select your test. You’ll see a performance dashboard which indicates whether your test needs to collect more data, or if a particular treatment is performing better or worse than the baseline. You can also see the number of impressions, conversion rate, percent improvement, and confidence level for each treatment compared to the chosen baseline (by default, this is set as your original product page). If your test includes multiple treatments, you can compare their performance to one another by changing the baseline at any time.
Applying a treatment
Based on your test results, you can choose to apply a treatment to your original product page so it displays to everyone on the App Store. Keep in mind that doing so while your test is still running will cause your test to end. We recommend waiting to apply a treatment or stop a test until at least one treatment has been declared to be performing better or worse than the baseline with at least 90% confidence. If your applied treatment includes an alternate app icon, be sure to include this icon when you submit a new app version in App Store Connect.