ストリーミングはほとんどのブラウザと
Developerアプリで視聴できます。
-
Create MLの新機能
インタラクティブなデータソースのプレビュー、visionOSアプリ向けオブジェクトトラッキングモデルの構築で使用する新しいテンプレートなど、Create MLの新機能をご紹介します。新しい時系列予測や分類のAPIなど、フレームワークの重要な機能強化についても取り上げます。
関連する章
- 0:00 - Introduction
- 0:51 - Overview
- 1:56 - App enhancements
- 3:45 - Object tracking
- 5:11 - Components
リソース
関連ビデオ
WWDC24
WWDC22
WWDC21
-
ダウンロード
Hi, my name is David, and I’m a machine learning engineer on the Create ML team. Thank you for joining me for what’s new in Create ML. Our goal is to give you the tools, to create amazing apps that use machine learning. With Create ML, you can customize powerful machine learning models that are built into the OS. In this video, I’ll start by giving an overview of the Create ML app and frameworks.
Then I’ll describe enhancements that we’ve made to your favorite templates in the Create ML App. Next, I’ll introduce a brand-new way of building machine learning models to track objects on Apple Vision Pro.
After that, I’ll go into detail about new components that you can use to build custom time-series forecasting and classification models.
Let’s get started. We’ve spent years building an ecosystem of machine learning tools that you can use to build and deploy models in your apps.
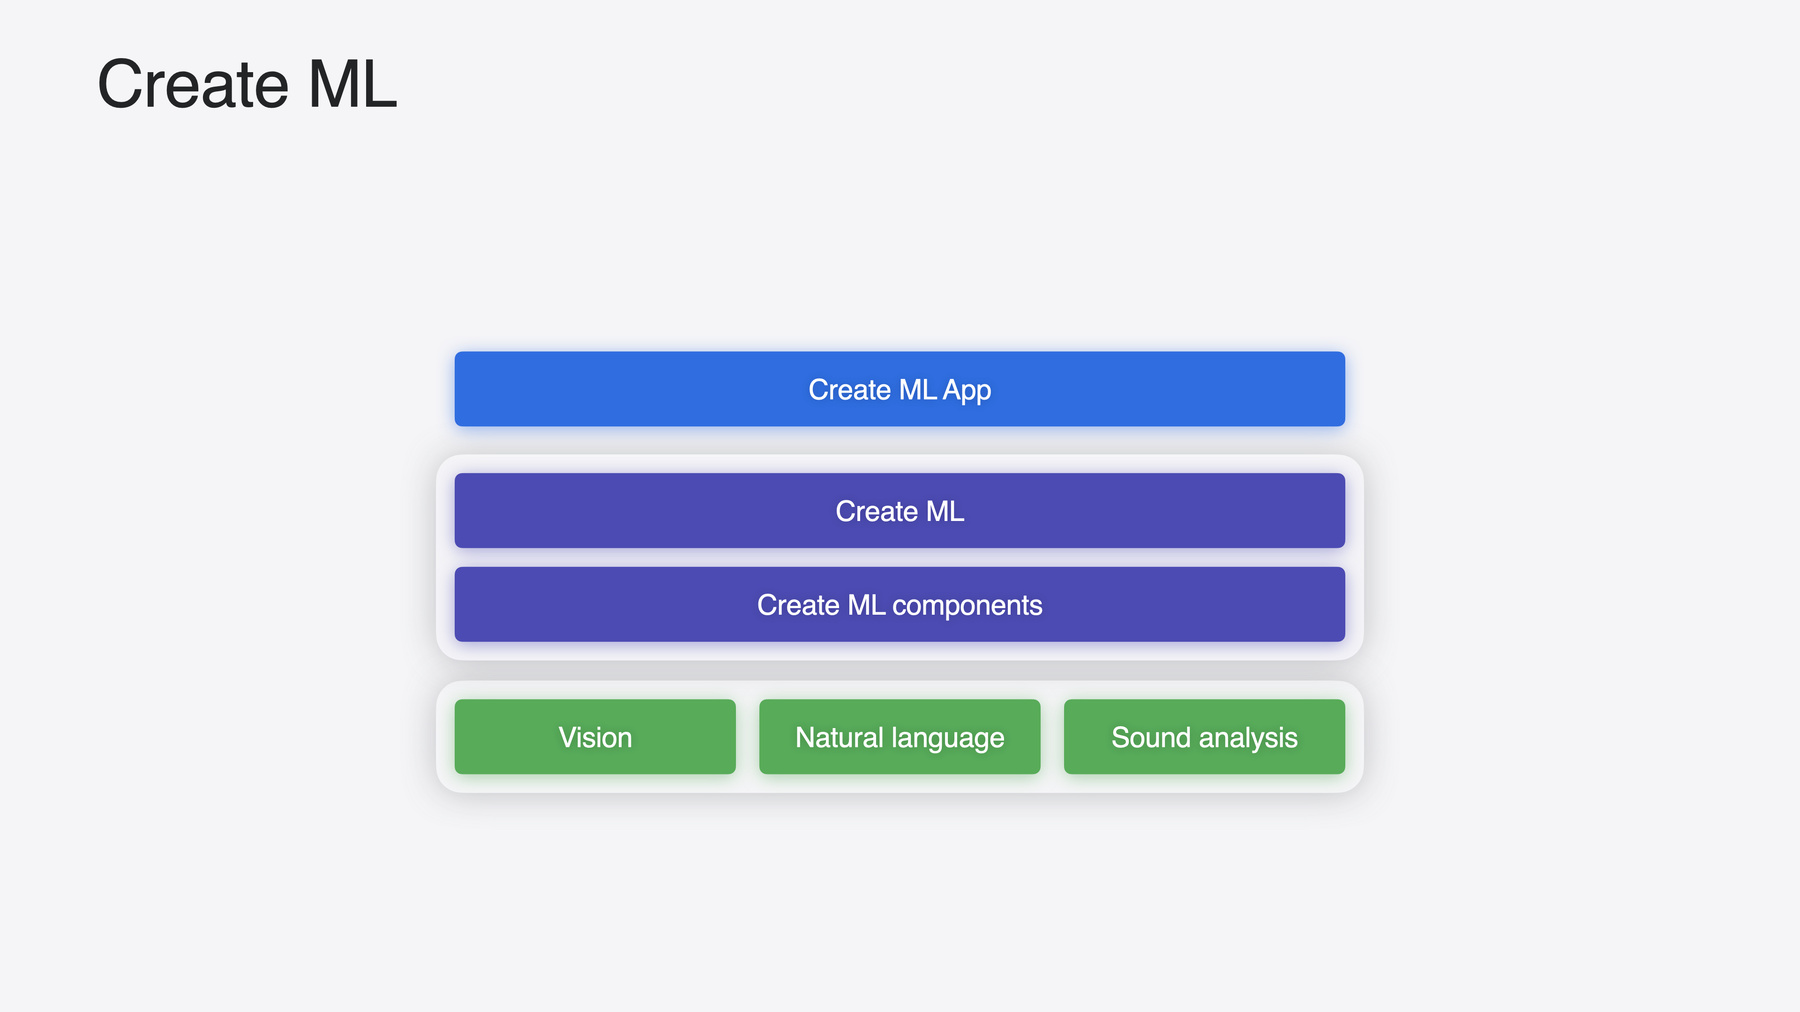
If you’re new to machine learning and not sure where to start, we have a video that. "Explore machine learning on Apple platforms", to get an overview of our ML frameworks. I’m going to focus on Create ML, which is an important part of the ecosystem. Create ML has a few parts, let me break it down for you. The Create ML App, Create ML Framework and underlying Components. You can start training models with the click of a button, using the Create ML App.
This is built on top of the frameworks. If you’re interested in automating model creation or building on-device personalization experiences, then use the frameworks directly. Underneath the hood, Create ML leverages system domain frameworks like Vision, Natural Language, and Sound Analysis to customize machine learning models to your use case with your training data.
The output of Create ML is a model. Which you can deploy into your app with the help of our system domain frameworks. Now I’d like to talk about enhancements we’ve made, to the Create ML App. The easiest place to get started when building custom machine learning models, is the Create ML App on your Mac.
You can create models that can predict the content of your images, videos, or tabular data. Models that can detect objects in images, sounds in audio files, human actions in videos, or activities.
I’ll choose object detection for now.
Regardless of which template you choose, the starting point is always the same. Your training data. Before training your model, it’s important to understand the nature of your annotations so that your model behaves in a way that matches your expectations. Let’s go through a practical example. Imagine you’re building an app that detects common breakfast items. Like a cup of coffee. While testing out your app, you discover that it detects both the surface of the coffee and the coffee cup. Duplicate predictions isn’t a great user-experience. This can happen when there’s an issue with your annotations. Let me show you a new way to visualize and debug your annotations. In the Create ML App, you can click on your data source on the left.
Which will display a distribution of your data.
The explore option is new.
You can drill into a specific object or class label to visualize your annotations. In this example, I’ve selected coffee. Notice that some images have a bounding box drawn on the surface, while others are drawn around the coffee cup.
Before you start training, preview your data source to verify that your annotations match your expectations. And, you can explore your data sources when building image-based models in the Create ML App. Including image classification and hand pose classification.
Now I’d like to turn your attention to a brand new feature that we’ve been working on that I think you’ll enjoy. Create ML is designed to help you easily integrate machine learning into your apps across all of our operating systems.
This year we designed something special for spatial computing experiences. I’m excited to introduce object tracking in Create ML. You can use it to build amazing immersive experiences on Apple Vision Pro, like this. Here I have an app that tracks a real-world globe object, and augments it with an orbiting Moon and the Earth’s core.
In the Create ML App, we’ve added a Spatial Category.
That’s where you can find a new template for building machine learning models, to track the spatial location and orientation of objects.
Training an object tracker starts like all of our other templates in Create ML, your training data.
The Create ML App makes the training process as easy as possible.
All you need is a 3D Asset of your object and the app generates all the training for you. It’s that simple.
I only wanted to show you a glimpse, because we dedicated a whole video to this feature. "Explore object tracking for visionOS" will take you through the full workflow, of building an object tracking experience and deploying it on Apple Vision Pro.
Now that I’ve covered what’s new in the App, I’d like to go deeper in the stack to talk about time-series in Create ML Components.
Put simply, a time series refers to numerical data that change over a period of time.
For example, the accelerometer on your watch, the GPS location of your phone, the temperature outside.
Strictly speaking, time series are uniformly sampled over time. In this video, I’ll consider other series as well, like business sales where there may be gaps.
Time-series classification is designed to answer the question, "what does this data represent?" For example, you may want to classify gestures like pinch, snap, or clench, using the accelerometer data from your Apple Watch. We’ve supported activity classification for a while now in Create ML. This year, we’re introducing a more powerful, general-purpose time series classifier component.
Another question that I’d like to focus on answering is, "what’s going to happen next?" Time-series forecasting is a brand new model type in Create ML, that learns from historical data to predict future values, over a period of time.
Just like the classifier, the forecaster is a general-purpose component. Which means you can use it to forecast just about anything, whether its audio, accelerometer, sales, or even something else I haven't considered. For example, by analyzing the historical data in this graph. The forecaster could predict the future time series values. Now that I’ve covered the basic idea, I want to go through a practical example. I'm working on an app, that food truck owners can use to take orders and track sales. It would be really cool, if the app could forecast future sales too.
That could help owners prepare their trucks with the right amount of ingredients. Every time a customer makes a purchase, the app saves the transaction in tabular format. A few interesting columns are the date, the item, the quantity, and the price. For example, at 11:30AM one customer purchased 6 apple fritters for 12$. My goal is to predict the number of sales per day, so I’ll need to preprocess the data. The tabular data framework makes this operation easy.
I’ll start by grouping my transactions by date, and then sum the quantity.
To learn more about the tabular data framework, make sure to check out the Tech Talk where we show you how to load, explore, and transform your data in Swift.
Alright, with my transactions grouped and quantity summed, I'm left with only two columns: Date and Quantity. Before I go much further, I’d like to talk about potential trends that are common in time series data. Let’s compare the sales from two food trucks, one sells donuts while the other sells ice cream. Notice that the donut truck sales are increasing over time. Which can happen when the food truck gains popularity. Ice cream sales are trending up too, but not quite as fast.
Another important observation is that ice cream sales peak on weekends, whereas donut sales are more in demand throughout the week. Given that sales data is unique to each food truck. Let’s build the forecasting model on-device, right in the food truck app. That way the model is customized to a specific food truck's sales data and can make accurate predictions. Let’s continue. Take a closer look at the date column. The date has valuable temporal information, that the time-series forecaster model can harness in order to learn to make predictions.
Consider extracting date components to discover specific trends in the data. For example, by extracting the day of week, the model can learn from weekly variations in the data.
Extracting the month of year, can help the model learn annual variations. For example, ice cream sales are definitely higher in the summer months. We’ve introduced a DateFeatureExtractor component to make it easy to extract features from a date. Let me show you how to use it.
First, I’ll create a DateFeatureExtractor with month and weekday feature components.
Next, I’ll compose a ColumnSelector and featureExtractor together into a pipeline.
And then I'll add a ColumnConcatenator component, to combine all the features into a shaped array.
Now I can use my pre-processing pipeline to fit my data frame.
Which gives me a preprocessor that I can use to go from, the original dataset to the final one I need for training. Finally, I'll extract the features column and the quantity column, both as columns of MLShapedArray.
With that, I’m done preparing my data. Now, I’d like to talk about how to train the forecaster model.
I'll split the training data into two parts. A Training part and a Validation part.
The next decision I need to make is how many days in the future to predict. In order to forecast multiple days in the future, I need to consider multiple days of historical data. In general, your context should be longer than your prediction window. In this case, I want to forecast sales 3 days in the future, so I’ll provide the last 15 days of historical context. I’ll create my time series forecaster and configure the inputWindowSize, and forecastWindowSize. And train using the fitted method.
Once training completes, I’m ready to make some predictions.
I’ll use the applied method to forecast 3 days of sales.
This looks great in my app. At the end of each day, food trucks can forecast sales and make sure that they have the ingredients to serve up some delicious donuts. And that’s a wrap, make sure to explore your data with data source preview the next time you build an image-based model. I really can’t wait for you to create amazing object tracking experiences, in your visionOS apps. And while you’re at it, customize time series forecaster models with Create ML Components. It’s time for you to customize machine learning models with Create ML.
I’m excited to see what you build with Create ML.
-
-
特定のトピックをお探しの場合は、上にトピックを入力すると、関連するトピックにすばやく移動できます。
クエリの送信中にエラーが発生しました。インターネット接続を確認して、もう一度お試しください。