-
プロファイリング、修正、検証:Instrumentsによるアプリの応答性の向上
明確なワークフローで、アプリの応答性に関する問題を解消しましょう。Swift Concurrency Instrument、Time Profiler、System Traceは、ボトルネックの特定に役立ちます。このセッションでは、主要な関数を使って比較を行い、改善の成果測定や修正の確認を行う方法を説明します。また、上記の改善のサイクルの各イテレーションをさらに短縮し、よりスムーズなユーザー体験を短時間で提供できるようにする、Instrumentsのその他の機能強化についても紹介します。
関連する章
- 0:00 - はじめに
- 1:12 - 診断フロー
- 7:06 - サンプリングデータの可視化
- 16:01 - 実行の競合
- 20:29 - システムのブロッキング
- 26:07 - 次のステップ
リソース
関連ビデオ
WWDC26
WWDC25
WWDC23
WWDC22
-
このビデオを検索
こんにちは、Artです。Xcodeを担当しています。 InstrumentsチームのHarjasです。 滑らかなユーザーインターフェイスを提供することは 優れたアプリの基本です。 しかし、その裏では 多くの処理が行われています。 ソフトウェアスタックの各レイヤを 把握するのは複雑です。 Instruments 27を使えば これまで以上に簡単に アプリを速く レスポンシブに保つ方法を理解できます。 まず、アプリの基盤から始めましょう。 Swiftで書いたコードは 高速で表現力があります。 しかし、このコードは 単独で実行されるわけではありません。 シンプルなコードの裏にも 多くの複雑さが隠れています。 コンパイラとランタイムは ダイナミックディスパッチ、安全性チェック、 そして参照カウントを 裏で注入します。 さらに、メモリの割り当てには オペレーティングシステムに依存します。 プロセスのスケジューリングや I/Oのルーティングも同様です。
その後、OSは処理を 基盤となるプラットフォームに委譲します。 最終的にこれが実行を 物理ハードウェアへ直接ルーティングします。 なお、ここでいくつかの 一般的なコンポーネントを挙げましたが、 実際に関与する要素は これにとどまりません。 コンパイラとシステムの機能は 他にも多数あります。
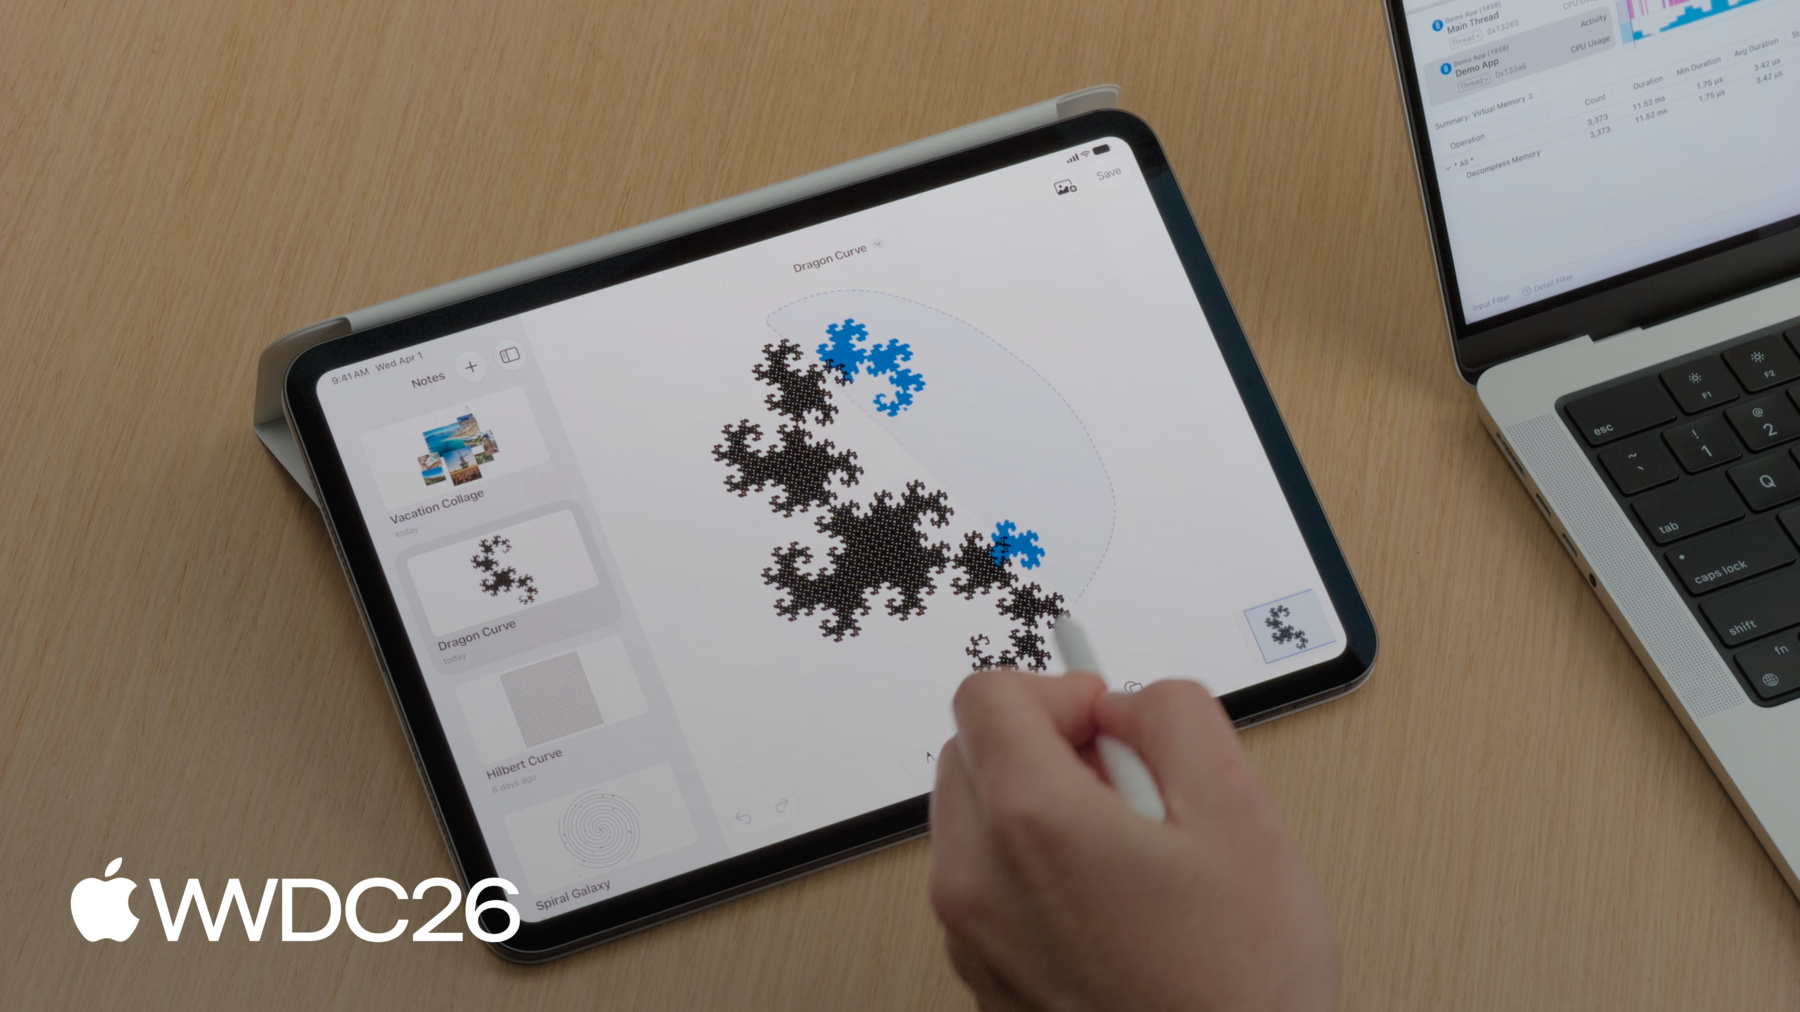
パフォーマンスの問題をトリアージするために メンタルモデルをご紹介します。 アプリのレスポンシブネスを 理解して最適化するためのものです。 まず、CPUの飽和状態について見ていき、 システム使用率が高い期間を 調査する方法をご紹介します。 次に、サンプリングデータの 可視化について説明し、 プロファイリングデータの 解釈方法を探ります。 続いて、実行の競合について見ていき、 タスクがリソース不足に陥ったとき 何が起こるかを調べます。 最後に、システムブロッキングを分析し、 アプリケーションが処理を停止する 根本的な原因を明らかにします。 その前に、診断フローを 確認しておきましょう。 アプリケーションがフレーム落ちした場合や ハングした場合、 最初のステップはTime Profilerです。 状況を把握するために必要な ハイレベルの概要を提供します。 そこで問われるのは、 ハング中にCPUが何をしているか、です。 CPU使用率が高い場合、スレッドがビジー状態で 処理に時間がかかりすぎています。 これはコードの パフォーマンスボトルネックを示します。 メインスレッドでパフォーマンスの問題が 発生した場合、 解決方法は2つあります。 1つ目はコードの最適化です。 アルゴリズムをリファクタリングして 実行を速くします。 しかし、重い処理が避けられない場合は、 バックグラウンドタスクに 処理をオフロードすることで解決します。 ユーザーインターフェイスの レスポンシブネスを保つためです。 アプリがハングしてもプロセッサが アイドル状態の場合、 アルゴリズムの最適化は役立ちません。 これは通常、メインスレッドが リソースの解放を待っている 状態を示します。 このブロックはさまざまな種類がありますが、 よくある例として、 File I/Oの待機、 同期ロックの待機、 プロセス間通信(IPC)の 待機が挙げられます。 Time ProfilerはアクティブなCPUサイクルしか 監視しないため、 これらのイベントは 可視化されません。 このワークフローをデモするために メモアプリを使います。 プロトタイプとして作成したものです。 このアプリでは描画ができ、
画像を追加したり、
なげなわツールで 要素を移動したりできます。 ただし、テスト中に 3つの問題が見つかりました。 プロファイルをキャプチャして 問題を特定しましょう。 まずXcodeから始めます。 プロファイリングを開始するには メニューを開き、を選択します。
アプリケーションの リリースビルドが作成されます。 デバッグビルドはデバッグのしやすさのために 実行時パフォーマンスを犠牲にするため、 デバッグビルドのプロファイリングデータは 誤解を招くことがあります。 最も実用的なデータを得るには リリースビルドのプロファイリングが不可欠です。 コードベースではSwift Concurrencyを 使用しているため、 ピッカーからSwift Concurrencyの テンプレートを選択します。
このテンプレート内でも Time Profilerにアクセスできます。
記録を開始して、 iPadに切り替え ワークフローを記録します。 テスト中にパフォーマンスの問題が 見られたワークフローです。 メモを保存すると ペンシルがすぐに反応しません。
メモをスクロールすると UIが滑らかではありません。
なげなわツールを使うと ハングが発生します。
左上隅で 記録を停止します。
3つのハングに関する全情報を含む トレースが取得できました。
Harjas、トレースの準備ができました。 AirDropでファイルを送るので 調査を始めましょう。 ありがとう、Art。 Instruments 27ではデータの読み取りと 解釈が簡単になりました。 上部のタイムラインには 水平方向のトラックが表示され、 タスク、アクター、 エグゼキュータが確認できます。 これらのトラックはリソース使用状況と 時間経過に伴うイベントの概要を示します。 タイムラインの下は詳細エリアです。 この詳細ビューはタイムラインで選択した トラックに基づいており、 各トラックには固有の 詳細情報が表示されます。 中央バーのポップアップボタンで 選択を変えることで、 表示を切り替えられます。 右側には新しい Inspectorパネルがあります。 タイムラインまたは詳細ビューでの 選択に基づいた 追加の詳細とアクションが 表示されます。 まず、なげなわツールが ペンシルに追いつかなかった 原因を調べましょう。 調査を容易にするため OSSignpostというツールを使います。 OSLogとOSSignpostは ログとトレースを有効にするAPIを提供します。 今回はなげなわ選択の周囲に os.signpostインターバルを追加しました。 OSSignposterタイプを使い、 インターバルのトレース開始と停止を行う APIを利用して実現しました。 このsignposterを作成する際、 subsystemを"Demo App"に設定して 自分のアプリに関連することを明示しました。 そして、categoryを points of interestに設定することで、 Instrumentsが自動的にこのデータを points of interestトラックに 表示するようになります。 これで、タイムライン上で なげなわ選択インターバルを確認できます。
インターバルのコンテキストメニューを使って トレースをこの時間帯にフィルタリングします。
Hangsインストゥルメントによると なげなわ選択中に複数のハングが発生しており、 Artが体験していた内容と 一致しています。 先ほどArtが言ったように、 このハング中のメインスレッドの CPU使用率を確認します。 プロセストラックを展開すると このプロセスの全スレッドが 表示されます。 メインスレッドのCPU使用率が 高い状態を示しており、 この時間帯はほぼ100%で 推移しています。 コードが実行されているが 処理に時間がかかりすぎています。 Time Profilerを使って 調査すべきでしょう。
Art、Instrumentsでサンプリングデータを 可視化する方法を 説明していただけますか。 もちろんです。 アプリケーションの実行中、 CPUは毎秒数千ものサンプルを 生成しています。 Instrumentsはそのスケールに対応し、 さまざまなパフォーマンス分析カテゴリの 可視化を提供します。 Time Profilerが生の実行データを コールツリーに変換する方法を説明します。
ハードウェアタイマーを使って 一定間隔でアプリの実行状態をサンプリングします。 定期的な間隔でサンプリングします。 デフォルトのサンプリングレートは 1ミリ秒です。
タイマーが発火すると、全コアの 現在のコールスタックが記録されます。 最初のサンプルでは、 mainがsaveNoteを呼び出しています。 コールツリーでは、これらの各関数に ウェイト1が付与されます。 saveNoteはスタックの一番下で 実際に実行されている関数なので、 セルフウェイト1が付与されます。
1ミリ秒後、 2番目のサンプルが発火します。 今度はmainがrenderCanvasを呼び出し、 さらにdrawStroke関数を 呼び出しています。 それらのウェイトも ツリーに追加されます。
3番目のサンプルでは drawStrokeが終了しているので、 mainとrenderCanvasを サンプリングします。 mainのトータルウェイトは3になり、 renderCanvasのウェイトは 2になります。
高速なswift_retainの呼び出しに注目してください。 サンプル間で完全に開始・終了するため 記録されませんが、 呼び出し頻度が高いほど サンプリングされる可能性が高いことを 覚えておくことが重要です。
このコールツリーが 調査を進める基礎データです。 ただし、一目で読み解くのは 難しい場合があります。 このデータをより直感的に理解するために、 Instrumentsはフレームグラフとして 視覚的に描画できます。 フレームグラフは、ツリー全体の構造を 空間的なブロックにマッピングします。 ウェイト3のmainが 最上位を形成します。 mainが呼び出したrenderCanvasと saveNoteは、 ウェイトに比例して 下方向に展開されます。 drawStrokeノードは 最下部に配置されます。
この可視化では、縦軸が コールスタックを表し、 呼び出し元が上、呼び出し先が 下に向かって伸びます。 横軸はCPUの総時間を 表しますが、 時系列ではなく 集計ビューになっています。 バーが広いほど、その関数が 多くのサンプルに出現しており、 コストの高いコードパスを 一目で発見できます。
ただし、Swiftランタイム関数や 各種ヘルパーユーティリティなど、 多くの場所から呼び出される コードの場合、 フレームグラフの構造的なビューでは トータルコストが分散されます。 実行時間が、それらを呼び出す 異なるブランチに 細かく分割されてしまいます。 この分散により、どの関数が 最も多くのサイクルを 消費しているかを 答えにくくなります。 その答えを得るために、 Instrumentsは新しい分析モード Top Functionsを導入します。 この新モードはコール階層を廃棄します。 代わりに、散在するすべてのノードを 抽出して マージし、1つのブロックを 形成します。
これはセルフメトリクスを使って評価され、 特定の関数内で直接 命令を実行するのに費やした時間を 計算します。 Harjas、データを見る準備ができました。 どうぞ。 ありがとう、Art。 Instrumentsでプロファイルを確認する際、 デフォルトビューは アウトライン形式のコールツリーです。 サンプル数を確認するのに 適しています。 しかしArtが述べたように、フレームグラフは スキャンしやすく、 問題を視覚的に発見しやすいです。 コールツリー上部のバーに表示される セグメントコントロールを使って、 詳細ビューをフレームグラフ表示に 切り替えられます。 素早くスキャンすると、時間は キャンバスのレンダリングコード内の さまざまなコードパスに 分散していることがわかります。 単一の明確な問題は 見当たりません。 むしろ、これらの異なるコードパスが 合計すると ハングを引き起こすほどの コストになっています。 Instrumentsの新機能 Top Functionsモードを試してみます。 コールツリーや フレームグラフでは見つけにくいものが 見つかるかもしれません。 先ほど使ったコントロールと 同じ場所にあります。
左側にはセルフウェイト順にソートされた Top Functionsのリストが表示されます。 右側には、選択した関数を 呼び出したすべてのコードパスの フレームグラフが表示されます。 なげなわ選択中のTop Functionは swift_project_boxed_opaque_existentialです。
このランタイム関数はexistentialを アンラップする役割を担い、 コードが操作できるように します。 Xcodeのコーディングアシスタントに 描画コードを書き直してもらい、 existentialの代わりに 具体的な型とジェネリクスを使うよう依頼します。
処理が実行されている間に existentialとは何か、 なぜコーディングアシスタントに この変更を依頼したかを説明します。 Swiftでは、変数に プロトコルに準拠する任意の型を 保持させたい場合があります。 コンパイル時に 具体的な型を知らなくても済むようにするためです。 これを実現する1つの方法は プロトコル名の前にanyキーワードを使うことで、 これをexistentialと呼びます。 取り得る型はサイズが さまざまであるため、 existentialでは基礎となる値に アクセスするために 追加の処理が必要になる場合があります。 これは今回のユースケースでは コストが高すぎることがわかりました。 existentialに代わる選択肢は いくつかあります。 パフォーマンスが最優先の場合に使えるもので、 具体的な型、 ジェネリクス、 場合によってはenumが挙げられます。 これらのアプローチはコンパイラに より多くの情報を与え、 より優れた最適化を 可能にします。 Swiftのジェネリクスについて 詳しく知るには、 WWDC22の"Embrace Swift generics"を ご覧ください。 アシスタントの状況を確認しましょう。
コーディングアシスタントが 変更を完了したようです。 更新されたトレースをArtに 送ります。 ありがとう、Harjas。 修正を検証するために、 別々のウィンドウで並べて開いて Top Functionsデータを 比較することもできます。 しかし、Instrumentsでは プロファイリングデータを1つのドキュメント内で 複数の実行間で 直接比較できるようになりました。 変更の確認作業を 効率化するためです。
Instrumentsの新機能 Run Comparisonsをご紹介します。 ベースライントレースと最適化トレースの 全サンプルを 相互参照することで 正確なパフォーマンスの差分を算出します。 スタック内のすべてのノードを 評価します。 そのために、 Instrumentsはベースライン実行の 旧バージョンの関数と 最適化された実行の 新バージョンを直接照合します。
照合後、差分を算出し、 パフォーマンスの差異に基づいて ソートします。 赤いブロックは パフォーマンスの低下を示します。 緑のブロックはパフォーマンスの向上、 つまり実行時間の改善を示します。 試してみましょう。 ノイズのない正確な比較のために、 まず両方の実行を なげなわ選択の同じos_signpostインターバルに フィルタリングします。
次に、メインスレッドの サンプリングデータを比較するために、 メインスレッドトラックを 選択します。
中央バーの比較ボタンをクリックすると、 ドロップダウンメニューから ベースライン実行を選択できます。
サイドバーに 比較タブが追加されます。 複数の比較を作成でき、 コラボレーションを容易にするために ドキュメントに保存されます。 比較ツリーはテキスト形式の コールツリーとして表示できます。
全体の実行時間が なげなわ選択で 短縮されたことがわかります。
フレームグラフに切り替えると、 改善されたコードパスが緑で、 低下したコードパスが赤で 表示されます。 コーディングアシスタントがジェネリクスを採用した際に 新しい関数が追加されましたが、 Run Comparisonsでは これらが低下として表示されます。 Top Functionsビューでは 最も改善したものと 最も低下したものを 確認できます。 デフォルトでは、Run Comparisonsの 低下が上位に表示されます。 これらの低下は、existentialの使用を 排除するために コーディングアシスタントが 追加した新しい関数です。
ソート順を逆にして 改善点を確認できます。
ここでは、 swift_project_boxed_opaque_existentialの 呼び出しが 完全に削除されました。 全体的に、改善点が 低下を上回っています。 これにより、具体的な型と ジェネリクスの採用によって この特定のランタイムオーバーヘッドが 正常に排除されたことが確認できました。 CPUワークの最適化について 詳しく知るには、 WWDC25の"Optimize CPU performance with Instruments"セッションをご覧ください。
Harjas、1つ解決、残り2つです。 そうですね。 描画コードの最適化が完了したので、 ベースライン実行に戻って アプリの他の側面を最適化し続けます。 調査が必要なハングが まだいくつか残っています。
残念ながら、これらにはpoints of interest トラックにログがなく、 その時点で何が起きていたかを 把握するのが難しい状況です。 別の方法として、 これらのハング中にMain Actorで 実行されているタスクを確認することができます。 Instruments 27には新しい Swiftエグゼキュータインストゥルメントがあります。
このインストゥルメントはMain Actor、 グローバル並行エグゼキュータ、 プロセス内のカスタムエグゼキュータを 可視化します。 これらのハングのそれぞれで、 Main ActorトラックにrenderThumbnailという Swiftタスクが対応して表示されます。 このトラックを選択すると、 Main Actorで実行中の全タスクの サマリーを取得できます。
Main Actorに複数の サムネイルレンダリングタスクがあり、 実行に数百ミリ秒かかっています。
これが、メモリストのスクロールが スムーズでなかった原因かもしれません。 診断フローに従って CPU使用率を確認しましょう。 いずれかのハングにトレースを フィルタリングします。
インスペクタを使って メインスレッドをピン留めします。
この期間、Time Profilerは メインスレッドのCPU使用率が 約100%であることを報告しています。 他のシステムリソースを 待っているのではなく、 これらのタスクがMain Actorで 実行するのに時間がかかりすぎています。 なぜこれが問題なのでしょうか。 まずMain Actorとは何かを 確認してから、 このハングをどう解決するかを 説明します。 Main Actorはすべての ユーザーインターフェイスの更新と インタラクションを担当します。 アプリケーションはすべてのサムネイルを 非同期にレンダリングします。 しかし、このコードはSwiftUIから 呼び出されたため、 Main Actorのコンテキストを 継承しました。 これらのタスクはMain Actorを巡って 重要なUI更新と競合し、 アプリがスムーズな体験を 提供できなくなります。 これを解決するには、 サムネイルレンダリングを スレッドプールにルーティングする必要があります。 Main Actorが解放され、保留中の UIイベントをスムーズに実行できるようになります。
これがサムネイルを 生成するコードです。 @concurrent属性を タスクイニシャライザに追加することで リファクタリングできます。 これによりサムネイルレンダリングタスクが Main Actorから移動し、 グローバルエグゼキュータに 移されます。 Swiftコンパイラはこのコード変更が 競合状態を引き起こさないか チェックします。 更新されたトレースでは、 Swiftエグゼキュータインストゥルメントが サムネイルレンダリングタスクが 移動したことを示しています。 Main Actorトラックから グローバルエグゼキュータのトラックへ移動しました。 グローバル並行エグゼキュータに移すことで UIのハングを防ぐだけでなく、 UIのハングを 防ぐだけでなく、 これらのサムネイルを並列で レンダリングできるようになりました。
Swift Concurrencyの使い方について 詳しく知るには、 WWDC25の"Embracing Swift Concurrency"を ご覧ください。 Art、残りハングは1つです。 仕上げましょう。
並行処理の競合が 解決されたので、 最後のハングのために ベースライン実行に戻ります。 保存を実行すると、ユーザーインターフェイスが 一時的にハングします。 points of interestトラックの Write to Fileインターバルを使って このハングを見つけます。
インスペクタの範囲を設定し、 コンテキストメニューの適切なオプションを クリックしてズームインします。
このステップ中にマイクロハングが 報告されています。 CPU使用率を確認しましょう。
この場合、約20%と かなり低い値です。
診断はCPU使用率が低いことを 示しています。 この状況でインターフェイスが フリーズする場合、 メインスレッドがシステムリソースを 待ってブロックされています。 なぜそれが起きるかを正確に理解するために、 スレッドが状態間を どのように遷移するかを見ていきます。
低いCPU使用率は誤解を招くことがあります。 コードの実行が遅いわけではなく、 スレッドが実行を 停止していることを意味します。 System Traceテンプレートは オペレーティングシステムが アプリケーションをいつ、なぜ 一時停止するかを正確に可視化します。 ここでは、メインスレッドがCPUコアで アクティブに実行されています。 オペレーティングシステムは代わりに処理を実行し ハードウェアを制御するための 多くのシステムコールを提供します。 しかし、リソースがすぐに 利用できない場合、 スレッドはブロック状態に 入ります。 これが発生すると、カーネルは スレッドをプロセッサから排除します。 リソースが利用可能になると スレッドは実行可能状態になり、 コアに戻ります。 より具体的には、ハードウェアが 最終的に処理を完了しても、 スレッドはすぐに 実行を開始しません。 まず実行可能状態に入ります。 リソースの準備が整った状態ですが、 スレッドはOSスケジューラが 空きCPUコアを 割り当てるのを待つ必要があります。
ズームアウトします。 ここでハイライトされている ブロック状態に注目してください。 大部分の時間は 外部依存関係が解決されるのを待って ブロックされています。 解決されると、スレッドは短時間 起動して リクエストの次のステージを 調整します。 これらの短い実行の瞬間が まさに CPU使用率20%の 原因です。
このフェーズ中、スレッドは 完全にアイドル状態です。 このような単一のシステムコールは 複数の基礎となる依存関係に 依存することが多く、 OSがそれらすべてを解決するまで メインスレッドを待機させます。 最終的にコアに戻り 処理を完了します。 アルゴリズムの最適化は ここでは効果がありません。 最適化すべきコードが 実行されていないためです。 Write to Fileインターバルで何が起きているかを 一緒に確認しましょう。
System Traceテンプレートを使った このハングのプロファイルです。 System Traceを使うと スレッドが何をしていたかを正確に確認でき、 システムコールなどの 主要なOS概念も含みます。 インスペクタを使ってメインスレッドをピン留めして ズームインします。
ファイルの保存中に アクティビティレーンに大量の 空白スペースが表示されます。 これはスレッドがブロックされていた ことを示し、 UIの更新を妨げていました。 紫色のインターバルは システムコールが実行中であることを示します。 しかし、システムコールがアクティブであっても、 スレッドが実際にアプリケーションコードを 実行しているとは限りません。 これらのインターバルの 1つを選択します。
選択すると、 クリックしたセグメント以外も ハイライトされます。 これは1つの連続した writeシステムコールを可視化しており、 コア上とコア外の両方の時間に またがっています。 不透明なセグメントはコア上で アクティブに実行中の時間を表し、 半透明なセグメントはコア外で ブロックされていた期間を表します。 なぜこんなに長くブロックされていたかを 理解するために、 Inspectorを確認します。 Inspectorにはこのシステムコールに 渡された正確な引数が表示されます。 ターゲットファイルディスクリプタ、 バッファのメモリアドレス、
そして最も重要なのはサイズです。
メインスレッドで1.7ギガバイト以上の データを書き込もうとしています。 パフォーマンスコストも確認できます。 この単一の操作に 500ミリ秒以上かかっており、 そのうち約300ミリ秒は ディスクを待つためにコア外で費やされました。 ファイル書き込みがメインスレッドで 同期的に開始されたため、 ストレージが応答するまで アプリケーションがフリーズします。 これを修正するために、file I/Oを バックグラウンドに移すようコードをリファクタリングします。 このワークフローを担当している コードスニペットです。 PropertyListEncoderクラスを使って データをシリアライズしており、 ボトルネックはこの行に あります。 data.writeメソッドを 同期的に呼び出しています。 このアトミックな書き込みが メインスレッドで直接実行されるため、 これが先ほどのブロックの 原因です。 このコードをSwiftタスクで ラップします。 これにより、エンコードと ファイル書き込みを 並行スレッドプールにプッシュし、 Main Actorのブロックを 解除します。 別のプロファイルで確認します。 ファイル保存中にメインスレッドが ブロックされなくなったことを確認します。 Writing to File シグポストインターバルを使って すでにナビゲートしています。 メインスレッドには writeシステムコールが 表示されなくなりました。
同じシステムコールが バックグラウンドスレッドで見つかります。
Apple Pencilの操作が スムーズになりました。 アプリを開いて成果を確認しましょう。 file I/Oが適切にルーティングされたことで、 ドキュメントの保存が バックグラウンドで行われるようになり、 アプリケーションを操作できる 状態が維持されます。
CPUの飽和状態も最適化したため、 リソースの競合も解決したことで、 なげなわツールとメモのスクロールも レスポンシブなままです。
データに従うことで、 ベースライン実行から3種類のハングを すべて排除できました。 一貫してレスポンシブなアプリを 作るには、 プロファイリングツールを 特定のパフォーマンス症状に 合わせる必要があります。 CPUが過負荷の場合は、 Top Functionsで散在するソフトウェアオーバーヘッドを 特定し、 Run Comparisonで 改善を検証します。 タスクがリソースを競合する場合は Swiftコンカレンシーインストゥルメントを使って アクターの混雑を 特定します。
スレッドがアイドル状態の場合は、 System TraceとInspectorパネルを 活用して file I/Oのような同期ブロッキング動作を 明らかにします。
これらのワークフローを 自分のコードベースに適用する際は、 プロファイリングの精度を 確保してください。 常にリリースビルドで プロファイリングします。 os_signpostを活用して Run Comparisonsのインターバルが 信頼できるものになるよう確認します。 これらのトピックをさらに深く探るには、 ぜひ確認することをお勧めします。 WWDC 2023の"Analyze hangs with Instruments"セッションをご覧ください。 Instrumentsを使えば どこを見ればよいか迷わずに済みます。 頻繁にプロファイリングを行い、 データにストーリーを語らせましょう。 ご視聴ありがとうございました。
-
-
5:41 - Add signpost interval around Lasso Selection
// Add signpost interval around Lasso Selection import os.signpost let signposter = OSSignposter(subsystem: “Demo App", category: .pointsOfInterest) var lassoIntervalState: OSSignpostIntervalState? = nil func lassoSelectionUpdated() { lassoIntervalState = signposter.beginInterval("Lasso Selection") // Update selection in canvas… } func lassoSelectionEnded() { // Finalize lasso selection... signposter.endInterval("Lasso Selection", lassoIntervalState!) } -
12:11 - Existentials
// Existentials protocol Foo { } struct TypeA: Foo { } struct TypeB: Foo { } func bar(_ foo: any Foo) { } -
12:39 - Concrete Types
// Concrete types protocol Foo { } struct TypeA: Foo { } struct TypeB: Foo { } func bar(_ a: TypeA) { } func bar(_ b: TypeB) { } -
12:46 - Concrete Types + Generics
// Concrete types protocol Foo { } struct TypeA: Foo { } struct TypeB: Foo { } func bar(_ a: TypeA) { } func bar(_ b: TypeB) { } // Generics protocol Foo { } struct TypeA: Foo { } struct TypeB: Foo { } func bar<T: Foo>(_ generic: T) { } -
12:49 - Concrete Types + Generics + Enums
// Concrete types protocol Foo { } struct TypeA: Foo { } struct TypeB: Foo { } func bar(_ a: TypeA) { } func bar(_ b: TypeB) { } // Generics protocol Foo { } struct TypeA: Foo { } struct TypeB: Foo { } func bar<T: Foo>(_ generic: T) { } // Enums enum Foo { case a(TypeA) case b(TypeB) } struct TypeA { } struct TypeB { } func bar(_ enum: Foo) { } -
18:24 - Thumbnail Rendering
// Thumbnail rendering let drawingData = note.drawingData let canvasImages = note.decodeCanvas() thumbnail = await Task(name: "Render Thumbnail") { await renderThumbnail(drawingData: drawingData, canvasImages: canvasImages, size: CGSize(width: 300, height: 240)) }.value -
18:29 - Thumbnail Rendering Off Main Actor
// Thumbnail rendering off Main Actor let drawingData = note.drawingData let canvasImages = note.decodeCanvas() thumbnail = await Task(name: "Render Thumbnail") { @concurrent in await renderThumbnail(drawingData: drawingData, canvasImages: canvasImages, size: CGSize(width: 300, height: 240)) }.value -
24:12 - File Saving
// File saving let encoder = PropertyListEncoder() encoder.outputFormat = .binary guard let data = try? encoder.encode(snapshots) else { return } let id = signposter.beginInterval("Writing To File") try? data.write(to: fileURL, options: .atomic) signposter.endInterval("Writing To File", id) -
24:25 - File Saving off Main thread
// File saving

Task { @concurrent in
	let encoder = PropertyListEncoder()
	encoder.outputFormat = .binary
	guard let data = try? encoder.encode(snapshots) else { return }
	let id = signposter.beginInterval("Writing To File")
	try? data.write(to: fileURL, options: .atomic)
	signposter.endInterval("Writing To File", id)
}
-