-
Metalゲームのパフォーマンス問題の検出と修正
パワフルなMetalツールを使うと、検出が困難なゲームのパフォーマンス問題をトラッキングできます。InstrumentsのGame Performance Overviewを使って詳細なパフォーマンスデータを収集する方法、metalperftrace(macOSの場合)またはコントロールセンター(iOSの場合)でバックグラウンドトレースを実行する方法、新しいStateReporting APIでメトリックスをゲームの実行状態に直接関連付ける方法を紹介します。何時間にもわたり収集されたテレメトリを、対策につながる明確なインサイトに変換することができます。
関連する章
- 0:00 - はじめに
- 1:51 - Metalのパフォーマンスメトリックス
- 3:32 - トレースの収集
- 6:38 - パフォーマンストレースの分析
- 10:08 - StateReportingによる文脈付け
- 17:48 - MetricKitでフィールドデータを収集
- 19:41 - 次のステップ
リソース
- Understanding the Metal Performance HUD metrics
- Monitoring your Metal app’s graphics performance
- Getting started with StateReporting
- Metal debugger
関連ビデオ
Tech Talks
-
このビデオを検索
こんにちは、ようこそ。 私はRuiwei、Metal Toolsチームの エンジニアです。 スムーズで一貫したフレームレートは プレイヤーに届けられる中で 最も重要なものの一つです。 それはゲームをレスポンシブで 洗練されたものにし プレイセッション全体を通じて そのスムーズさを維持することが鍵です。 必要なすべてを提供する 新しいツールとワークフローをご紹介します 長いゲームセッションの問題を 迅速に収集・特定するための。 優れたスムーズなゲーム体験を実現するには サイクルが必要です。 多くの異なるデバイスや フォームファクターでゲームをプレイテストし、 パフォーマンスデータを収集して 結果を分析し、 パフォーマンスの問題を特定して 修正します。 その後、再びプレイテストして サイクルを繰り返します パフォーマンス目標を達成するまで。 プレイヤーが何時間もゲームをプレイする中で、 多くの状況が変化する可能性があります。 デバイスが加熱し、 サーマル状態が変化します。 プレイヤーがグラフィックス設定を調整します。 異なるレベルや 戦闘の間を移動します。 真にスムーズな体験を実現するには、 複数のシナリオにわたって 長期間にわたって 測定する必要があります。 その方法をお見せするために、 まず簡単な紹介から始めます 利用可能な Metalパフォーマンスメトリクスです。 次に、収集するための 新しいツールとワークフローをご紹介します 長期間にわたる トレースを分析するための。 次に、トレースをコンテキスト化する 方法を示します 任意の時点での ゲームの状態を理解できるように。 そして最後に、ゲームリリース後に フィールドでデータを収集する方法を。 Metalパフォーマンスメトリクスから 始めましょう。
Metal toolsは 幅広い種類のメトリクスを提供します。 これらのメトリクスは、異なるセッション間で 比較するためのベースラインを提供し、 潜在的な問題を特定します。 例えば、フレーム毎秒などの タイミング関連のメトリクス、 GPU時間、Frame Intervalは フレームのペーシングを示します GPUの使用率とともに。 一方、Layer sizes、Composition mode、 MetalFX関連のメトリクスなどは 確認に役立ちます ディスプレイ関連の設定が 正しく設定されているかどうかを。 これらすべてのメトリクスを 一目で確認できる場所があります。
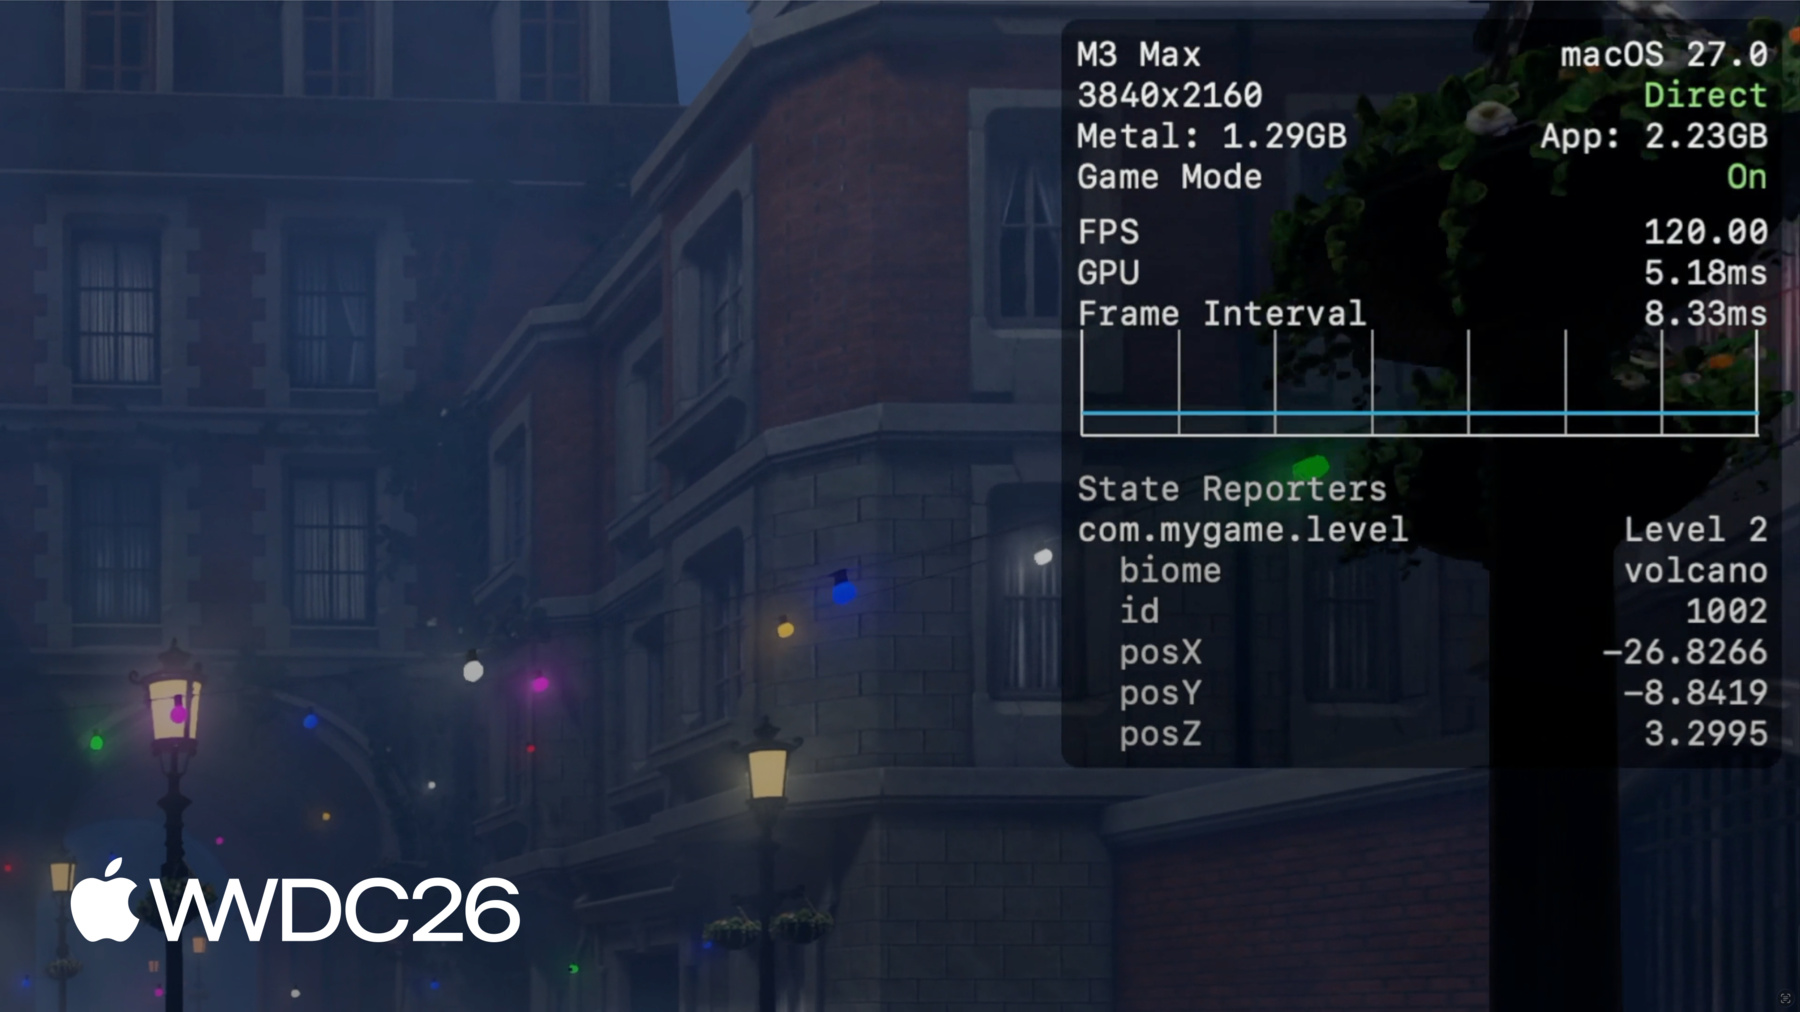
Metal Performance HUDは FPSなどのパフォーマンスメトリクスを表示します、 メモリ使用量、Frame Intervalを ゲームコンテンツの上にオーバーレイして。 プレイしながらゲームの パフォーマンスを大まかに把握でき、 多くのカスタマイズ機能も 備えています。 例えば、設定パネルでは 表示するメトリクスの リストをカスタマイズできます。 個々のメトリクスを 有効または無効にしたり、 プリセットから選択したりできます。 各メトリクスについて詳しくは Metal toolsドキュメントの HUDを参照してください。 「Metal appのグラフィックスパフォーマンスを監視する」 と「Metal Performance HUDメトリクスを理解する」。 HUDは開発中の 迅速な確認には最適ですが、 長時間にわたってメトリクスを 保存する機能はありません。 フレームドロップが発生した場所を 正確に覚えておくのは難しく 特に数分から数時間 プレイする場合となると。
その詳細を得るには、 長期間にわたって パフォーマンストレースを収集する必要があります。 デスクでゲームをテストする場合は、 Instruments内の Game Performance Overviewテンプレートを使用できます。
まず、Instrumentsのテンプレートセレクターで Game Performance Overviewテンプレートを選択します Instrumentsテンプレートセレクターで。 集約されたMetalパフォーマンスメトリクスと Time Profiler CPUサンプルを キャプチャします。 Instrumentsを使用してゲームを起動するか、 接続されたデバイスで既に実行中の ゲームセッションにアタッチできます。 準備ができたら、 レコードボタンをクリックするだけです。 これはデスクでのテスト中の データ収集に最適です— 数分以上続くセッション。 しかし、非常に強力な機能があります。 ゲームの実行中、システムは 常に記録し続けています Metalパフォーマンスと リソース使用量メトリクスを保存しながら。 集約されたオプションのフレームごとのメトリクス、 CPU、GPU、FPS、Memory などは 効率的に保存され、 何日間も保持されます。 つまり、何時間も続く 長いゲームセッションでも、 複数の状態変化を含む場合でも、 ゲームセッション終了後に 過去に遡ってデータを収集できます macOSとiOSデバイスの 両方でローカルにです。 その仕組みを示します。 macOSでは、metalperftrace経由で データを収集できます、 macOS 27の 新しいコマンドラインツール。 追加設定は不要です。 単に metalperftrace collect を 実行するだけで --last で取得したい期間を渡します、 数時間から数日間まで。 例えば、このコマンドはトレースを収集します 過去5時間の パフォーマンスメトリクスを含む。 あるいは、明示的な開始日と終了日を 渡すことができます 特定の時間範囲の トレースを収集するために。
これがmacOSで 過去に遡ってトレースを収集する方法です。 iOSでのルックバック収集は デバイスの一回限りのセットアップが必要です。 開発者モードを有効にした状態で、 開発者設定に移動し、 Performance Traceを有効にします。 Lookback Collectionを選択し、 トレースがカバーする過去の時間を選択します。
最後のステップとして、コントロールセンターに移動し、 Performance Traceボタンを追加します。
これでデバイスは トレース収集の準備ができました。 通常通りゲームの プレイテストを開始できます。 終了後、 コントロールセンターを開きます。 Performance Traceボタンをタップすると、 デバイスは収集を開始します 設定された時間の トレースを処理します。
これには少し時間がかかる場合があり、 処理が完了すると 通知を受け取ります。 収集されたトレースは Available Trace Filesリストに表示されます。 そこから簡単にトレースを Macに転送してさらなる分析ができます。
トレースの収集方法を 示しました Instrumentsを使用した方法と iOSとmacOSデバイスでの方法の両方で。 次のステップは それらを分析することです。 macOSでは、metalperftrace経由で メトリクスの概要を印刷またはエクスポートできます metalperftrace経由で。 またはInstrumentsでトレースを開いて データを視覚的に探索できます。 両方を実際に確認しましょう。 記録されたトレースの 全体的なパフォーマンスを確認するには、 トレースファイルで metalperftrace overview を実行するだけです。 metalperftrace は集約して 全体的なパフォーマンスデータを印刷します トレースに含まれる ゲームセッションのです。 レポートは各プロセスに対して 2つのセクションに分かれています。 最初のセクションには リソース使用量の統計が含まれます、 メモリ使用量、CPU時間、 ディスクアクティビティなど。 2番目のセクションには 各レイヤーのMetalパフォーマンスメトリクスが含まれます。 例えば、 このセッション中、 平均メモリ使用量は約2.1GBです。 平均FPSは約60です。
レポートにはフレーム時間などの メトリクスの統計値も含まれます on-GPU時間などです。 これにより、セッションの全体的な パフォーマンスを素早く把握できます。 トレース内に複数のゲームセッションや Metal グラフィックスアプリがある場合、 オプションの述語を使用して 特定のプロセスのデータを印刷できます。
さらに、--json を渡すことで metalperftrace をJSON形式で出力することもできます。 これにより構造化された出力が得られ、 スクリプトに簡単に送り込めます リグレッションテストのための、 またはAIエージェントが自動的に 潜在的なパフォーマンス問題をトリアージするための。
Instrumentsはより深い分析のために トレースを開いて視覚化することもできます より詳細なメトリクスで。 データはタイムラインに プロットされ、 Instrumentsは自動的に 値を評価します 大きく逸脱した統計は 異なる色でハイライトされます。 例えば、このトレースでは FPSが一定期間低下しました 黄色でマークされています。 詳細ビューには統計値が表示されます: 最小値、最大値、平均値、 各メトリクスの標準偏差。 これらの統計は トレース全体に対して集約されます または選択した時間範囲に対して。 時間範囲を選択すると Instrumentsが自動的に集約し、 選択した期間の 統計を更新します。 ここでは平均FPSが その期間中26に低下し、 GPU使用率が 非常に低くなっています。
ここでさらに深く掘り下げて 問題を再現しようとする必要がありますが、 大きな課題があります。 フレームレートの低下が 約12分頃に発生したことはわかりますが、 その時点でゲームが 何をしていたかはわかりません。
このようなトレースを見ると 平均FPSだけでは さらなる調査に必要な 実用的なコンテキストが 不足しています。 特定のレベルエリアによる 低下だったのでしょうか? またはグラフィックス設定が 変更されたのでしょうか? だからこそ、コンテキストが重要です 潜在的なパフォーマンス問題を特定し トレースを分析する際に。 個々の問題を調査するには、 各瞬間にゲームが 何をしていたかを教えてくれる 細かい粒度のデータが必要です。
次に、トレースにコンテキストを追加するのに 役立つ新しいAPIを紹介します。 StateReportingは、ゲームの動作を 説明できる新しいAPIです 時間の経過とともに状態を。 4つのコアコンセプトに 基づいています。 すべてはドメインから始まります。 ドメインは有限のステートマシンです 特定の機能領域を 表します。 例えば、プレイヤーの進行状況を追跡する レベルドメインを定義できます。
各ドメインは一度に 一つの状態にあることができます。
各状態は「Level 1」などの ラベルから始まります。 オプションの安定した メタデータを含めることもできます。 これは、ラベルに加えて あらゆる種類のシリアル化可能な情報を含む 不変の辞書です、 現在の状態について。
各状態には揮発性メタデータも 含めることができます。 名前が示す通り、 状態内で変化する値に 使用します、
プレイヤーの体力など。 プレイヤーがゲームを進めるにつれて、 状態間を遷移できます 異なるラベルとメタデータで。 例えば、「Level 1」から 「Level 2」への遷移 プレイヤーが 次のレベルに進んだとき。 タイムラインに配置すると、 複数のドメインを定義して ゲームの特定領域の 状態を説明できます。
例えば、レベルの変化を追跡する レベルドメイン、 現在のグラフィックス設定を追跡する グラフィックスドメイン、 ネットワーク状態のための ネットワークドメイン。
前のFPSグラフに戻ると、 今ではトレースを コンテキスト化でき、 改善が必要な領域を 即座に見つけることができます、 最適化の取り組みに 集中できます。
StateReporting APIはSwiftと Objective-Cの両方で利用可能で、 採用が簡単です。
ゲームの現在のレベルを報告する サンプルコードをご紹介します。 まず、通常は逆DNSの文字列である ドメインを作成し、 ドメインのレポーターを要求します。 レポーターはステートマシンの インスタンスで 状態遷移を報告するために 使用できます。 状態を報告するには、ラベルと共に reportTransitionを使用します 現在の状態を説明するために。
オプションとして、状態に関する 追加の構造化情報を含めるには、 単に辞書を stableMetadata引数に渡します。 揮発性メタデータの場合、 別の状態に遷移せずに 値を更新できます reportVolatileMetadataUpdateを呼び出すことで、 情報を表す辞書と共に。
StateReportingは、これまで説明したすべての ツールと緊密に統合されています: Metal Performance HUD、 metalperftrace、そしてInstruments。
Metal Performance HUDでは、 状態ドメインのリストが メトリクス設定タブに表示されます。 有効にすると、オーバーレイにラベル、 安定したメタデータ、揮発性メタデータが表示されます。 これはStateReportingの採用状況を 確認する最も直接的な方法です。
例えば、バイオームとIDを 安定したメタデータとして使用し、 レベル状態を報告しています、 プレイヤーの位置を 揮発性メタデータとして。 揮発性のプレイヤー位置は 1秒に1回報告され、 オーバーレイでプレイヤーが 移動する際に 位置を確認できます。 metalpertrace では、 概要を印刷する際に 状態遷移を含むトレースの、 レポートにはドメインのリストが含まれます、 遷移の数と 最後に確認された状態。
状態遷移の詳細をすべて知るには、 単に --include-state-transitions を渡します。 これにより、開始と終了タイムスタンプ付きの 状態の完全なリストが印刷されます。
metalperftrace は、これらの状態の関数として メトリクスを 自動的に集約して 報告することもできます。
すべてのドメインと状態遷移に対して集約するよう metalperftrace に要求できます、 または特定のドメインのすべての 状態遷移に対して集約、 またはドメイン内の特定の 状態ラベルに対して集約。
例えば、グラフィックスがHighに設定されているときの 平均FPSを確認するには、 グラフィックスドメインの「High」状態ラベルを 集約するよう metalperftrace に要求するだけです。
レポートには詳細な状態情報、 アクティブだった期間、 他のドメインでオーバーラップしている 状態のリストが表示されます。 例えば、グラフィックスが Highに設定されているとき、 平均FPSは約24のみです。
時間の経過に伴う状態遷移を より視覚的に確認するには、 Instrumentsでトレースを開きます。
状態遷移を含む トレースを開くと、 Instrumentsは各ドメインの トラックを作成します Points of Interestインストゥルメントの 一部として。
各トラックは状態遷移と 揮発性の更新をグラフ化し、 コンテキストを簡単に 理解できます。
個々の状態を選択して、 サイドバーでその状態の 詳細を確認できます、 安定したメタデータや 揮発性メタデータなど。 Metalパフォーマンスメトリクスと 組み合わせることで、 グラフィックス設定がHighに変わると フレームレートが低下し始めることを 確認しました。 次はそこに焦点を当てて 調査を進めます。 問題を再現するのに十分な コンテキストが得られたら、 次のステップはゲームの特定のポイントを より深く調査することです。
詳細なCPUとGPUの スケジューリングデータをキャプチャするには InstrumentsのMetal system trace テンプレートを使用します。
XcodeのMetal debugger を使用して フレームをキャプチャしてプロファイルすることもできます。
これらのツールについて詳しくは、 「Metal Developer Tools」ドキュメントをご確認ください、 そして「Discover new Metal profiling tools for M3 and A17 Pro」。
StateReportingをゲームに採用する際に 念頭に置くべき いくつかのベストプラクティスがあります。 まず、インストゥルメントする前に ドメインと状態を慎重に設計します。 各ドメインは概念的に 他のドメインと直交している必要があります。 一つのドメインに あまりにも多くの次元を表現しようとしないでください 追跡が困難になります。 次に、状態遷移を 多くしすぎないようにします。 StateReportingは追加のコンテキストを 提供するよう設計されています 長期間にわたる パフォーマンス分析のために。 高頻度の状態変化のために 設計されていません。 遷移をユーザーアクションのリズムか それより遅いペースに制限するようにします。 遷移レートが高すぎると システムがスロットルします、 レートが制御下に戻るまで 重要な情報を失うことになります。
そして最後に、 状態の正確さを確認します Metal Performance HUDや Instrumentsなどのツールを使用して。 遷移が理にかなっており、 期待通りに発生していることを確認します。 データを誤らせ、理解困難にする エッジケースを見逃しやすいです。
振り返ると、収集、 分析、コンテキスト化の 全体像が見えました ゲームをリリースする前の 長いゲームセッションの パフォーマンスデータについて。
しかし、これらのツールは ローンチで終わりません。 ゲームがプレイヤーのデバイスに届いたら、 パフォーマンスを監視し続け、 予期せぬパフォーマンスの低下を 次に、ゲームリリース後にMetal パフォーマンスメトリクスを収集する方法をご説明します ゲームリリース後の。
MetricKit は2種類のデータを 提供するフレームワークです: メトリクスと診断情報。 ゲームにプロセス内で直接 電力とパフォーマンスデータへのアクセスを提供します レポートの形で。
プレイヤーがゲームをプレイすると、 MetricKitはバックグラウンドで 継続的にデータを収集し、 毎日のレポートを ゲームに届けます。 レポートにはゲームのスムーズさを 測定するメトリクスが含まれます、 デバイスリソースをどれだけ 使用しているかも。 macOSとiOS 27では、 MetricKitがMetalフレームレート 情報を公開します、 他の多くの興味深いパフォーマンスと 電力メトリクスとともに。 StateReportingの状態の関数として MetalフレームレートもMetricKitが提供します。 フレームレートは集約され、 状態ごとにグループ化されます Metricレポートで。 このサンプルレポートでは、MetricKitが 全体的な平均フレームレートを報告します 時間とフレーム数とともに。 フレームレート情報を 分解することもできます レベルドメインの状態別に。 これらのメトリクスとその他多くが ゲームプロセスに届けられます ローカル分析ができる場所に。 また、データをパッケージ化して オフデバイス処理と集約のために送ることも。 これにより、フィールドでの ゲームパフォーマンスを監視でき、 調査して修正できる 潜在的な問題を特定できます。
メトリクスに加えて、 MetricKitは診断情報も提供します パフォーマンス問題を引き起こした コードパスを特定するのに役立ちます、 メモリ例外など。 ゲームがメモリ制限を超えて 終了された場合、 何が起きたかについての より深い洞察を得られます。
まとめると、iOSとmacOS 27では、 Metalパフォーマンスメトリクスが システムによって常に記録されています。 過去に遡ってパフォーマンスメトリクスを 収集する方法を示しました 時間と日数にわたる。 metalperftrace とInstrumentsを使用して それらのトレースを分析する方法も。
また、トレースにコンテキストを 追加するのに役立つ 新しいStateReporting APIも 紹介しました。
リリース後、MetricKitはプレイヤーデバイスから メトリクスと診断情報を届けます。
始めるには、StateReportingを 確認してください。 ゲームで最も重要な ドメインを設計します レベル、グラフィックス、ネットワーク状態を 報告し始めましょう。 ゲームをプレイテストし、 長いゲームセッションのトレースを収集して スムーズなプレイヤー体験が 確保されているか確認します サポートされているデバイスで。
MetricKitも必ず確認して、 プレイヤーデバイスからの 日次メトリクスレポートを収集しましょう。 利用可能なデータとMetricKitの 統合方法についての詳細は、 「Meet the new MetricKit」を ご確認ください。 新しいツールとワークフローを 試してください。 Apple Platformsで あなたのゲームをプレイするのを楽しみにしています。 ご視聴ありがとうございました!
-
-
5:00 - Collect a trace with metalperftrace
# Collect the last 5 hours metalperftrace collect /tmp --last 5h # Output # Metal performance traces collected to: /tmp # /tmp/MetalPerfTrace_20260401_094100_to_144100.atrc # Or collect an explicit time range metalperftrace collect /tmp \ --start 2026-04-01T09:41:00 \ --end 2026-04-01T12:41:00 -
7:02 - Print a trace overview
metalperftrace overview /Data/MyGameTrace.atrc # [Modern Renderer pid:13833] # Mem: 2146.1 MiB (2343.9 Peak, 1199.4 Metal) # Total CPU Time: 2417.601s (33.17% Sys, 66.83% User) # Instructions: 9944836683668 (5.75% P, 94.25% E) # Cycles: 5176430469224 (4.45% P, 95.55% E) # Disk Reads / Writes: 317.37 / 0.04 MiB (Logical Write 0.04) # Layer 0x729293000 (3456x2104) Interval 300.065s Active 300.065s # 59.7 FPS 17735 Frames 188 Skipped # Frame Time avg: 16.74ms min: 8.33 max: 125.00 stddev: 3.70 # CPU Begin-to-Present avg: 3.99ms min: 1.40 max: 94.37 stddev: 1.80 # On-GPU Time avg: 13.39ms min: 5.24 max: 37.57 stddev: 1.43 # Next Drawable Wait avg: 0.26ms min: 0.00 max: 91.08 stddev: 1.75 # Shader Compilation Time: 0.000s (Total: 0, Cached: 18) -
7:58 - Filter by process and emit JSON
// Report state transitions #import <StateReporting/StateReporting.h> NSString *domain = @"com.mygame.level"; SRStateReporter *reporter = [SRStateReporter reporterForDomain:domain]; [reporter reportTransitionToStateLabel:@"Level 1" stableMetadata:nil volatileMetadata:nil]; [reporter reportTransitionToStateLabel:@"Level 1" stableMetadata:@{ @"id": @1001 } volatileMetadata:nil]; [reporter reportVolatileMetadataUpdate:@{ @"health": @100 }]; -
13:55 - Include full state transitions in overview
metalperftrace overview /Data/MyGameTrace.atrc --include-state-transitions # [States] # com.mygame.graphics # High (30.59%, 14.996s) raytracing: 1 shadow: ultra # Medium (69.38%, 34.012s) raytracing: 0 shadow: medium # com.mygame.level # Level 1 (20.47%, 10.033s) biome: forest id: 1001 # Level 2 (79.53%, 38.991s) biome: volcano id: 1002 -
14:15 - Aggregate metrics by state
# Aggregate across all domains / transitions
metalperftrace overview /Data/MyGameTrace.atrc --aggregate

# Aggregate one domain
metalperftrace overview /Data/MyGameTrace.atrc --aggregate \
  --domain com.mygame.graphics

# Aggregate a specific state label within a domain
metalperftrace overview /Data/MyGameTrace.atrc --aggregate \
  --domain com.mygame.graphics \
  --state-label "High"
-