Measuring app performance
Understand how people discover and interact with your app or game using Analytics in App Store Connect. You can use this data to create even better app experiences and grow your business on the App Store.
Understand how people discover and interact with your app or game using Analytics in App Store Connect. You can use this data to create even better app experiences and grow your business on the App Store.

Learn how people discover and download your apps and games to help refine your marketing efforts. Acquisition data is available for iOS, iPadOS, macOS, tvOS, and visionOS apps.
To find out how many times people have downloaded your app or game, view your Total Downloads in the Overview section of Analytics. This metric includes First-Time Downloads as well as Redownloads of your app. A First-Time Download is when someone downloads your app or game to their device for the first time, whereas a Redownload is when someone who has previously downloaded your app or game adds it to their device again. You can get further detail with breakouts by territory, device, and source.
For a deeper understanding of where your downloads came from, view the Sources page in the Acquisition section. This displays your download data broken out by sources such as App Store Browse, App Store Search, App Referrers, Web Referrers, and more. This helps you gauge how effective your discovery efforts are and the strength of your marketing channels. Learn about measuring user acquisition sources.
Your conversion rate helps you understand how often people download your app after they’ve viewed it on the App Store. This is measured as the ratio of total downloads to unique impressions. Your total downloads include both first time downloads and redownloads, and unique impressions represent the number of people who view your app icon on the App Store in a given day. For example, if your app has 100 unique impressions and 50 total downloads on a particular day, your conversion rate is 50%.
Measure your performance over time and view this data by Source Type to understand which sources result in the highest conversion rate, or filter by a specific source for additional detail. This data can help you understand how changes to your product page, such as a new app icon, may affect your conversion rate. You can also use peer group benchmarks to compare your conversion rate to similar apps or games, and take action if you’re underperforming.
Measure the success of any App Store features you use, including:
You can include campaign links in your marketing efforts across channels — such as social media, email, paid advertising, or cross-promotion, and more — to help understand which are most effective. Campaign links take people to your App Store product page from your marketing efforts, so they can easily download your app or game. You can make links for different versions of your marketing creative — such as advertisements with different copy, calls to action, icons, characters, or screenshots — to learn which results in more downloads. If certain elements used in a particular campaign result in better conversion, you might choose to also use them on a custom product page or a product page optimization test. To get additional details on the performance of an individual campaign, view your conversion rate and filter by campaign.
Learn more about generating campaign links
Before your app is released, you can offer it as a pre-order on the App Store to let people order it ahead of time and have it automatically download on their devices once available. While your app or game is available as a pre-order, Analytics displays how many pre-orders you’ve received. Once it’s available on the App Store, you can view associated downloads and sales that resulted from a pre-order.
Learn about offering your apps and games for pre-order
Measure app usage — including active devices, sessions, and retention — as well as user acquisition sources for your iOS, iPadOS, macOS, tvOS, and visionOS apps. Usage data includes only users who have agreed to share their diagnostics and usage information with you.
To understand how frequently people use your app or game, you can look at your Active Devices and Sessions metrics. You can see your sessions in the Metrics page in Analytics. For additional insight, you can view or filter this data by different dimensions, such as:
Your retention rate is the percentage of devices on which your app or game has been used in the days following a download. This data helps you understand whether people regularly engage with your app and its content. If your retention rate is low, you might update your onboarding experience in order to better help people understand how to use your app and see if your retention rate improves. For additional insight you can filter this data, for example:

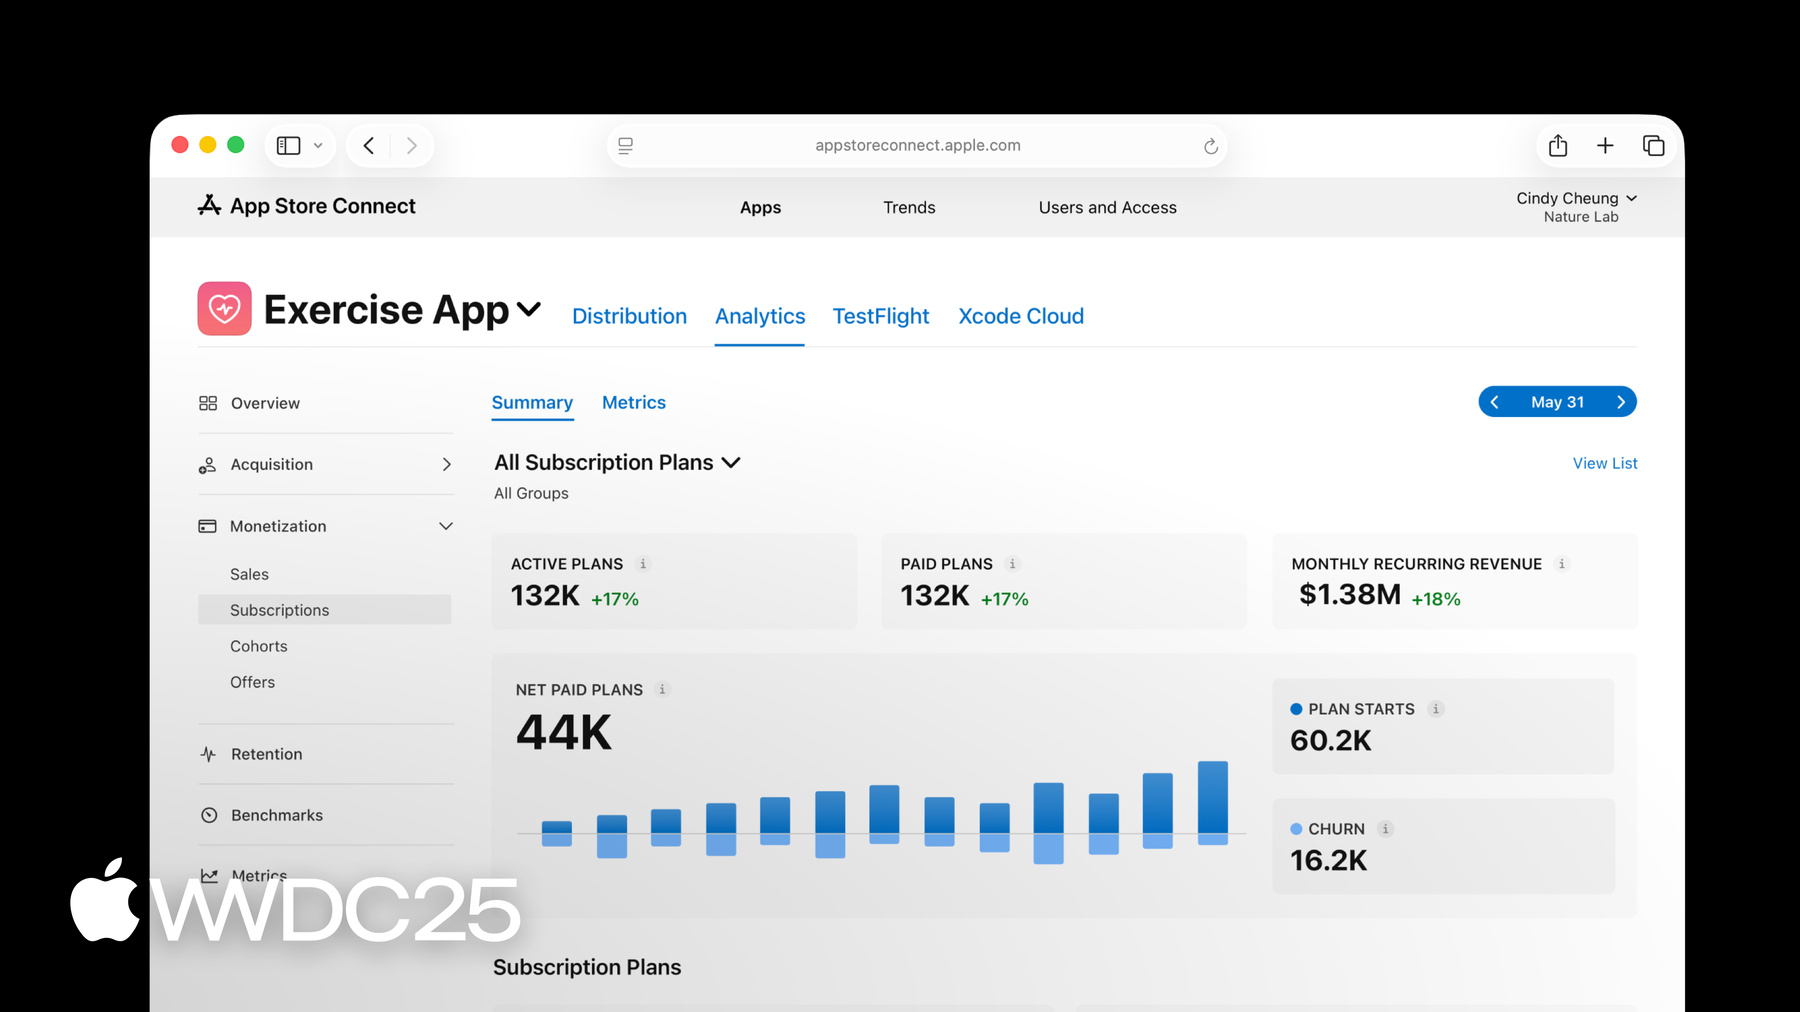
Measure the daily performance of your apps and In-App Purchases on iOS, iPadOS, macOS, tvOS, and visionOS. Monetization data is recorded when someone initiates a transaction on the App Store, the Apple Games app, or within your app or game. Note that data for iMessage apps and sticker packs is associated with iOS.
Additional resources:
The App Store provides a powerful commerce system that makes it simple to offer your digital goods, content, and services across Apple platforms to people around the world. Your Overview page provides a high-level summary of data related to your In-App Purchases, including proceeds, paying users, and sales. This data is based on any In-App Purchases made within your selected timeframe across your app, within your app, and on the App Store and Games app. You can view or filter this data for additional insight, for example:
To view your total sales for any In-App Purchases and bundles you offer associated with your app, select the Sales section. Sales metrics are provided in USD based on a rolling average of the previous month’s exchange rates, with refunds subtracted. Please note that sales totals are recorded when someone initiates a transaction, not when Apple has successfully billed and collected payment from the individual.
The Sales section provides you with your total sales for the selected time frame, as well as the percent change from the previous time frame (for example, this month’s sales compared to last month’s sales). You can also see a graph of sales per day. Filter or view this data by different dimensions for more details. For example:

A paying user is a unique user, based on their Apple Account, who has paid for an app, game, or In-App Purchase. To see proceeds per paying user, choose proceeds in the Metrics tab and compare this data to paying users. Look for variation in this data for different versions of your app to understand if your updates might have affected user spending. You can also filter this data by different dimensions for more insight. For example:
With data from the entire catalog of apps on the App Store, peer group benchmarks provide accurate, relevant, and privacy-preserving comparisons for apps across categories, business models, and download volumes. This lets you put your app’s performance into context by comparing it to that of similar apps on the App Store across several key metrics, including conversion rate, retention rates, crash rate, and average proceeds per paying user to better understand your app’s performance. Peer group benchmark metrics are displayed in weekly intervals and defined in the same way as the standard app metrics in Analytics.
Peer groups are created using a number of different attributes to help ensure you can compare your app’s performance to the most relevant benchmark, including:
Learn how to view benchmark data

If there’s a particular metric that you want to improve, you can take advantage of helpful tools and capabilities in App Store Connect, such as product page optimization, custom product pages, and TestFlight. Here are some options to consider:
The conversion rate metric helps you understand how often people download your app after viewing it on the App Store. A higher conversion rate means you’re able to acquire users more efficiently. For example, if your app was viewed on the App Store on 100 devices for a certain period of time, and 25 people downloaded or redownloaded it, your conversion rate is 25%. To improve this metric, you might:
Analytics provides three monetization-related benchmarks to help you evaluate your business performance. Together, insights from these benchmarks can help you understand where your performance is strong or whether there’s room for improvement. If you’re below average, you might:
The crash rate is the average number of crashes per session for the selected period. For example, if your app had 10 crashes and 100 sessions for the selected period, your crash rate would be 10%. To improve this metric, you can:
Your retention rate gives you insight into how often users come back and engage with your app over time. This rate is calculated by dividing the number of devices that opened your app in the days after downloading it by the total number of devices that downloaded it on the same day, and opened the app in the last 30 days. For example, if your app was first downloaded on 100 devices on May 1, and 20 devices are still active with at least one session on May 8, the day 7 retention rate on May 8 is 20%.
View your total monthly proceeds and total units sold, as well as payment details by territory. Proceeds are dispersed in your bank account’s currency. To download this information as a monthly report, click the Create Reports button, or automate this process using the App Store Connect API or Reporter.
You’ll see Total Estimated Proceeds at the top of the page until payment has been transferred to your bank. Once transferred, you’ll see Total Proceeds at the top of the page, which will reflect the final proceeds paid for the corresponding region and reporting period. Please note the amount you receive may vary due to changes in foreign exchange rate at the time of payment and any applicable withholding tax, which will be applied when the payment is made.
To learn more, view Getting paid in App Store Connect Help.
At Apple, we build privacy protections into each of our products and services, including Analytics in App Store Connect. App usage and App Clip metrics only include data from users who have agreed to share their diagnostics and usage information with app developers. In order to preserve privacy, certain sources — such as app referrers, web referrers, and campaign links — require a minimum threshold of data in order to display in Analytics. These privacy protections are applied throughout Analytics, including subscription and cohort views. Peer group benchmark values are created using differential privacy — the gold standard for ensuring that individual values within a group remain private. Peer group benchmarks only include app usage data from users who’ve agreed to share their app analytics with app developers. Where applicable, Apple’s own apps may be included in peer group benchmarks in order to provide a more full and complete picture of performance for a particular category, business model, or download volume tier.