App Store Connect Analytics Help
Custom Product Pages
Custom Product Pages let you create tailored versions of your product page with unique screenshots, app previews, and promotional text. Each page can relate directly to a specific audience or campaign, helping you deliver a more relevant message throughout your marketing.
Analytics in App Store Connect helps you measure each page across the full customer journey, including product page views, downloads, and conversion rate, along with downstream metrics like subscription performance and sales. This lets you evaluate not only which page converts best—but which page brings in the highest-value users.
You can filter all of these metrics by dimensions like territory, source type, and device to understand which Custom Product Pages are most effective in different markets and contexts.
Data for a particular Custom Product Page will appear once it receives at least five first-time downloads.
To export Custom Product Page data in bulk, use the Analytics reports in the App Store Analytics API. Data about individual Custom Product Pages is only available for export in the detailed reports, which have more rigorous privacy protections than the standard reports.
View Custom Product Page data
-
In Apps, select the app you want to view.
-
Click the Analytics tab.
-
In the sidebar under Acquisition, click Product Pages. The product page dashboard will display all your custom product pages. Click on a page name to view its available data.
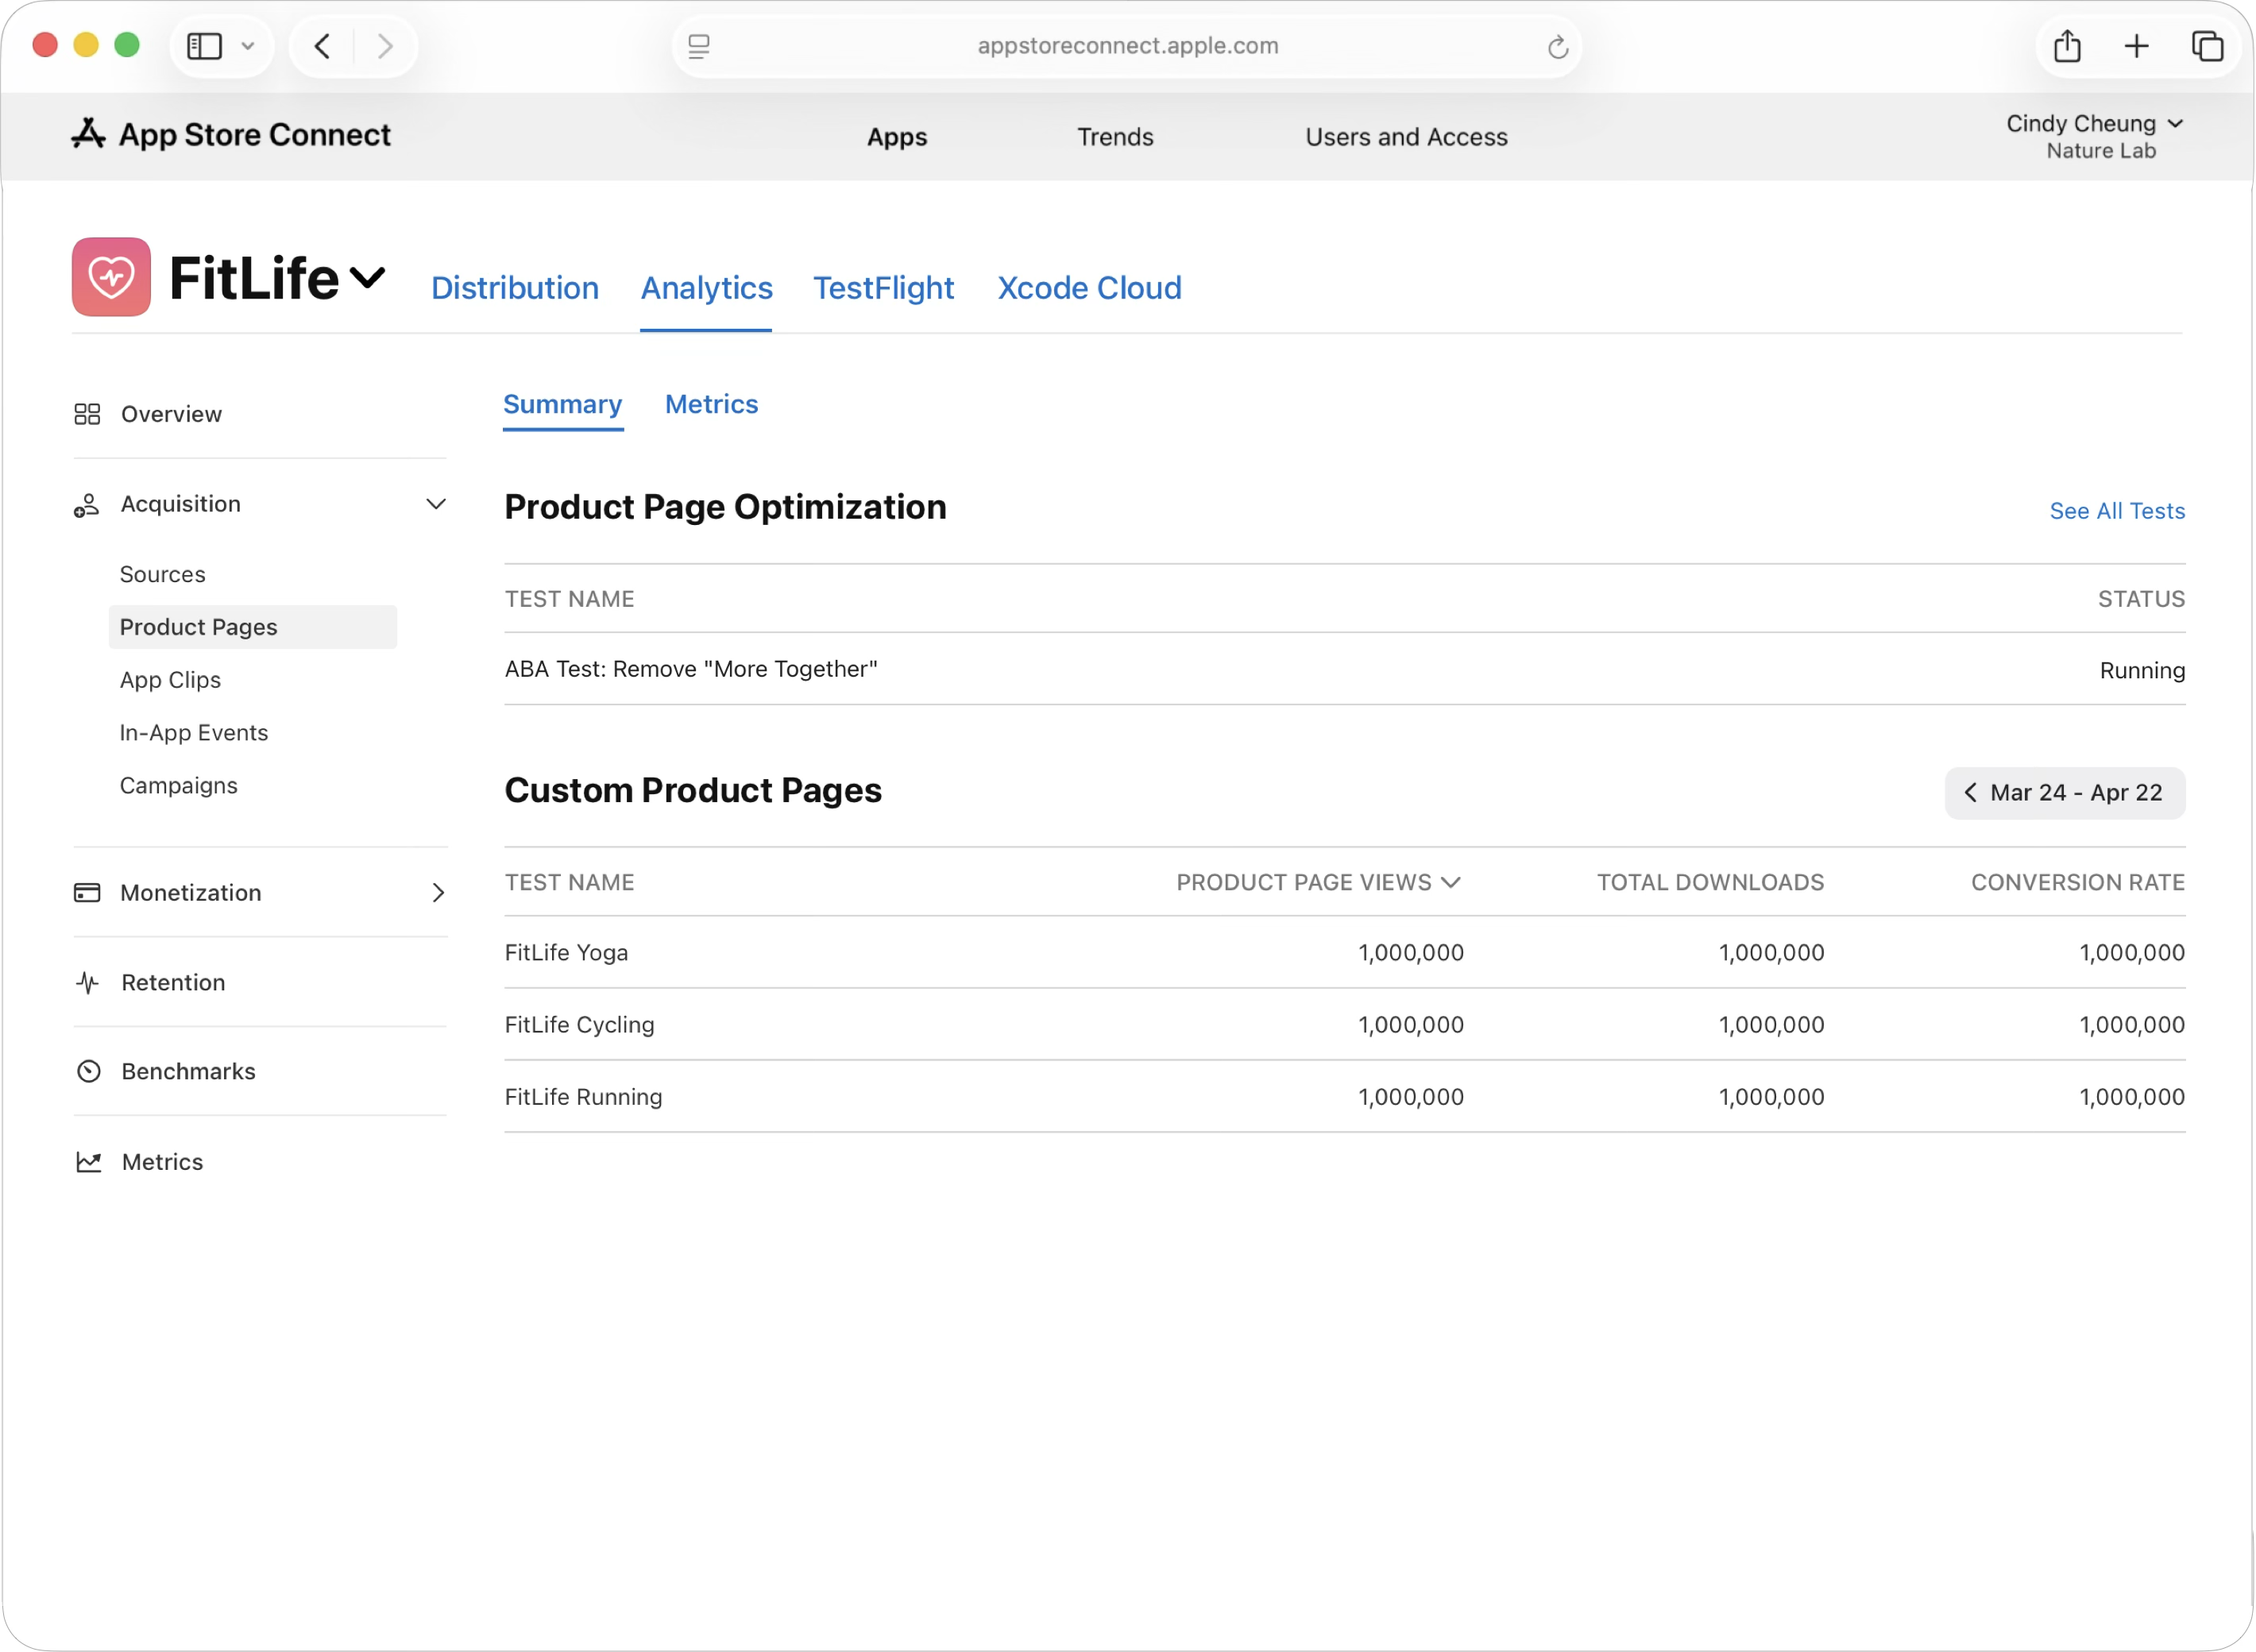
-
The Custom Product Page dashboard displays key performance metrics like Product Page Views, Total Downloads, and Conversion Rate. Below these, a Proceeds graph shows daily revenue, while the Average Proceeds per Paying User chart details monetization per user across various retention milestones.
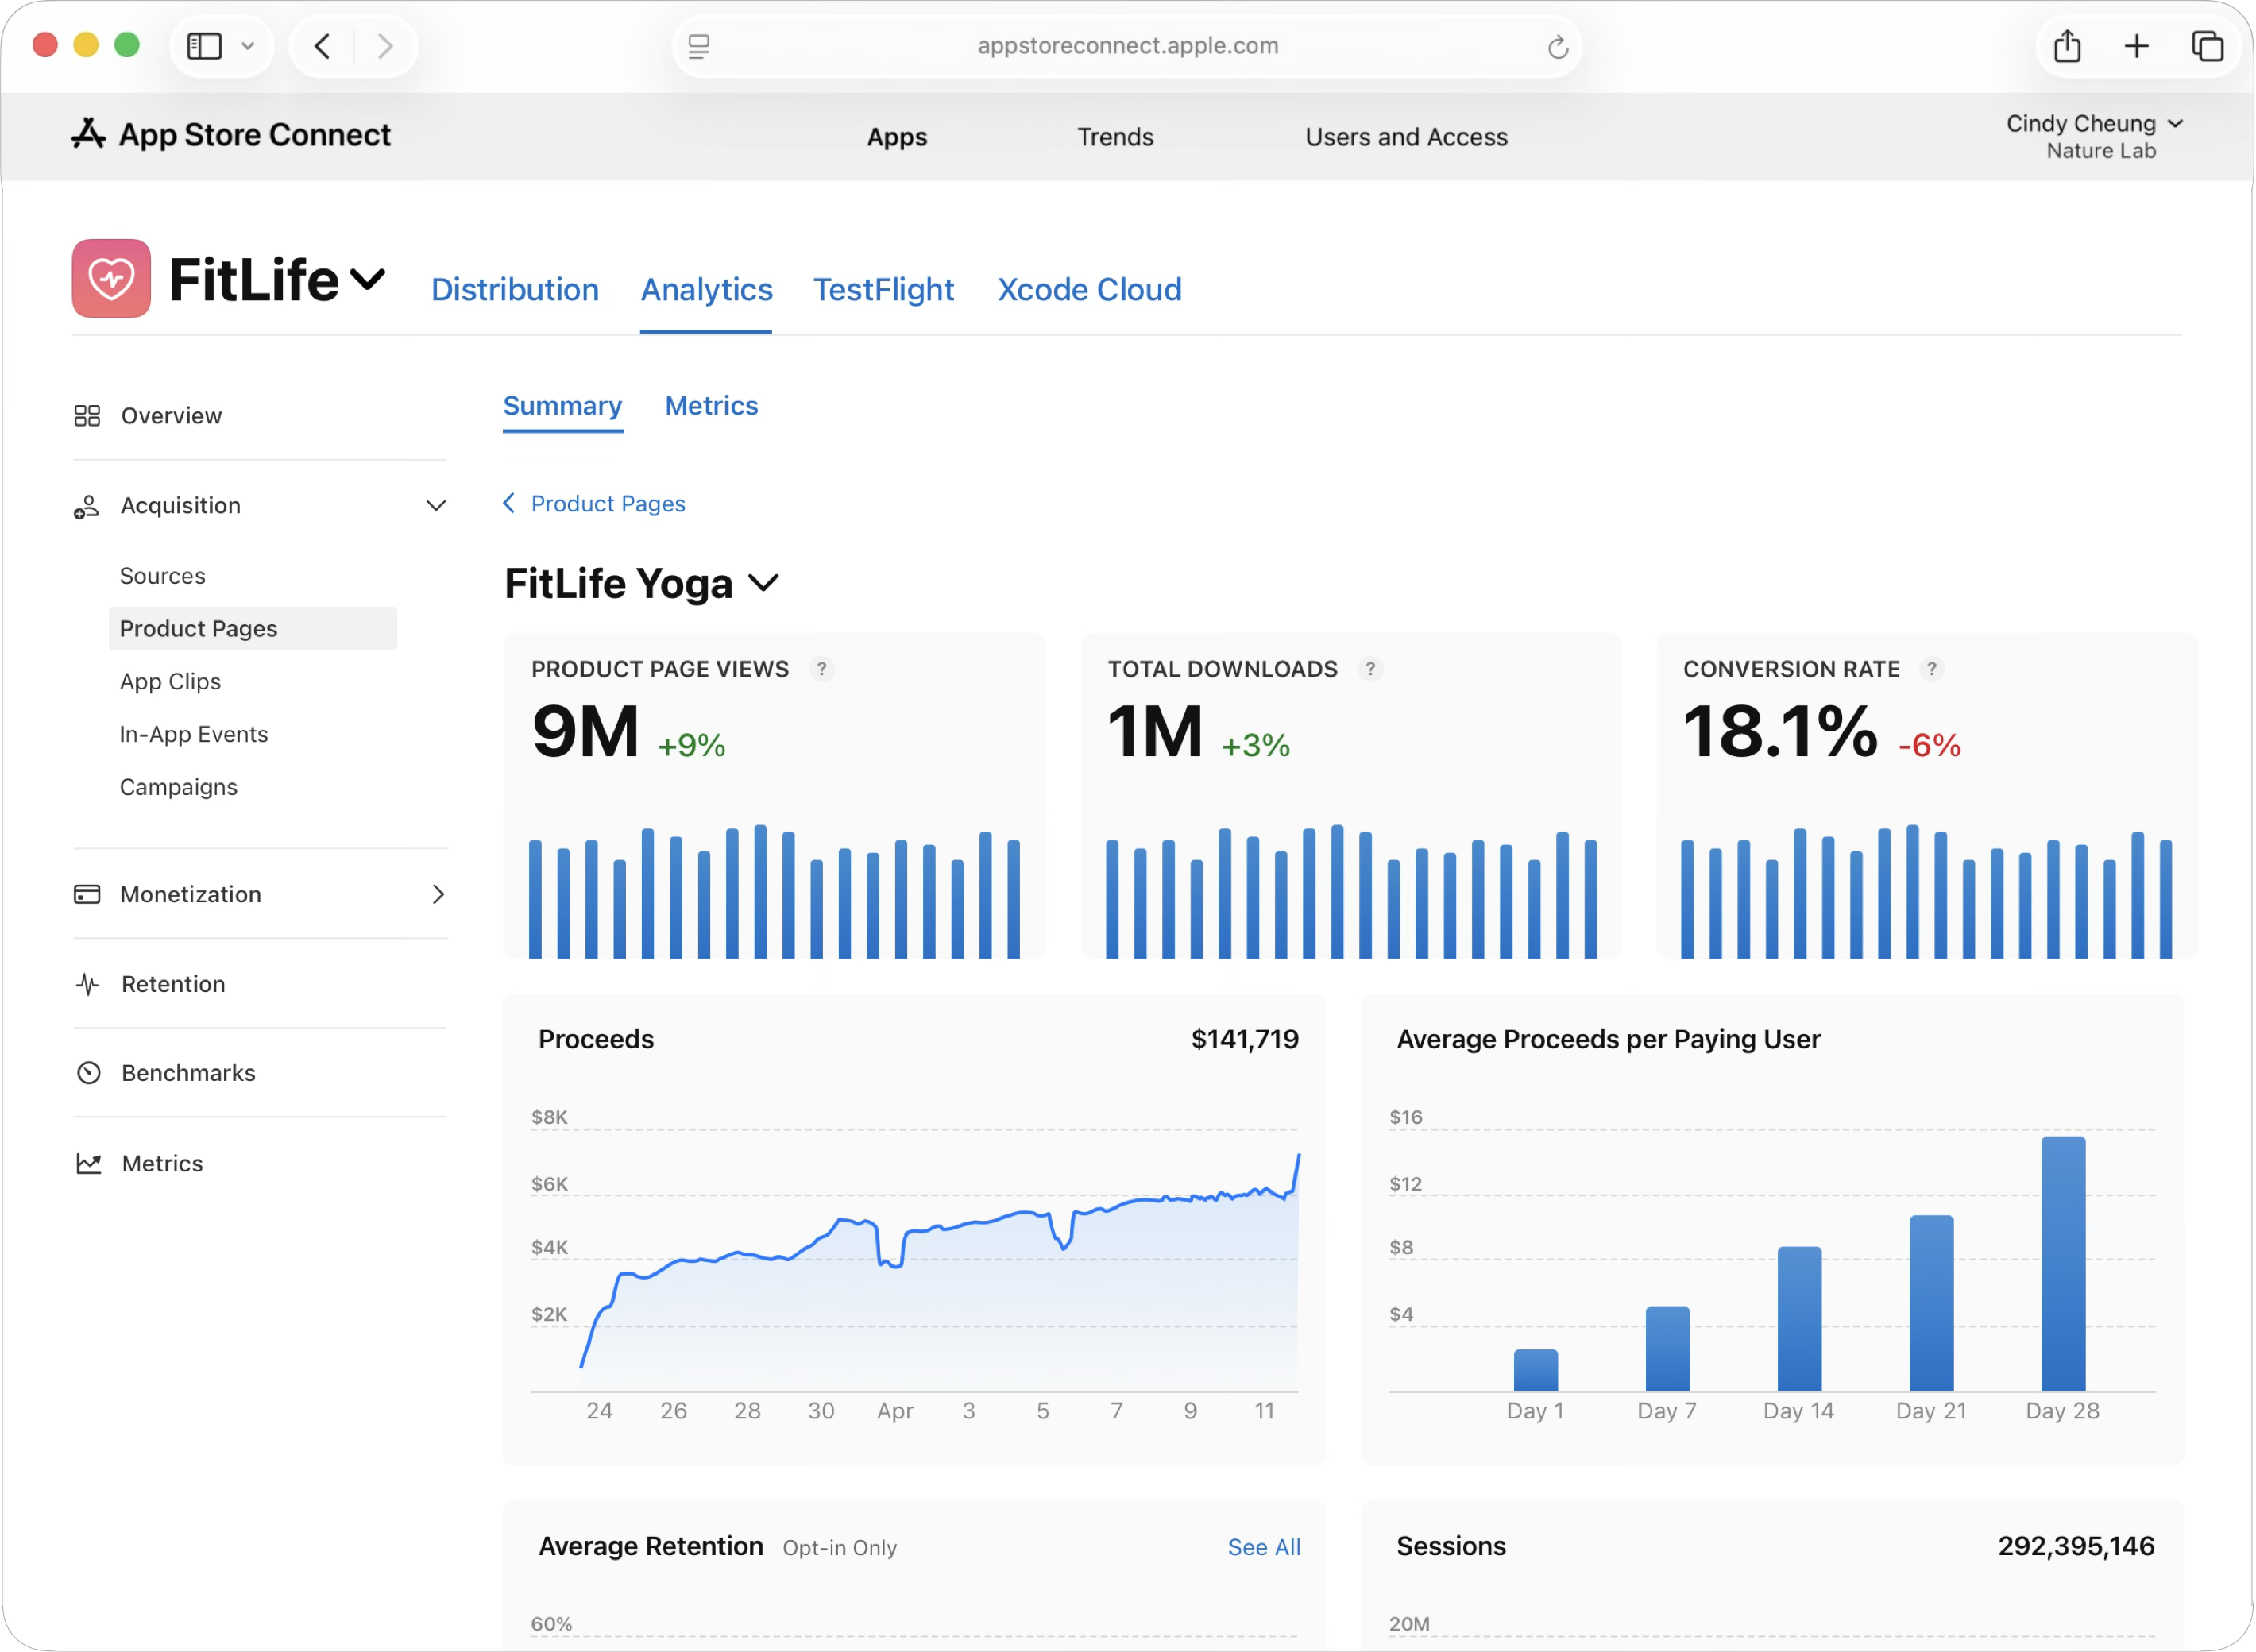
-
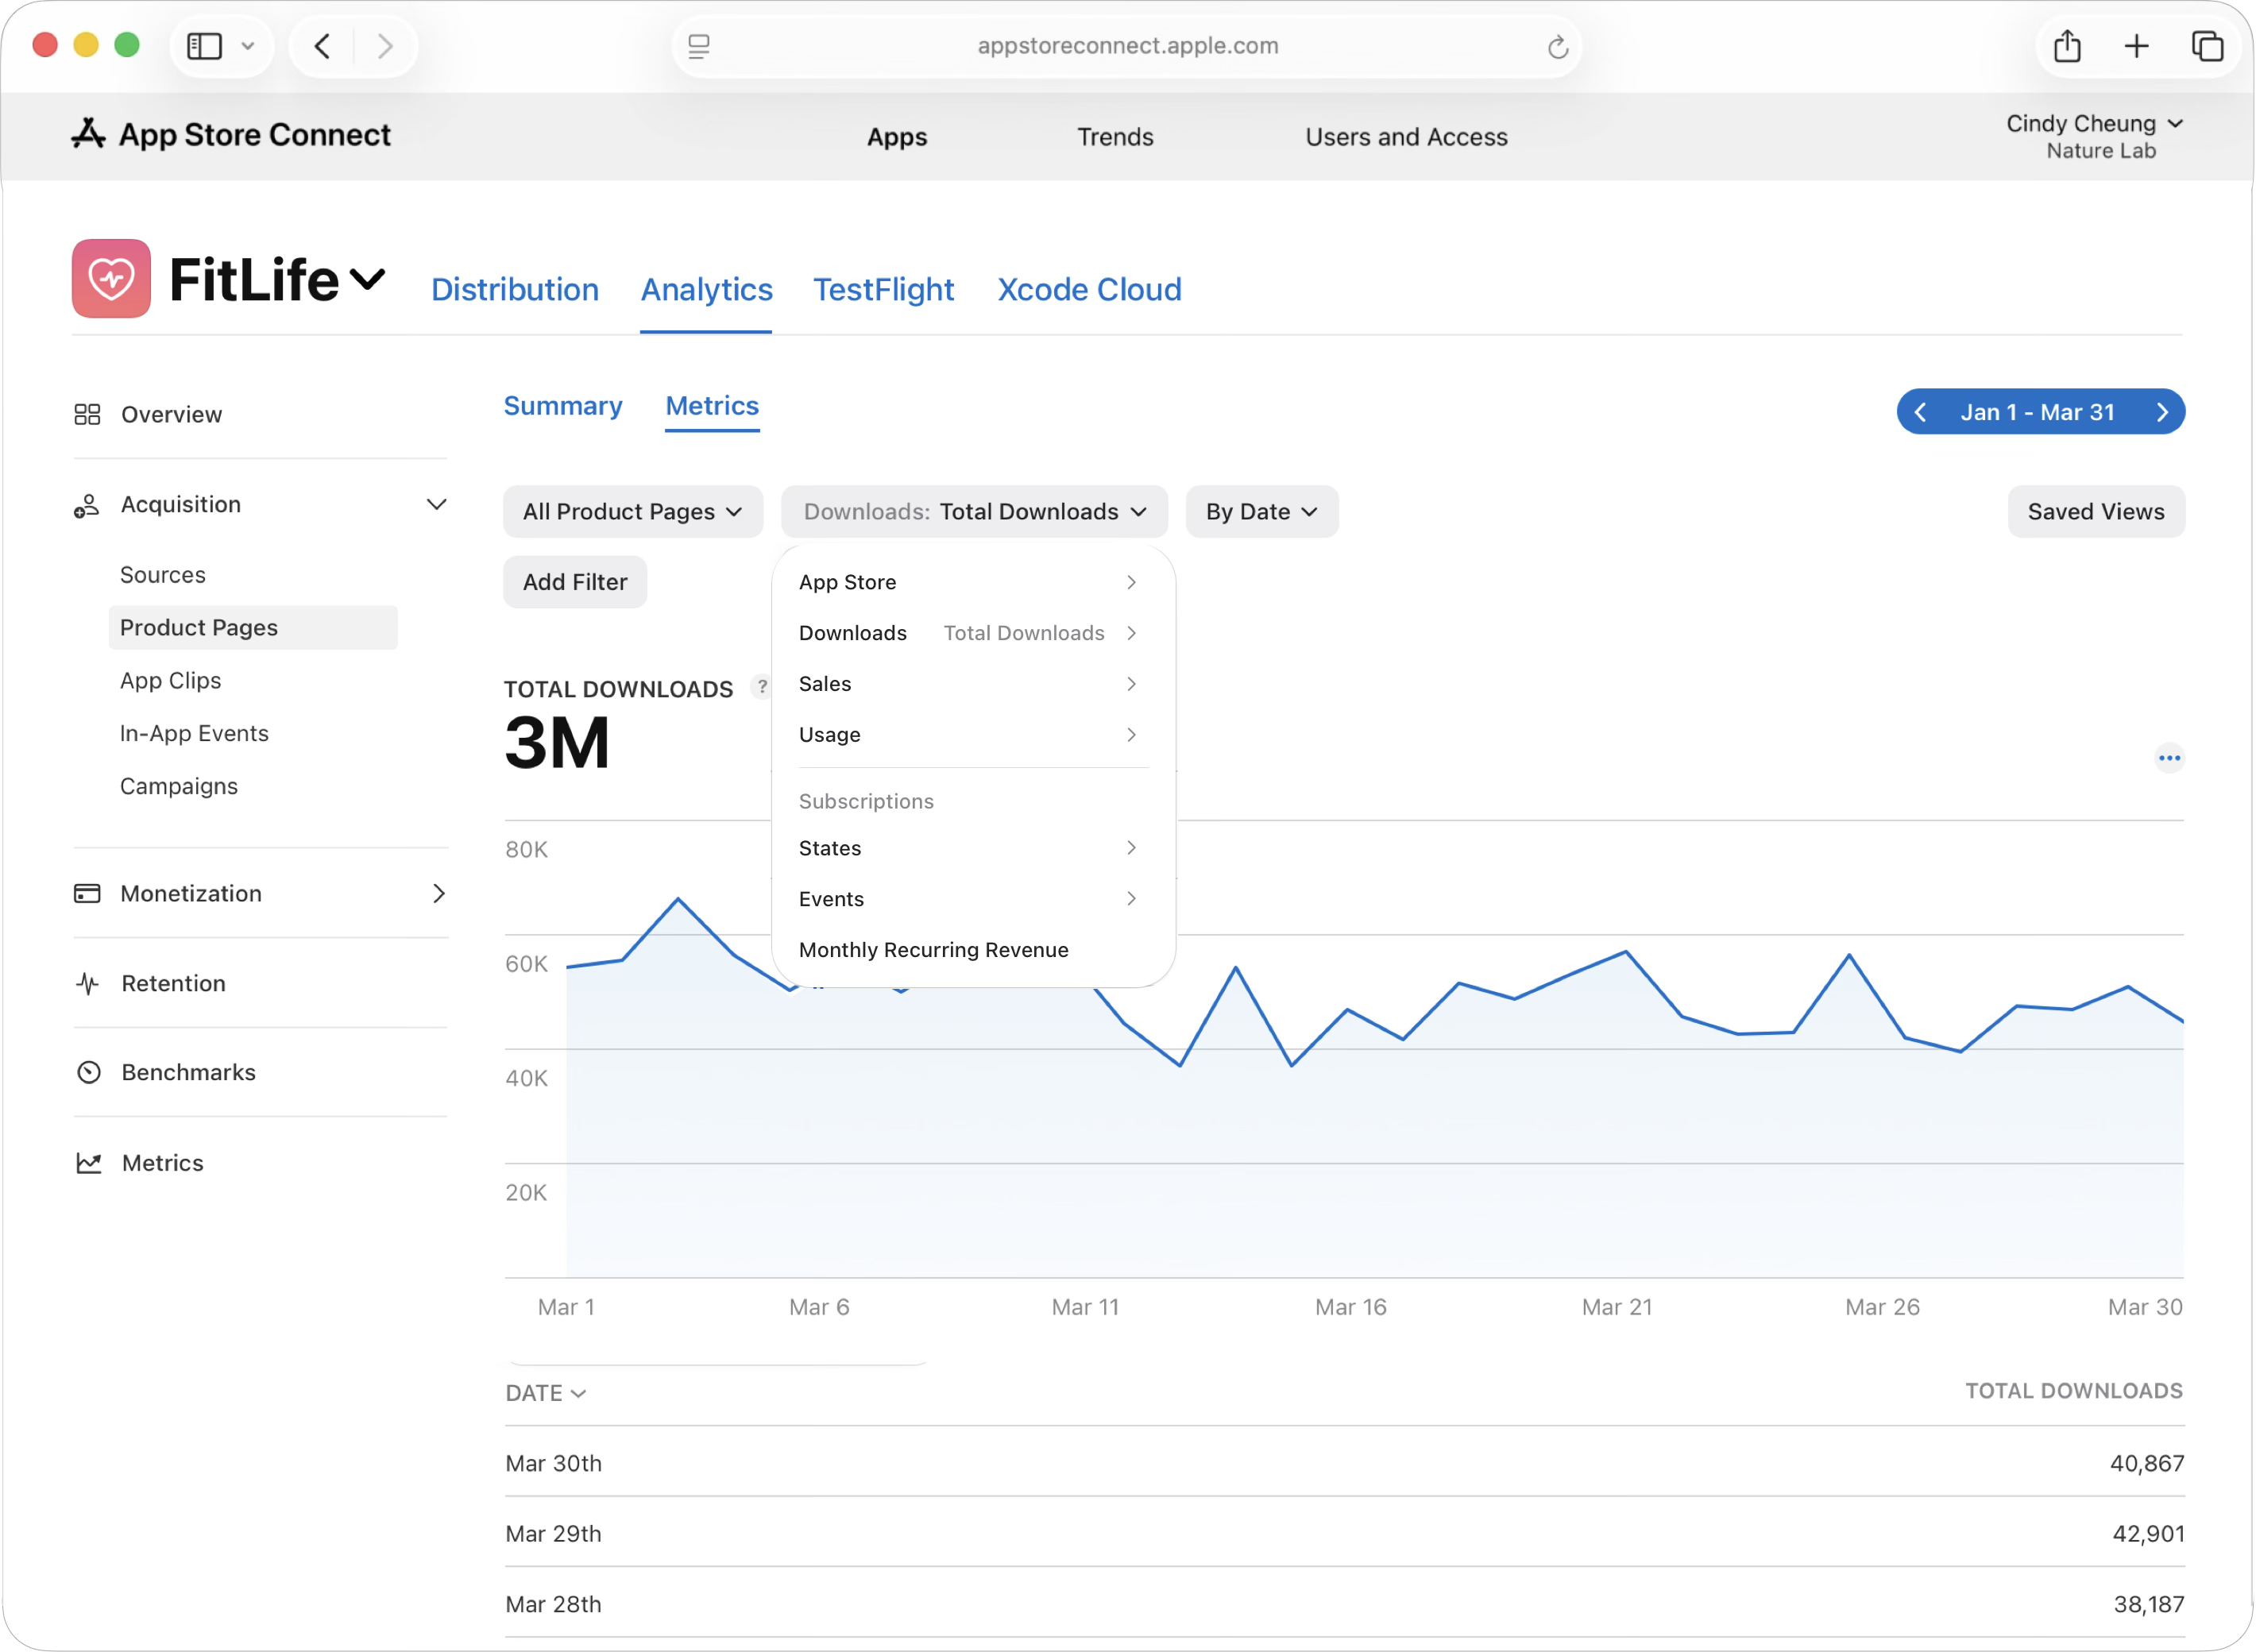
To analyze Custom Product Pages more deeply, navigate to the metrics tab and use the filter options to select individual Custom Product Pages or compare multiple variations side-by-side.
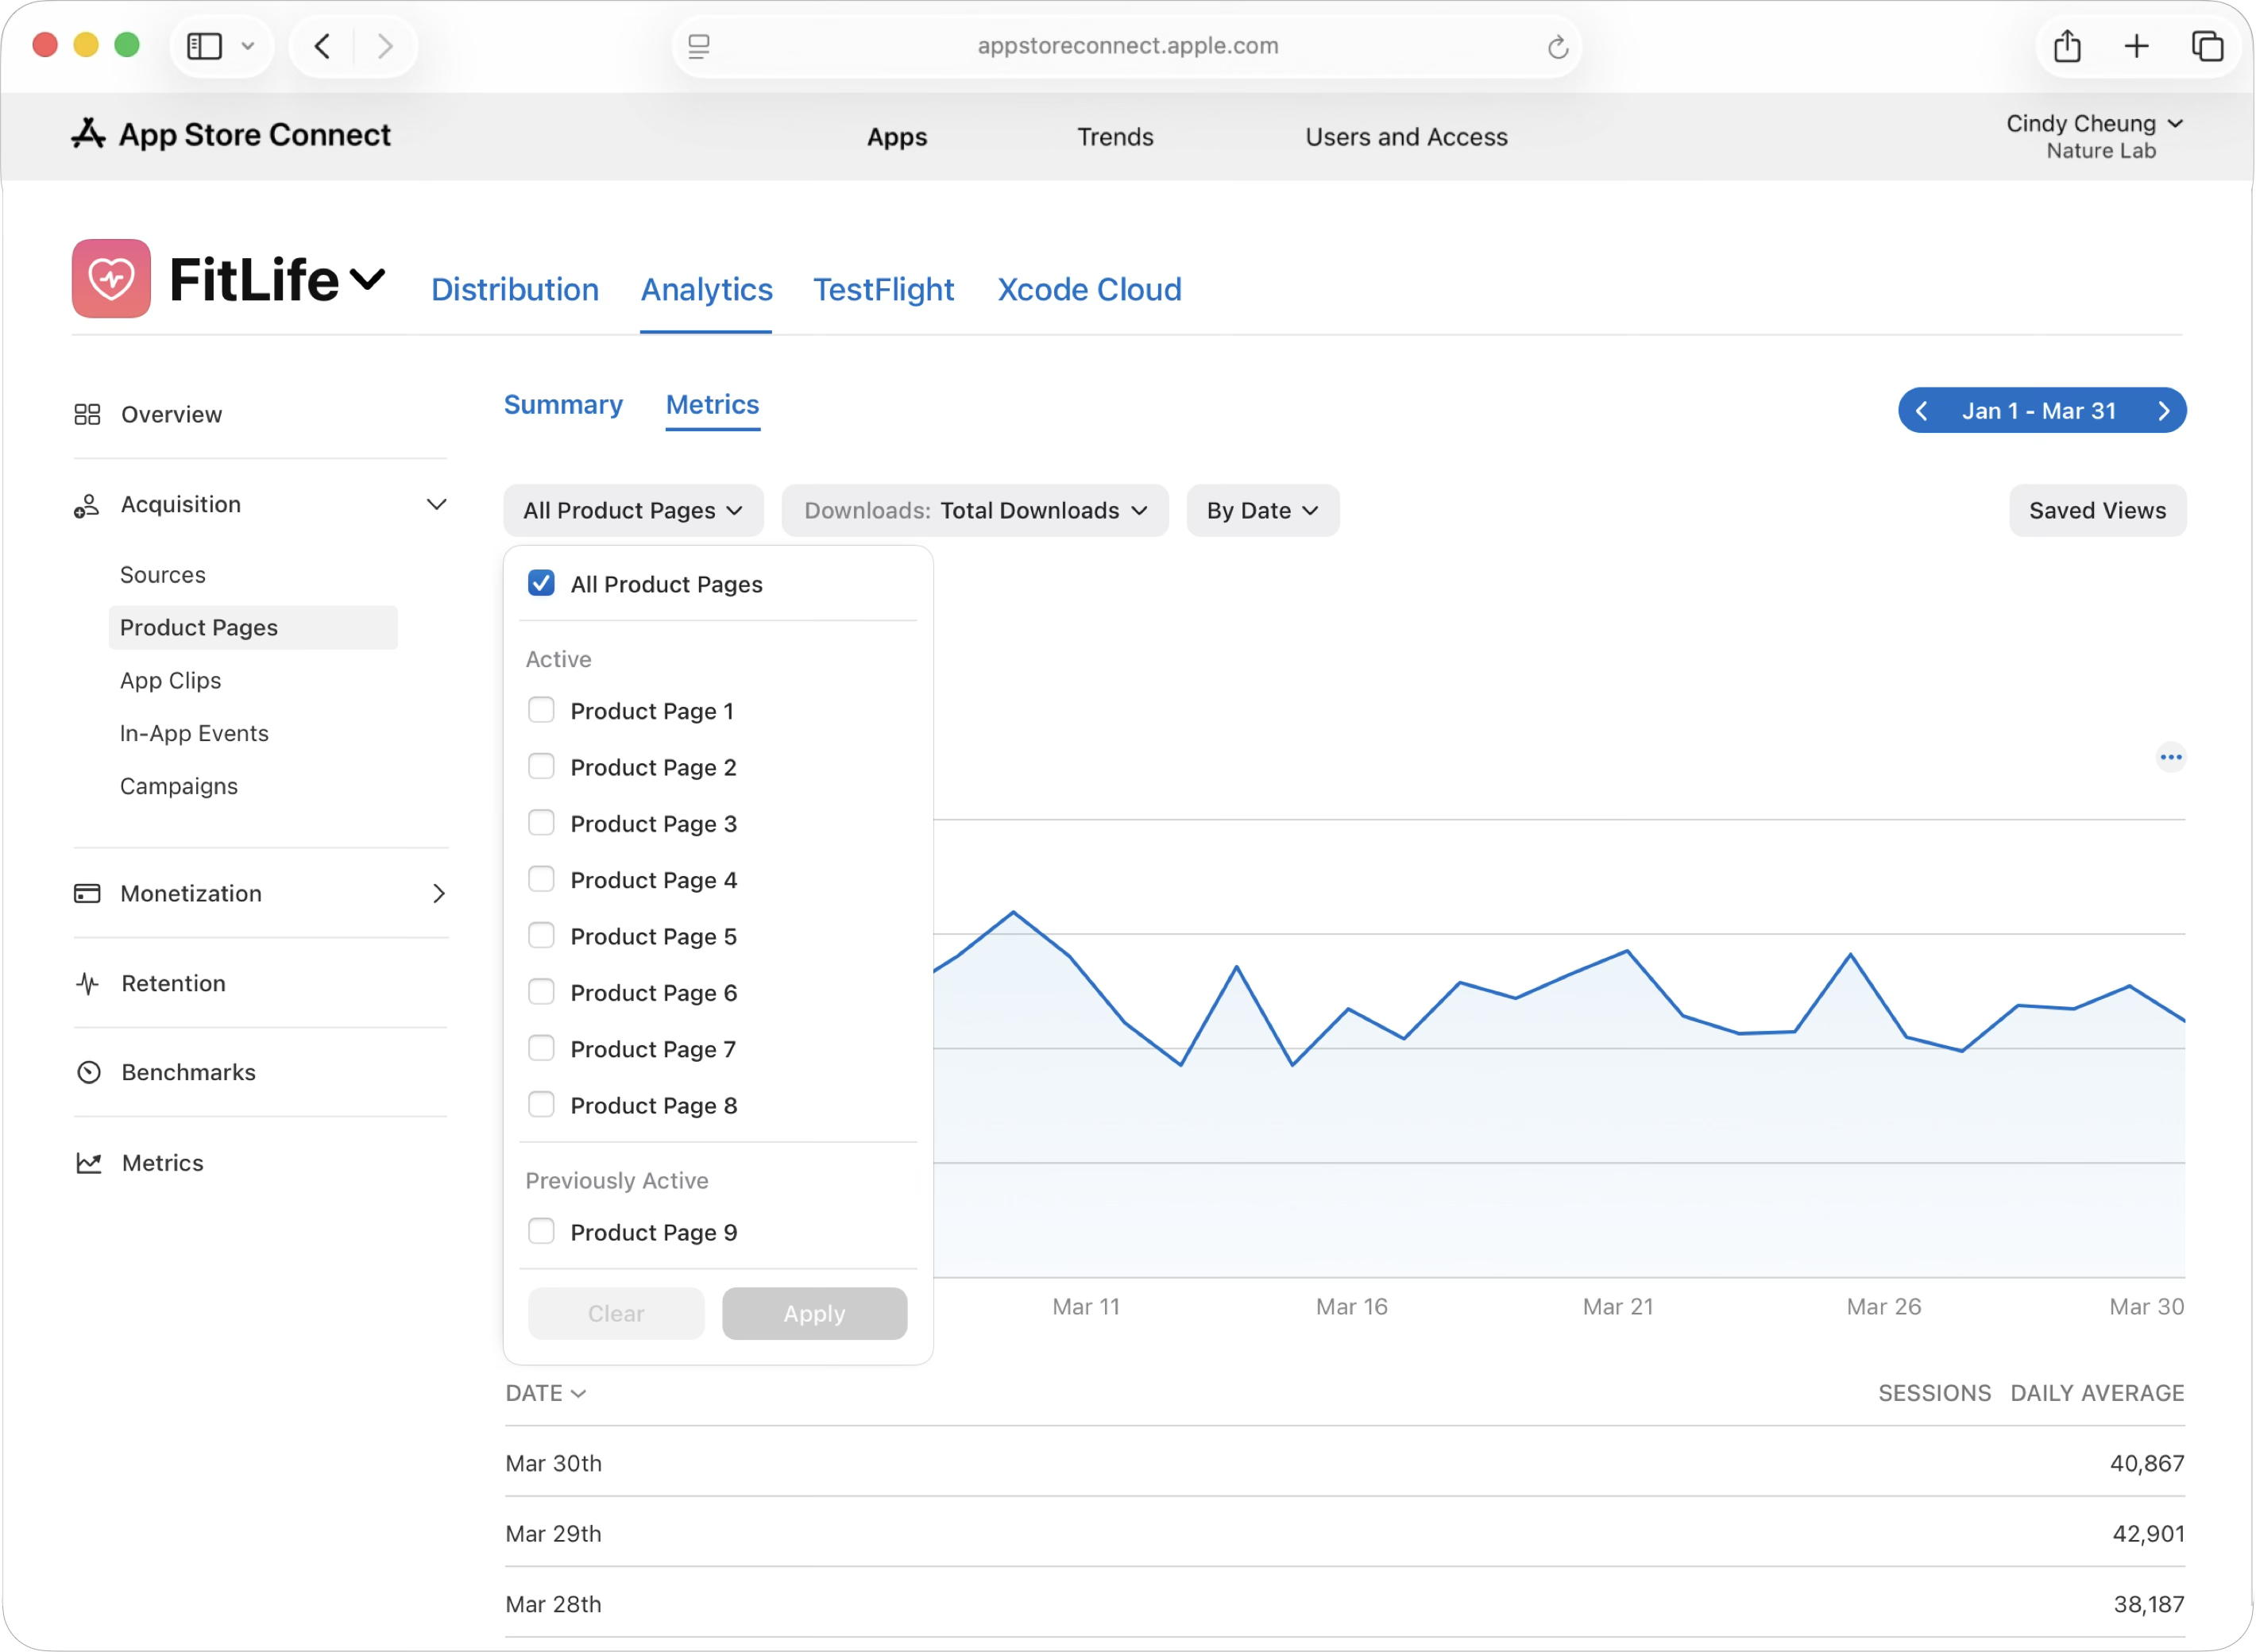
-
Use the metrics drop down to select from over 100 metrics. You can also add filters and segment your results by various dimensions. For example, you can view your data by territory or device type to understand which geographic markets and device types each Custom Product Page reaches most effectively. Use the date pickers to view data by a specific date range or select a custom time period.