App Store Connect Analytics Help
App retention
App retention shows when users open your app after installing it. It's one of the most important indicators of long-term app health, helping you understand whether people who install your app go on to engage with it over time.
In Analytics, retention data is presented as a time-based table that shows the percentage of users who opened your app on specific days after installation. This view makes it easy to spot engagement patterns, compare cohorts, and evaluate how changes—such as new features, onboarding updates, or marketing campaigns—affect user behavior over time.
What retention measures
App retention measures usage over time. More precisely, retention tells you the percentage of active devices that installed the app on the selected day and opened the app a certain number of days later.
Users who install your app but never open it do not qualify, and are not counted in the numerator or the denominator of the calculation. For example:
-
Day 1 retention shows the percentage of active devices that opened your app 1 day after installation.
-
Day 5 retention shows the percentage of active devices that opened your app 5 days after installation.
If someone installs your app on January 1st, but doesn't open it until January 10th, then the denominator for all January 1 retention rates will increase by one on January 10, because that new user has been added to the calculation for the first time. For this reason, you may notice the number of active devices increase over time for any given installation date.
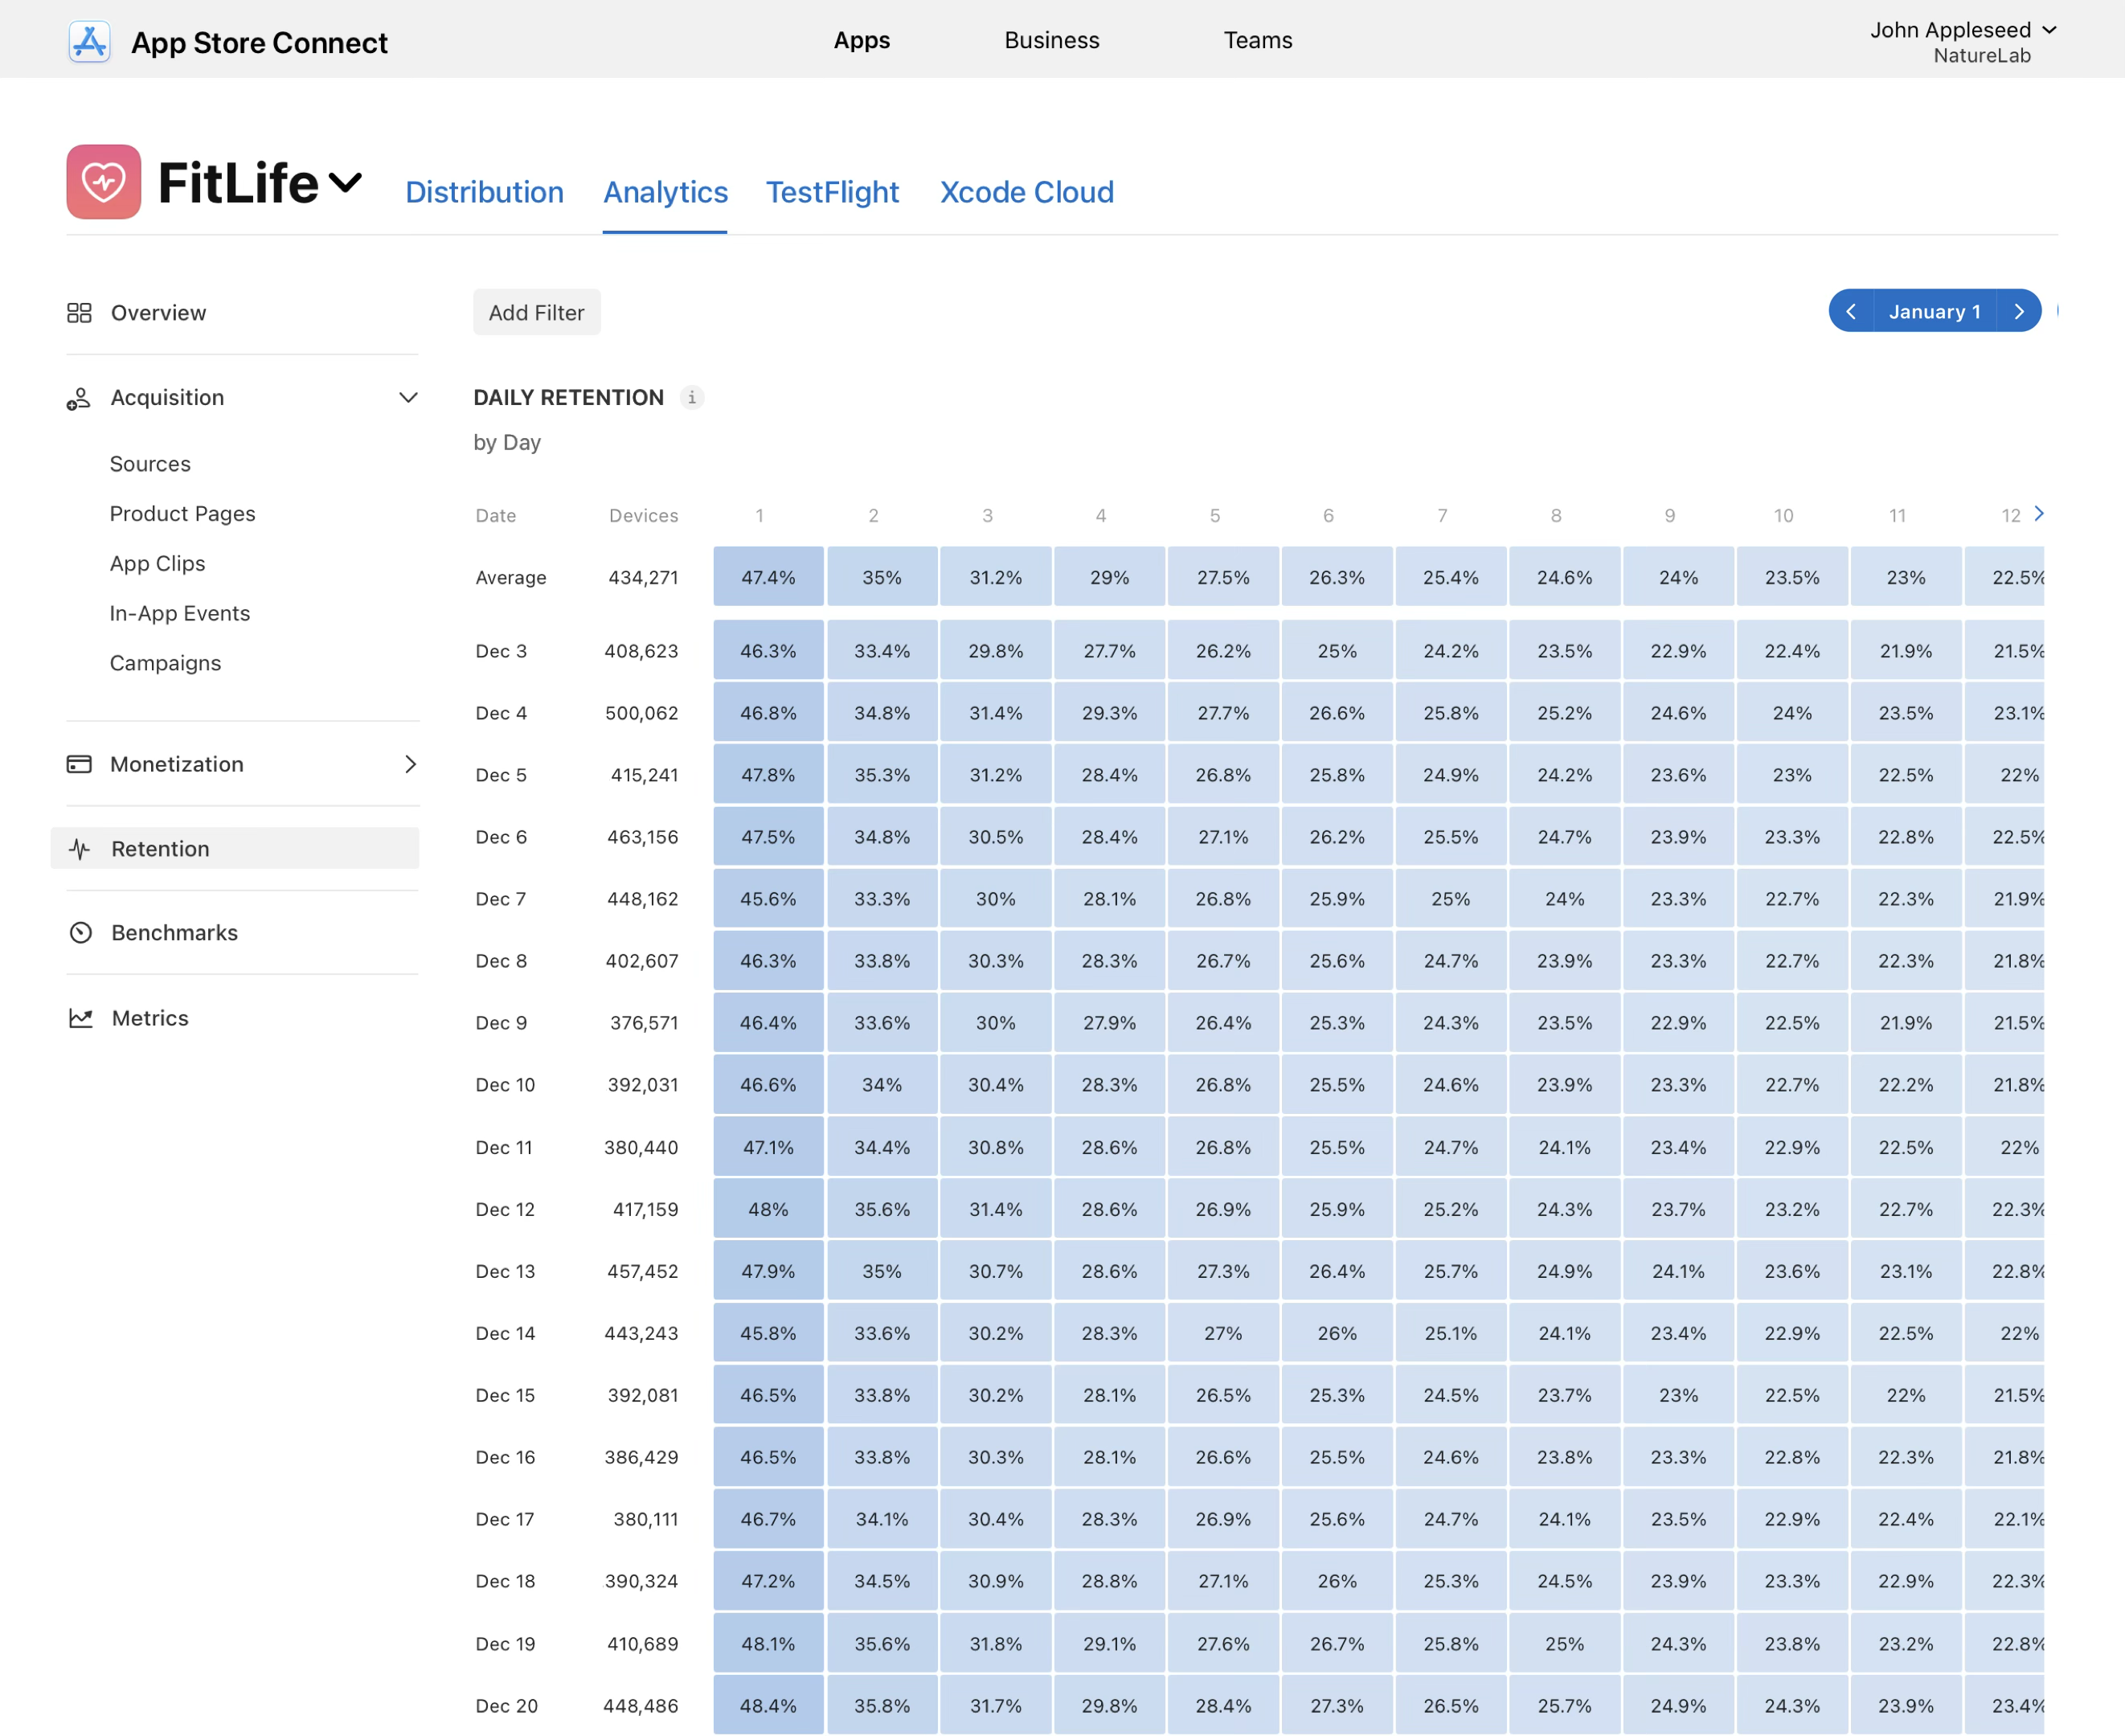
How to read the retention table
The retention view is organized as a grid.
-
Rows represent cohorts of users who installed your app on the same day.
-
Columns represent the number of days after installation.
-
Cells show the percentage of that cohort (among installers who have ever opened) that opened the app on that day offset.
An Average row appears at the top, summarizing retention across all visible cohorts for each day. This helps you understand typical performance and quickly compare specific install dates against the overall pattern. As you move right across a row, you can see how engagement changes over time—whether users tend to open immediately, whether engagement decays quickly, or whether there are later spikes that suggest delayed activation. Hovering over any cell provides a plain-language explanation of what the value represents for that cohort and day offset.
Filtering app retention data
You can add filters to segment retention data and better understand which users are opening your app and when.
Common filters include:
-
App version See whether a release changed engagement patterns after install.
-
Device Compare engagement timing across iPhone, iPad, and other devices.
-
Platform version Identify differences tied to OS versions.
-
Region Understand geographic patterns in engagement and activation timing.
-
Product page or In-App Event Explore how App Store experiences correlate with post-install engagement.
-
Source or campaign When available, compare engagement timing by acquisition channel.
Not all filters apply to every metric. Analytics only enables filters that are compatible with retention data so comparisons stay meaningful.
Privacy and data availability
Retention is based on usage data, which is collected only from users who have agreed to share diagnostics and usage information. Retention data appears only when a sufficient number of users have opted in. Cells may remain blank if privacy thresholds are not met, or for new apps and low-volume cohorts. It may take time for retention data to become available. You can view the opt-in rate history directly on the retention page to understand the users who have shared usage data and how these trends might affect what you see in the table.