App Store Connect Analytics Help
Sales
Sales data within Analytics enables you to have a complete view of how your app generates revenue through app and In-App Purchases, and allows you to break down your results to identify key sales drivers. For example, you can see which In-App Purchases users buy the most, compare your revenue by territory, or see which user acquisition channels are driving the most revenue.
Analytics in App Store Connect also provides you with cohort capabilities for your sales data, enabling you to see how many users start paying in the days after download, and how much they spend. Learn more about cohorts.
Sales data will appear in the Analytics dashboard when at least one purchase has occurred — either as a paid app purchase or an In-App Purchase.
To export sales data in bulk, use the Analytics reports in the App Store Analytics API.
Sales metrics
|
Metric |
Definition |
||||||||||
|---|---|---|---|---|---|---|---|---|---|---|---|
|
In-App Purchases |
The number of In-App Purchases on devices running a minimum of iOS 8, macOS 10.14.1, tvOS 9, or visionOS 1. Introductory price subscriptions and subscription renewals are included in this metric. Restored In-App Purchases, whether on the same or different device, aren't counted. |
||||||||||
|
Proceeds |
The estimated amount of proceeds you'll receive from your sales on the App Store. This is the Customer Price minus applicable taxes and Apple’s commission, per Schedule 2 of the Paid Apps Agreement. |
||||||||||
|
Sales |
The total amount billed to customers for purchasing apps, app bundles, and In-App Purchases on the App Store. Taxes are only included in the sales if those taxes were included in the product price. Note that sales totals aren't the same as your proceeds. Locate your payments in Payments and Financial Reports on App Store Connect if you have the Admin or Finance roles. |
||||||||||
|
Paying Users |
The number of unique users, based on Apple Account, that paid for an app or an In-App Purchase on the App Store. |
||||||||||
|
Refunded Proceeds |
Total proceeds that have been refunded during the selected reporting period. |
||||||||||
|
Refunded Sales |
Total sales that have been refunded during the selected reporting period. |
||||||||||
|
Refunded Purchases |
Total number of purchases that have been refunded during the selected reporting period. |
||||||||||
|
Proceeds Refund Rate |
The percent of proceeds that have been refunded during the selected reporting period. |
||||||||||
|
Sales Refund Rate |
The percent of sales that have been refunded during the selected reporting period. |
||||||||||
|
Purchase Refund Rate |
The percent of purchases that have been refunded during the selected reporting period. |
||||||||||
Filters and dimensions
|
Term |
Definition |
||||||||||
|---|---|---|---|---|---|---|---|---|---|---|---|
|
Purchases |
The app or In-App Purchase, by name or Apple ID. View or filter Sales data by Purchases to locate data for your app or individual In-App Purchases on the App Store. |
||||||||||
|
Purchase Type |
The type of purchase, including Consumable, Non-Consumable, Non-Renewing Subscription, or Auto-Renewable Subscription. |
||||||||||
|
Refund Type |
The type of refund, including Full, Partial, or Complete My Bundle. |
||||||||||
View sales data
-
In Apps, select the app you want to view.
-
Click the Analytics tab.
-
In the sidebar under Monetization, click Sales.
-
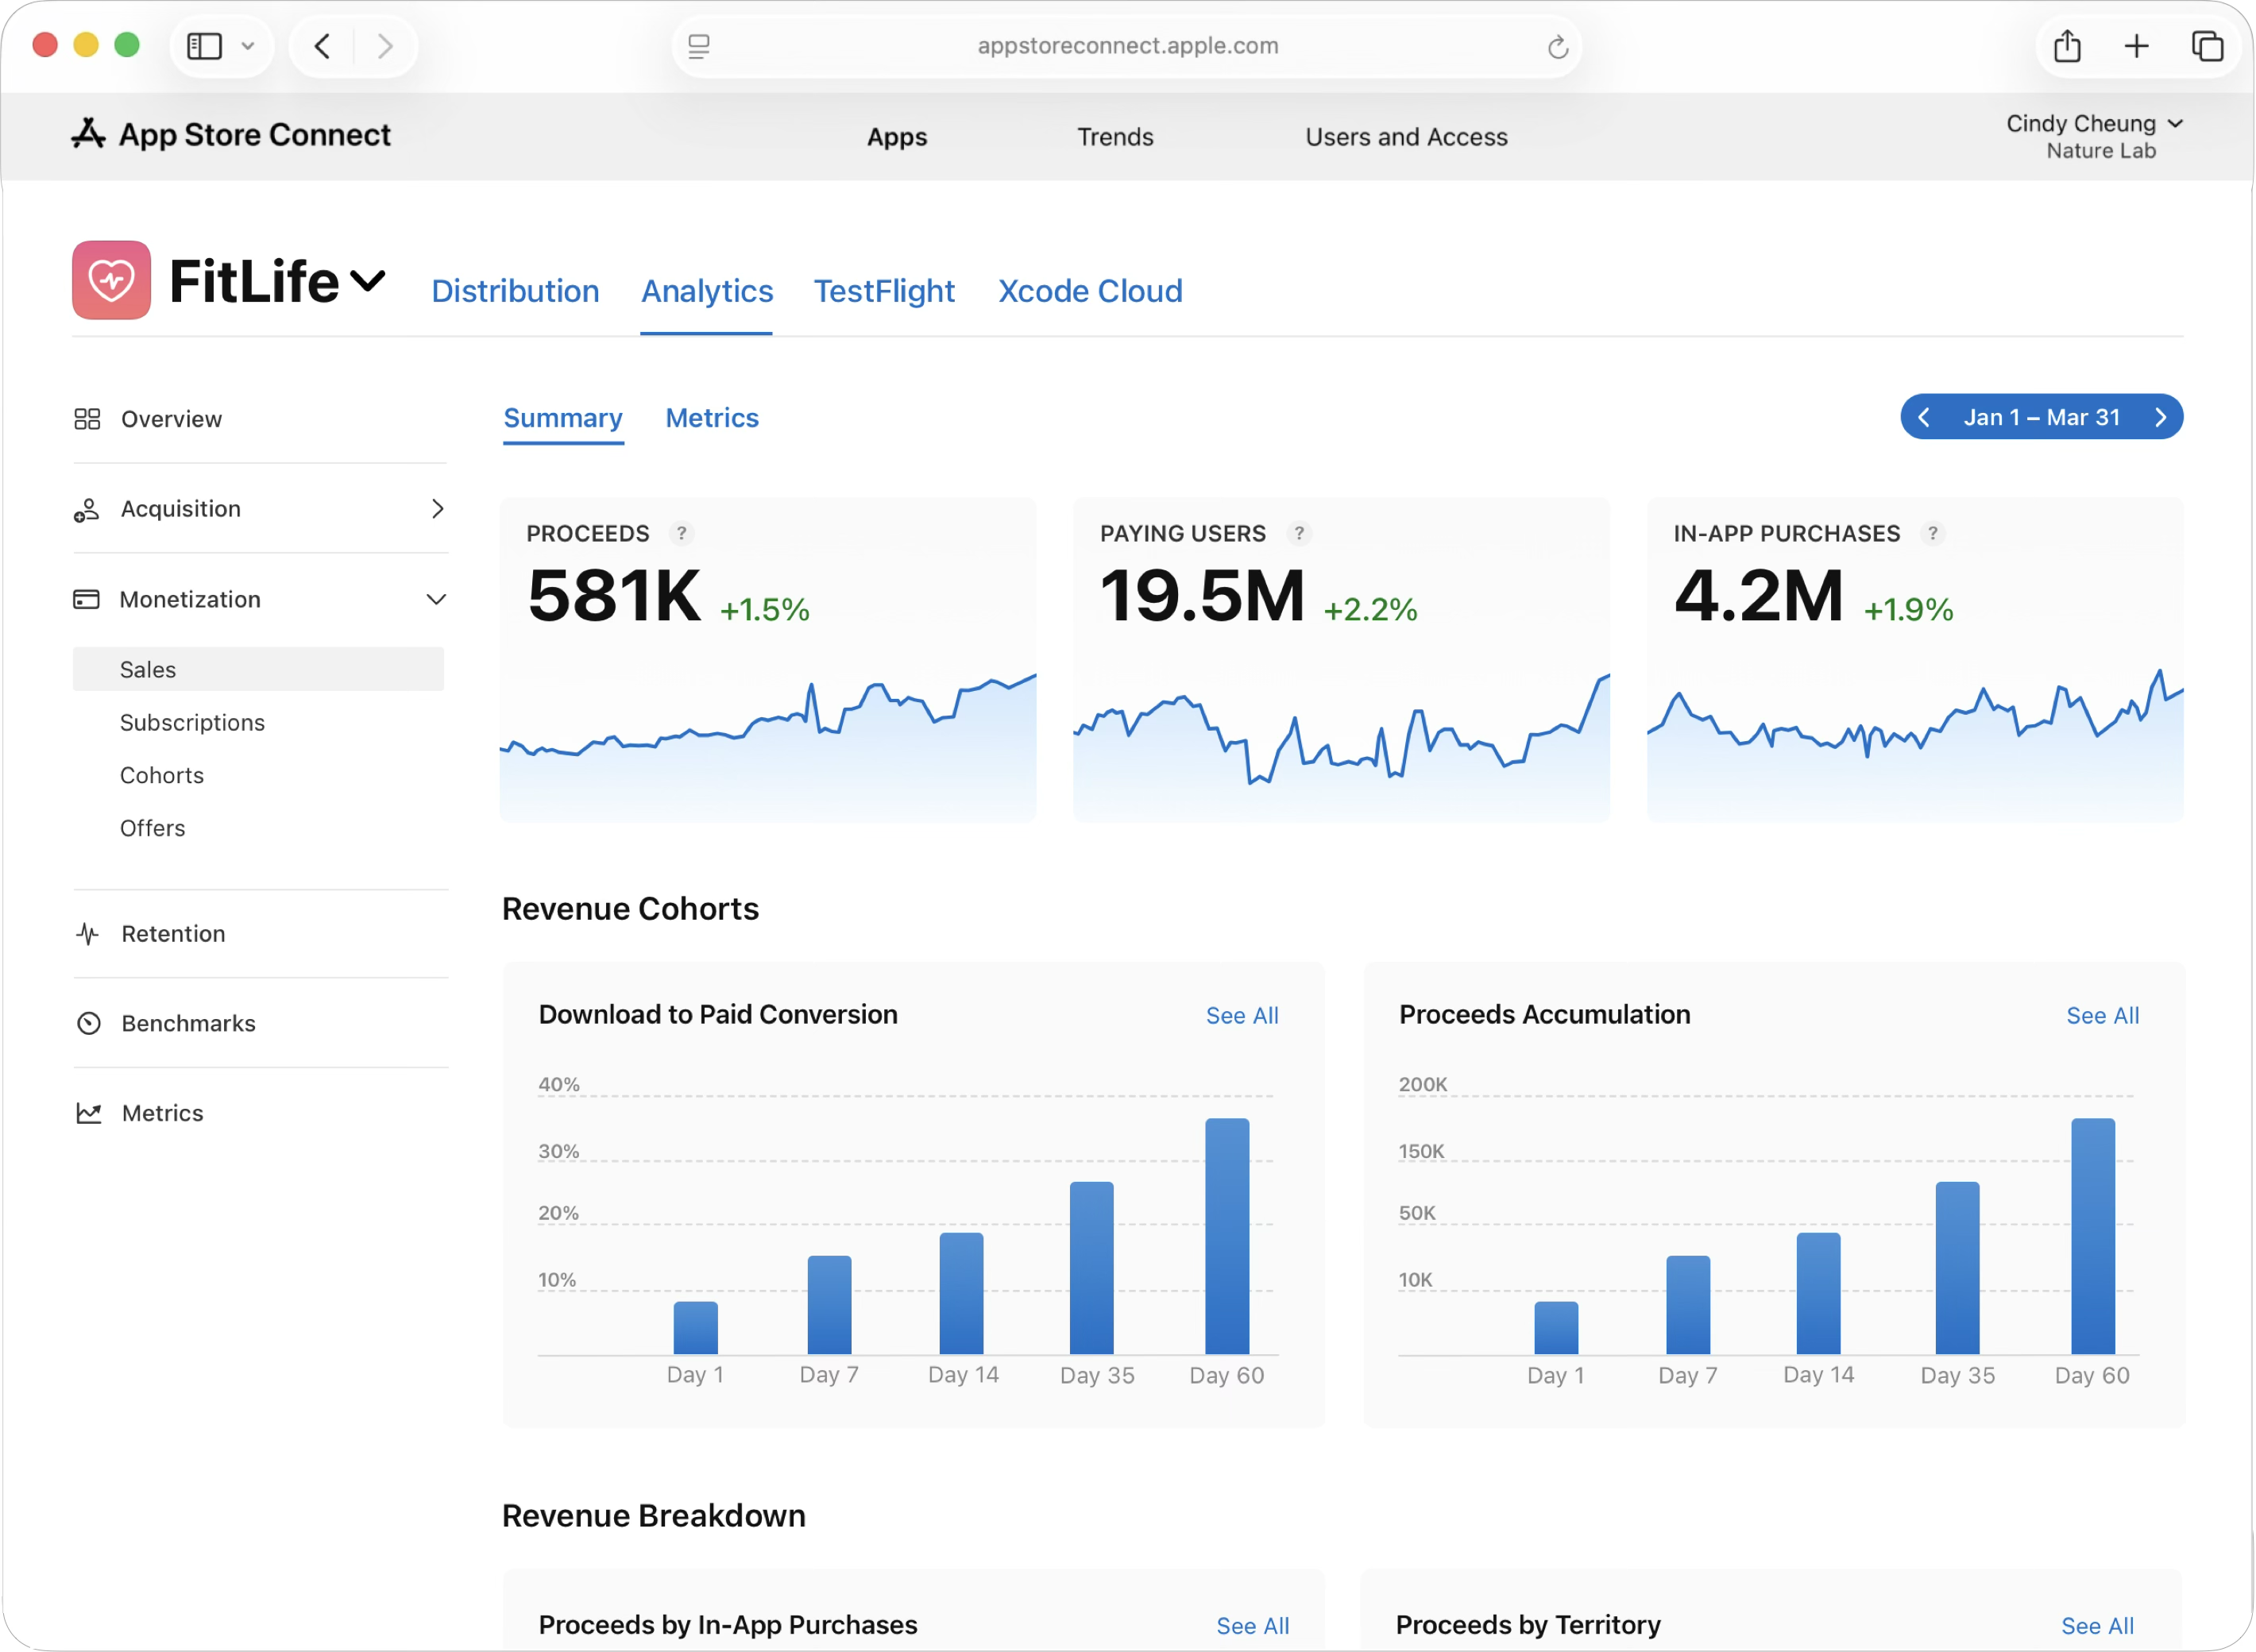
The Sales dashboard displays key performance metrics like Proceeds, Paying Users, and In-App Purchases. Below these, it presents Download to Paid Conversions, which shows the percentage of users that make a purchase 1, 7, 14, 35, and 40 days after downloading your app.
-
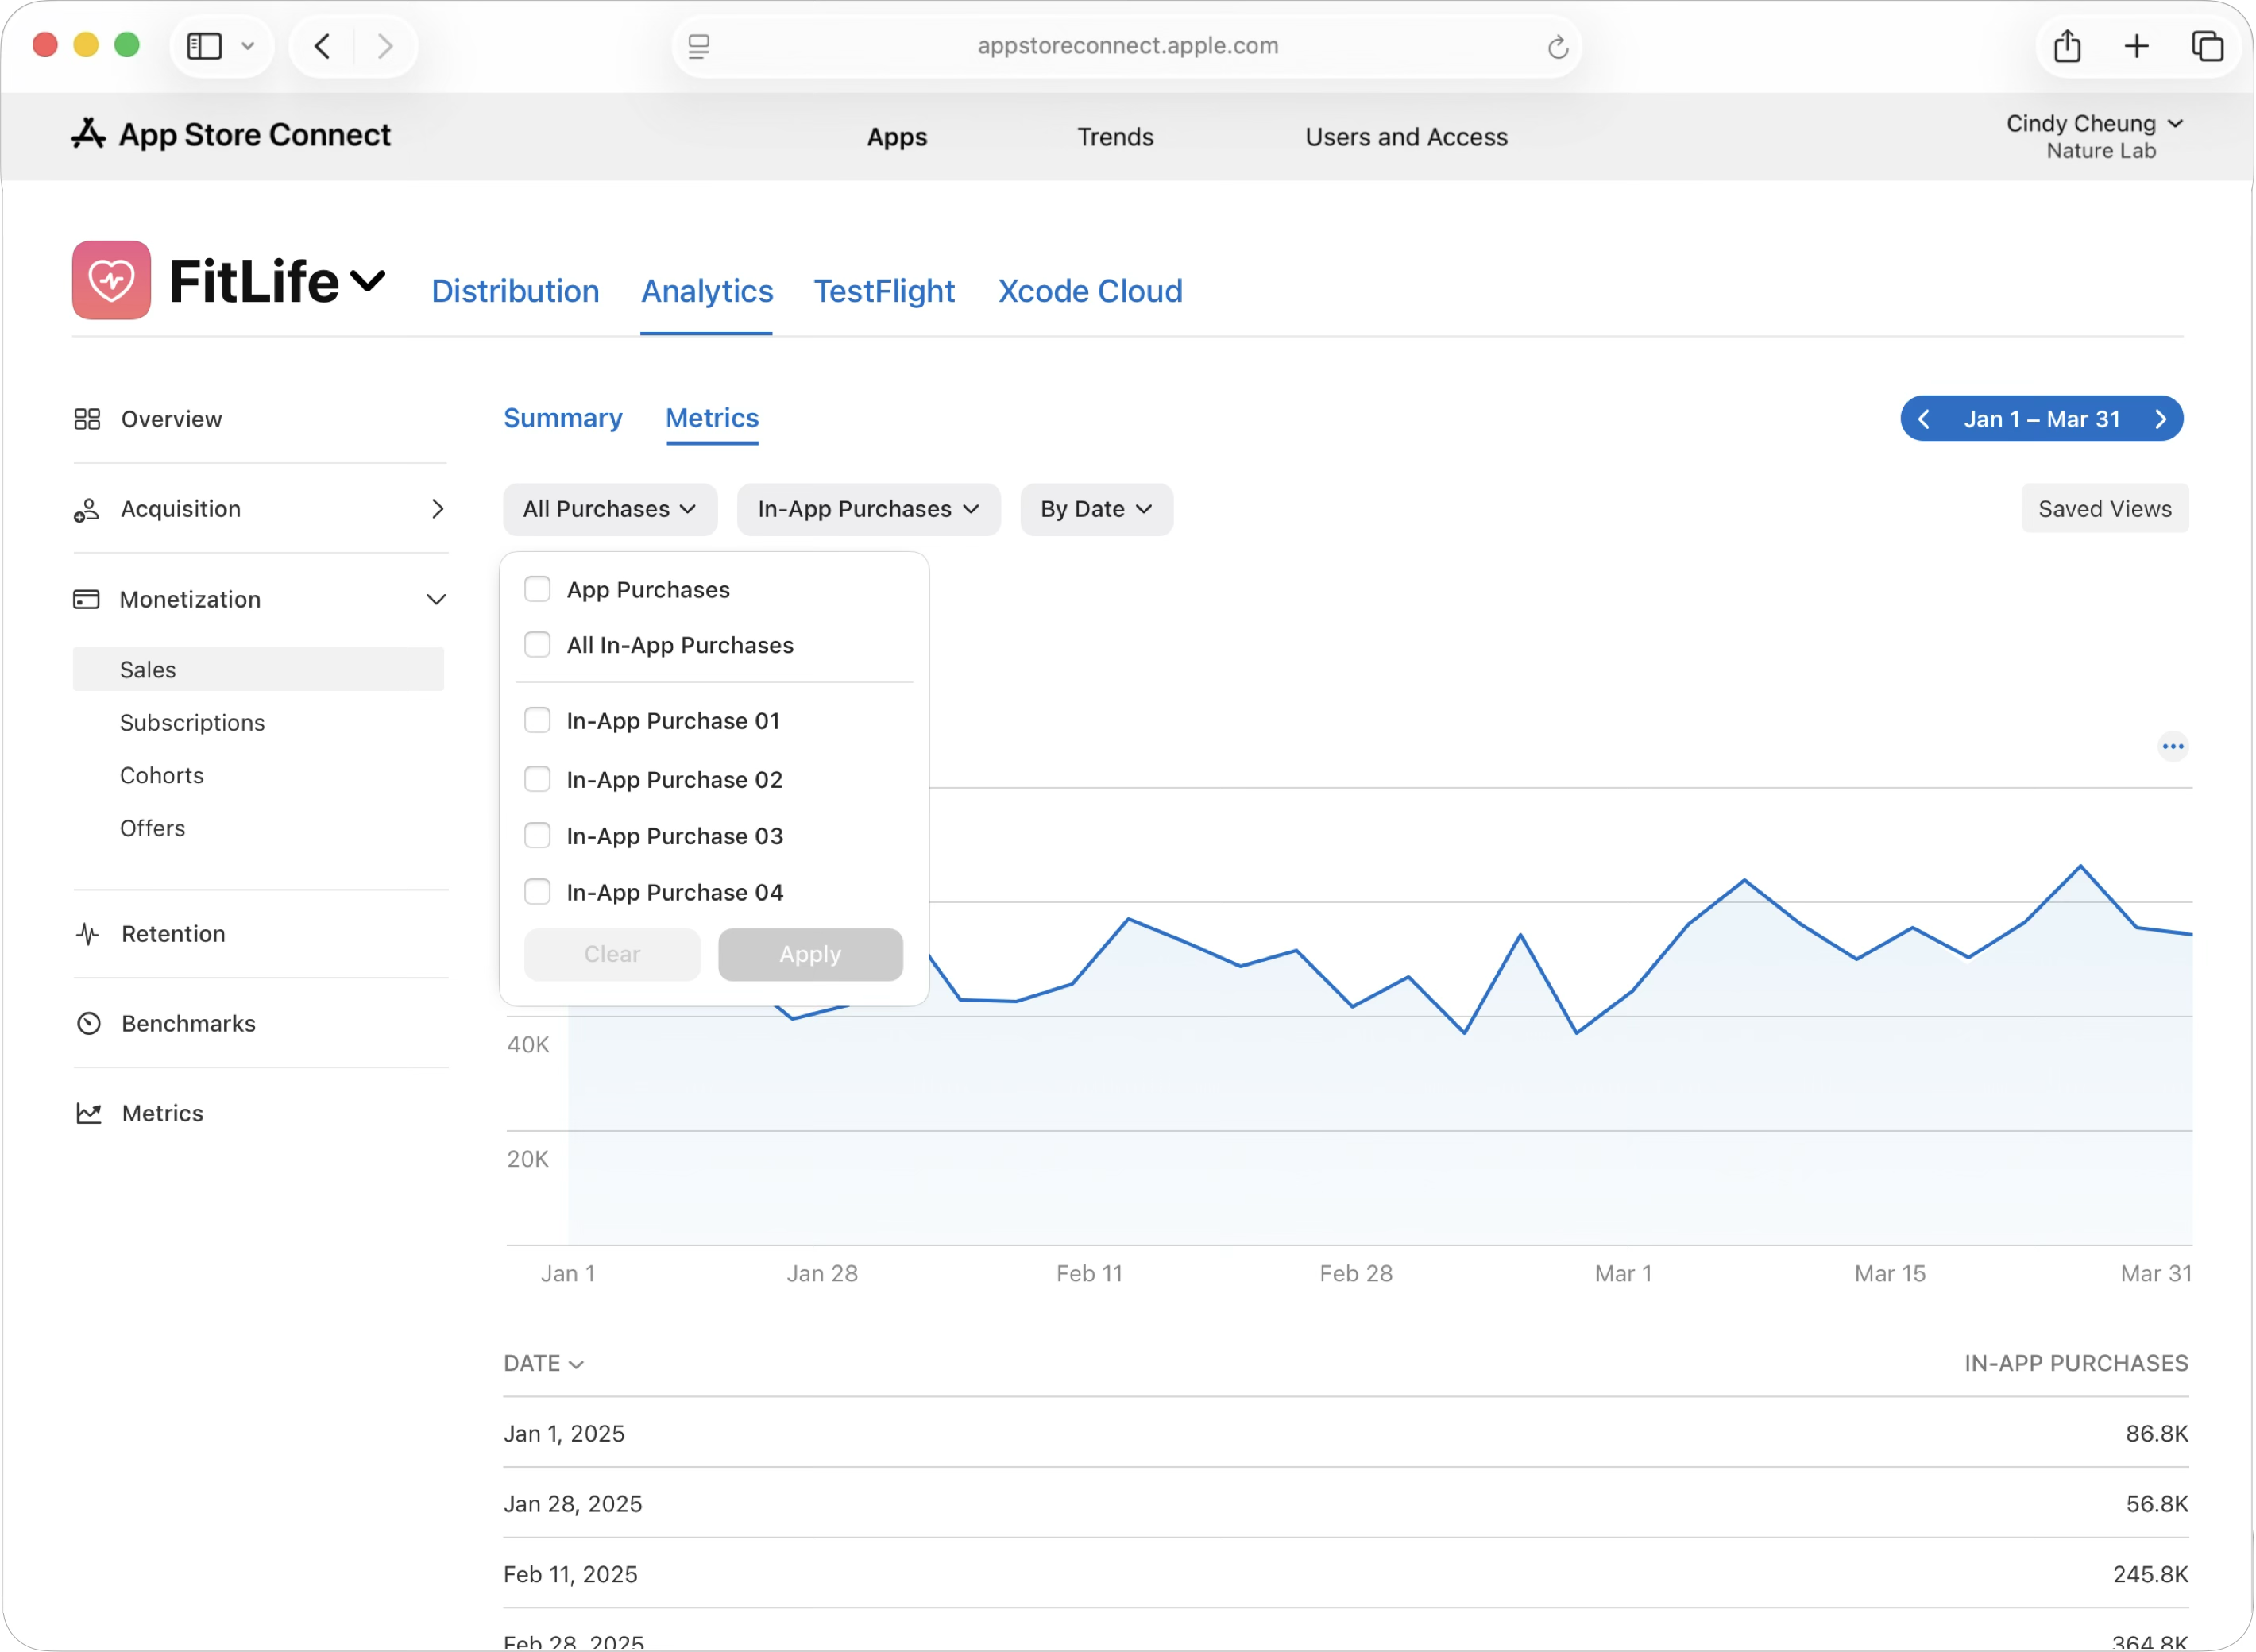
To perform deeper analysis, click the Metrics tab. Use the "All Purchases" filter to view data for specific In-App Purchase products.
-
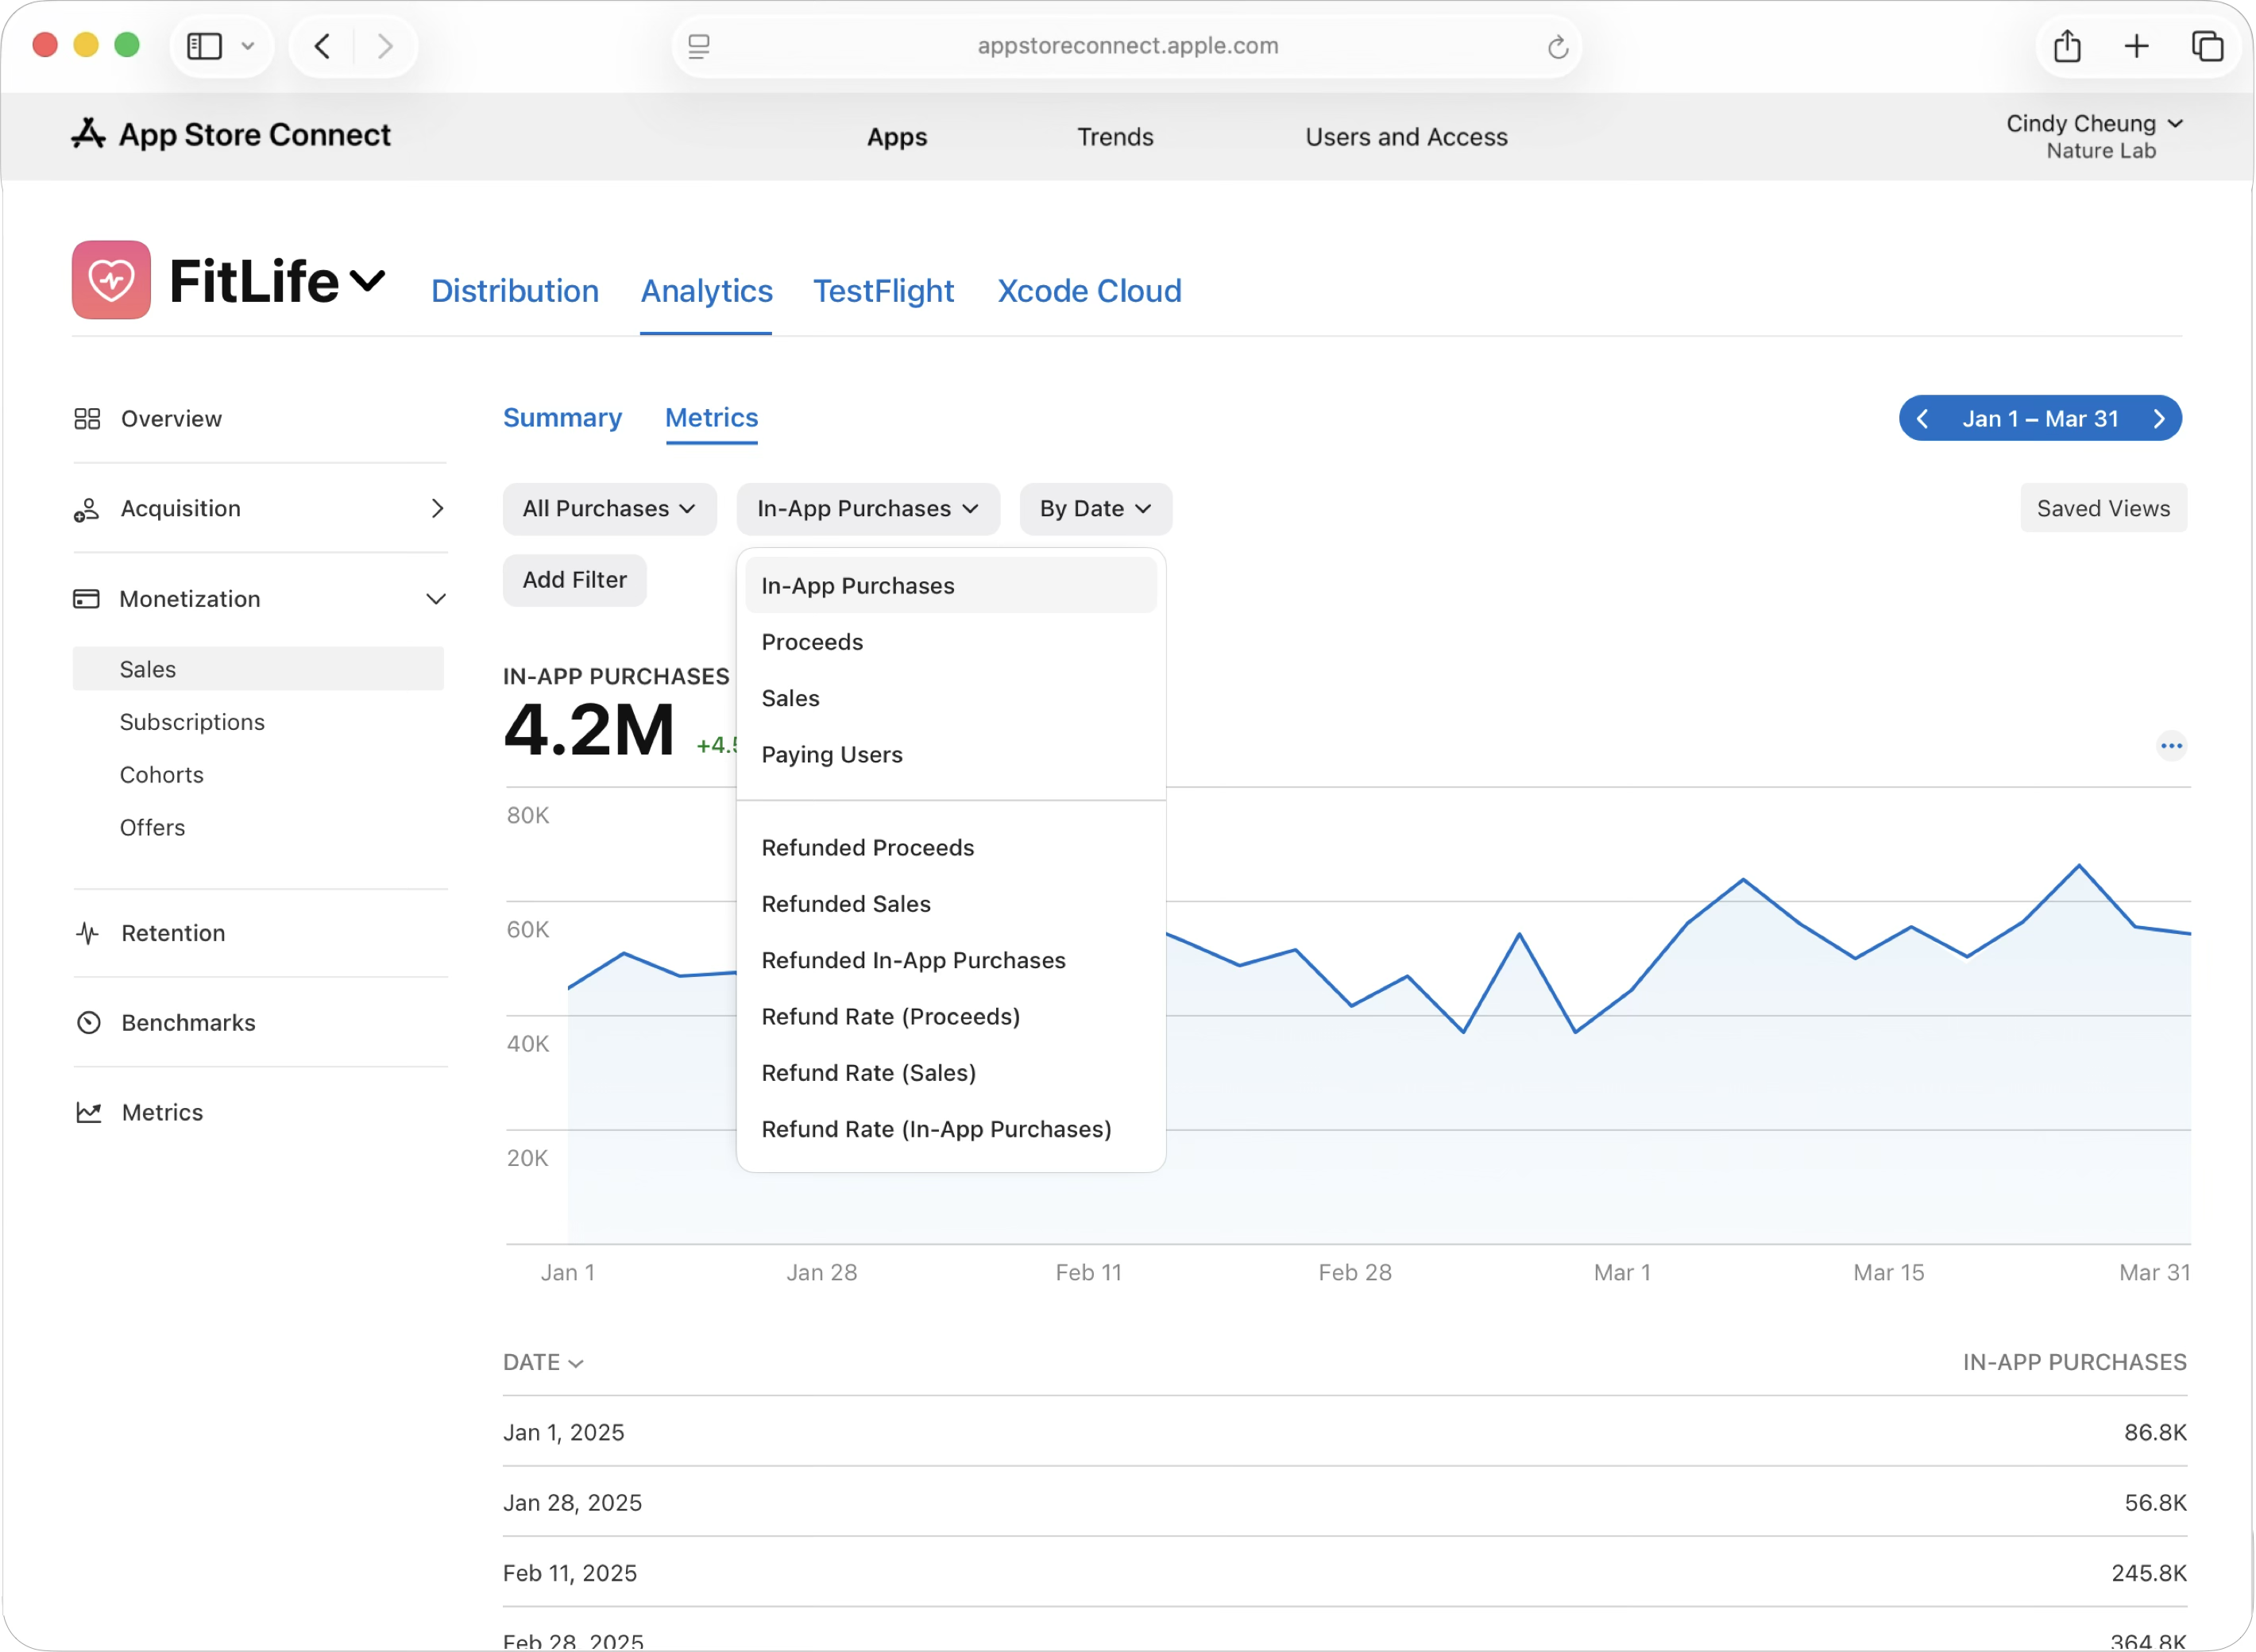
You can customize the data shown in the Analytics dashboard using the drop-downs at the top of the chart, which allow you to switch between different metrics like Proceeds, Sales, Paying Users, and refund data. You can also use the "By Date" filter to adjust time grouping. The chart and table will automatically update based on your selections, making it easy to analyze different aspects of your monetization performance from a single view.
Sales dashboard widgets
|
Widget |
Page |
Description |
|||||||||||||
|---|---|---|---|---|---|---|---|---|---|---|---|---|---|---|---|
|
Proceeds |
Summary Page |
The estimated amount of proceeds you'll receive from sales of your apps or In-App Purchases. Based on the price minus Apple's commission and applicable taxes. |
|||||||||||||
|
Paying Users |
Summary Page |
The number of unique users that paid for an app or In-App Purchase. |
|||||||||||||
|
In-App Purchases |
Summary Page |
The total number of In-App Purchases sold, includes consumables, non-consumables, non-renewing and auto-renewable subscriptions |
|||||||||||||
|
Download-to-Offer Rate Chart |
Revenue Cohorts |
The percentage of first-time downloads or redownloads that resulted in offer activations. |
|||||||||||||
|
Accumulated Proceeds |
Revenue Cohorts |
The average amount of proceeds generated per download during the specified time period. |
|||||||||||||
|
Proceeds by In-App Purchases |
Revenue Breakdown |
The estimated amount of proceeds the developer will receive from their sales, minus Apple’s commission. May not match final payout due to final exchange rates and transaction lifecycle. |
|||||||||||||
|
Proceeds by Territory |
Revenue Breakdown |
The estimated amount of proceeds the developer will receive from their sales, minus Apple’s commission. May not match final payout due to final exchange rates and transaction lifecycle. |
|||||||||||||