App Store Connect Analytics Help
Product Page Optimization
Product Page Optimization lets you test different versions of your App Store product page—including screenshots, app previews, descriptions, and app icons—to understand which elements drive higher conversion.
Analytics provides built-in statistical analysis for product page tests, helping you measure the impact of each variant and identify winning treatments using Bayesian techniques designed specifically for App Store product page data.
Tests appear in Analytics once at least five first-time downloads are attributed to the test. As impressions accumulate, Analytics evaluates performance and, when sufficient data is available, assigns a confidence level to each result. When a treatment reaches 90% confidence, it may be labeled as Performing Better or Performing Worse compared to the baseline. Tests that are unlikely to reach statistical significance based on current results may be marked as Likely to be Inconclusive.
Analyze test results in Analytics
Analytics includes a dedicated section for Product Page Optimization, where you can review the full testing funnel and compare performance across variants.
-
Test status: Learn whether each variant is Performing Better, Performing Worse, Collecting Data, or Likely to be Inconclusive.
-
Conversion rate: Review the estimated conversion rate for each variant, representing the percentage of viewers who download or pre-order your app.
-
Conversion lift: Understand the estimated relative improvement of each treatment compared to your baseline, helping you quantify the impact of specific creative changes.
-
Confidence levels: View statistical confidence for each result so you can make decisions grounded in reliable data. Test results with at least 90% confidence will show the Performing Better or Performing Worse labels.
Learn about configuring Product Page Optimization tests in App Store Connect.
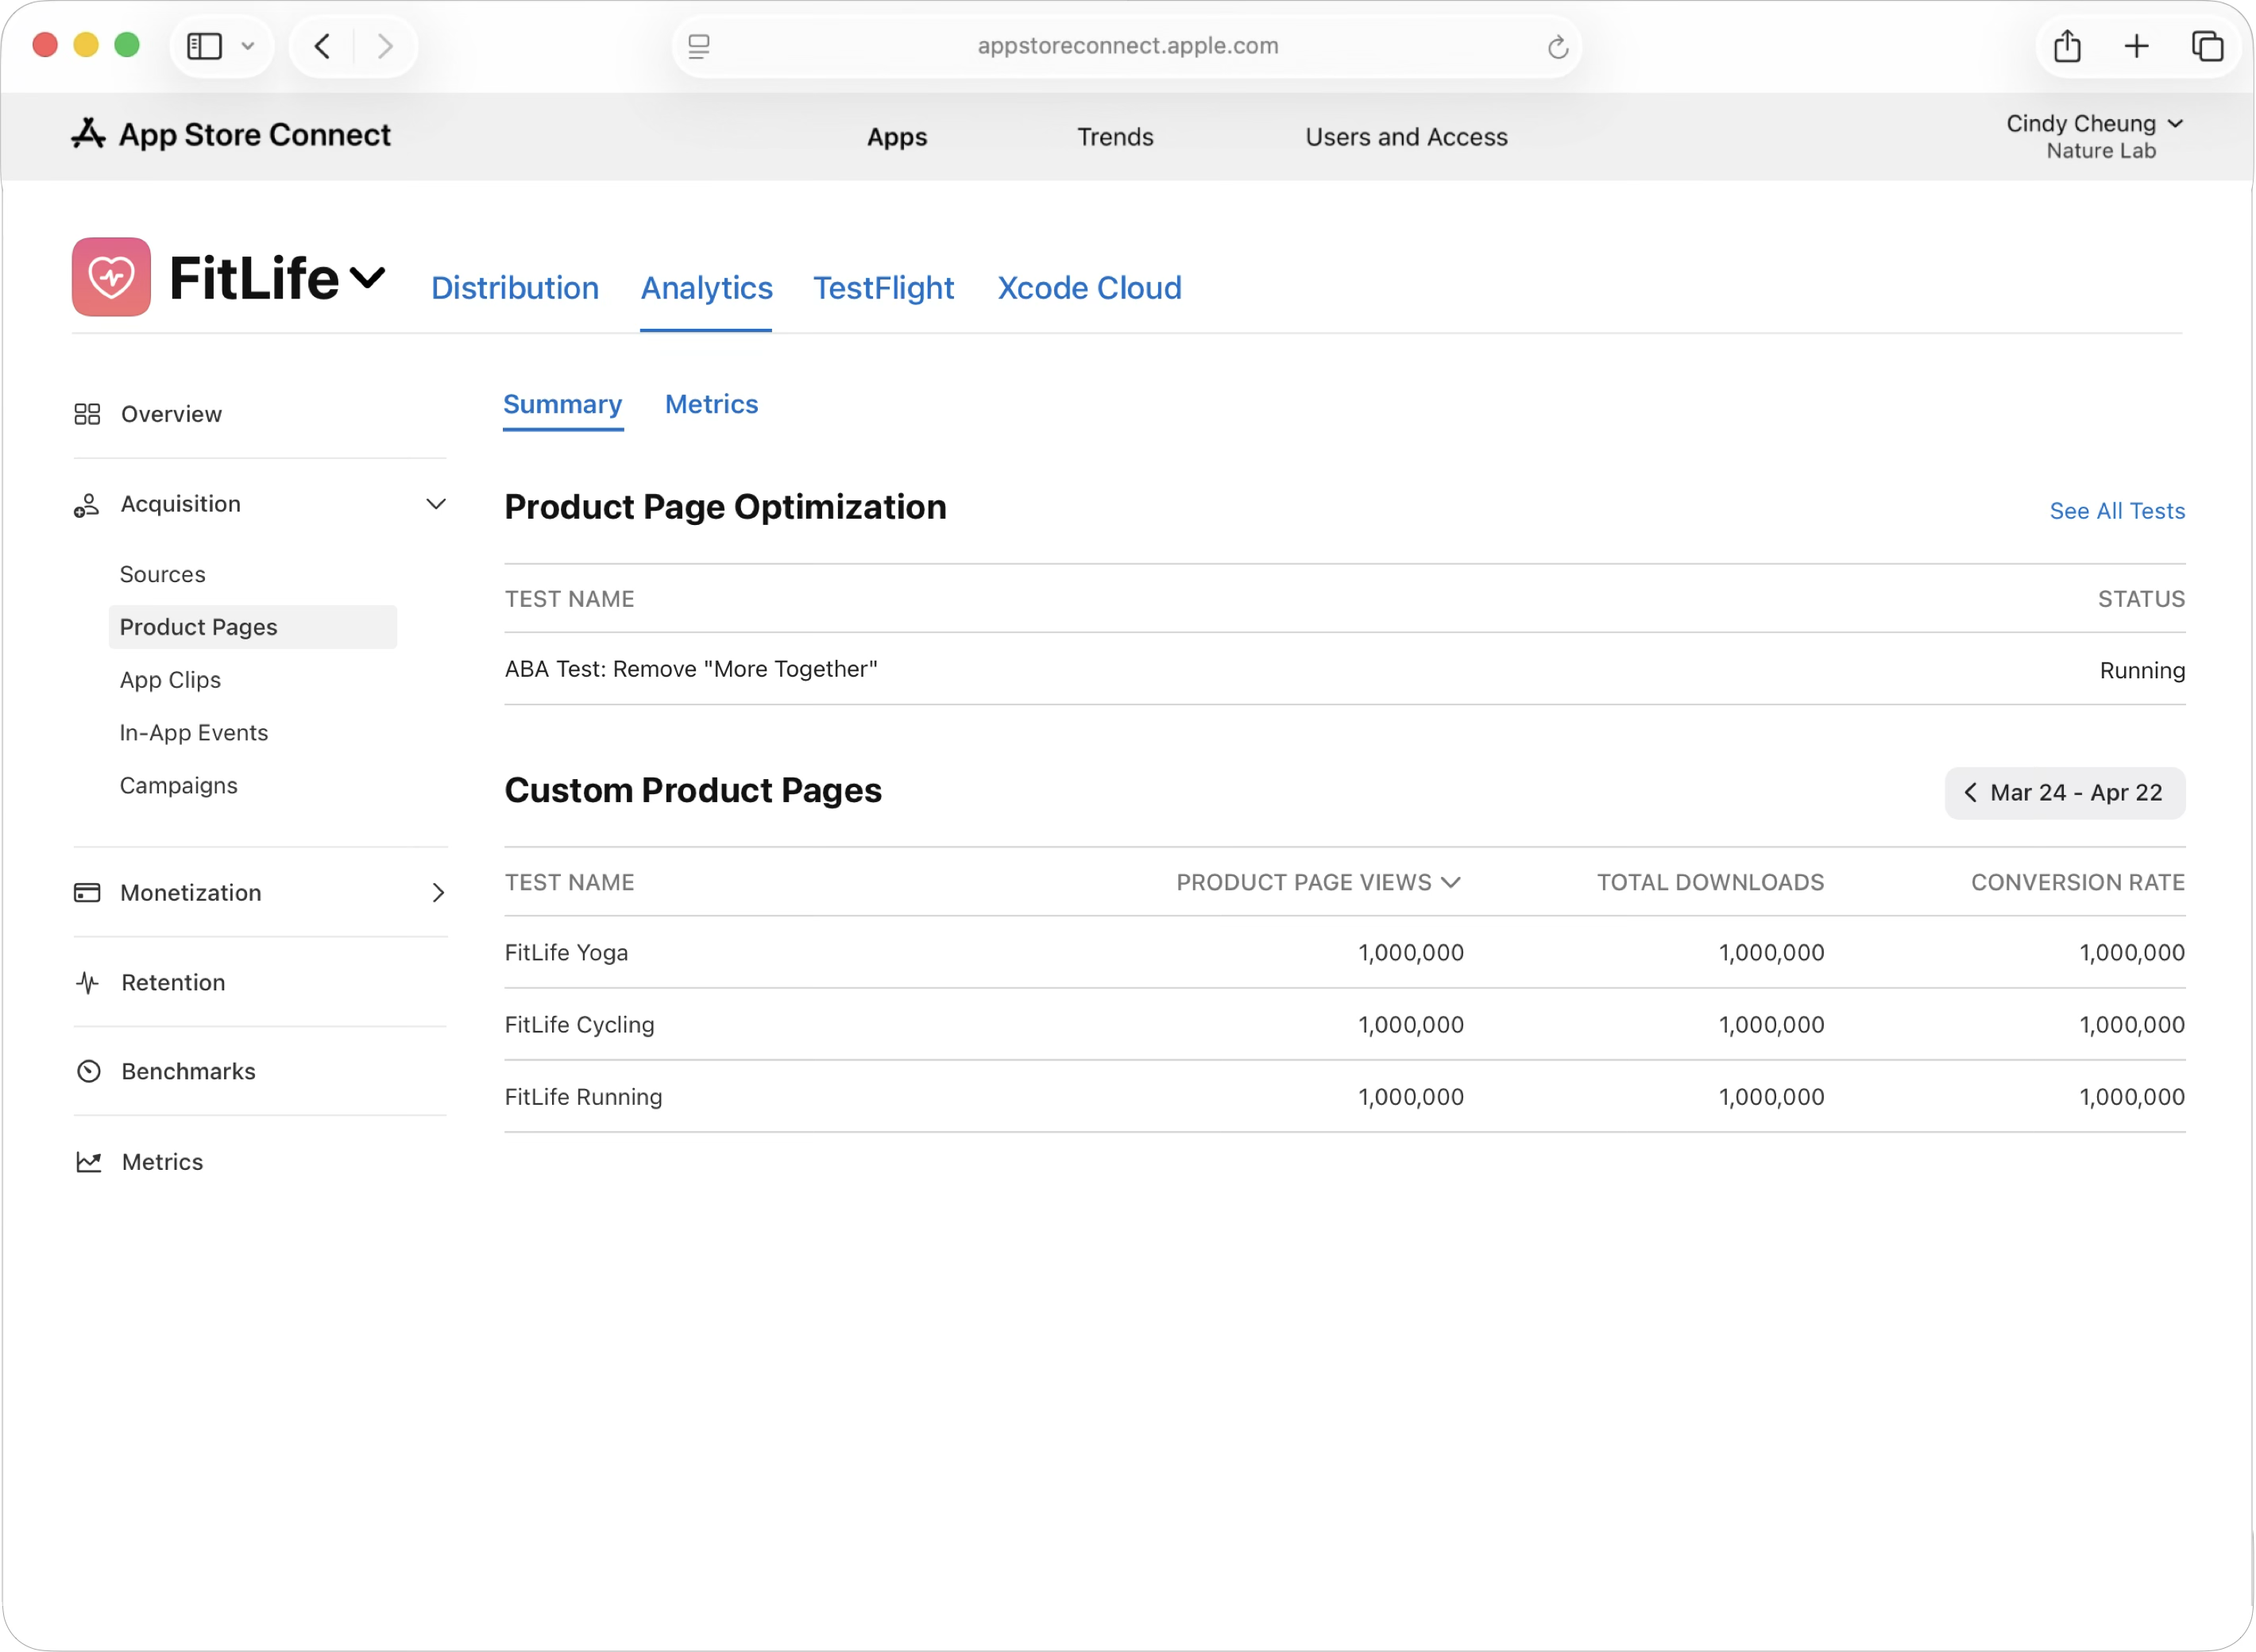
View Product Page Optimization test results
-
In Apps, select the app you want to view.
-
Click the Analytics tab.
-
In the sidebar under Acquisition, click Product Pages. The dashboard will display your most recent test in the Product Page Optimization section. Click the test name to access the available data for that test.
-
Once you open a completed test, you'll find an overview of how each variant performed. At the top of the page are conversion rate cards for your original product page (which serves as your baseline) and each treatment variant. These cards display the conversion rate for each variant, along with a performance status indicator showing the relative difference between the variant and the baseline. This helps you determine which variants outperformed or underperformed your baseline.
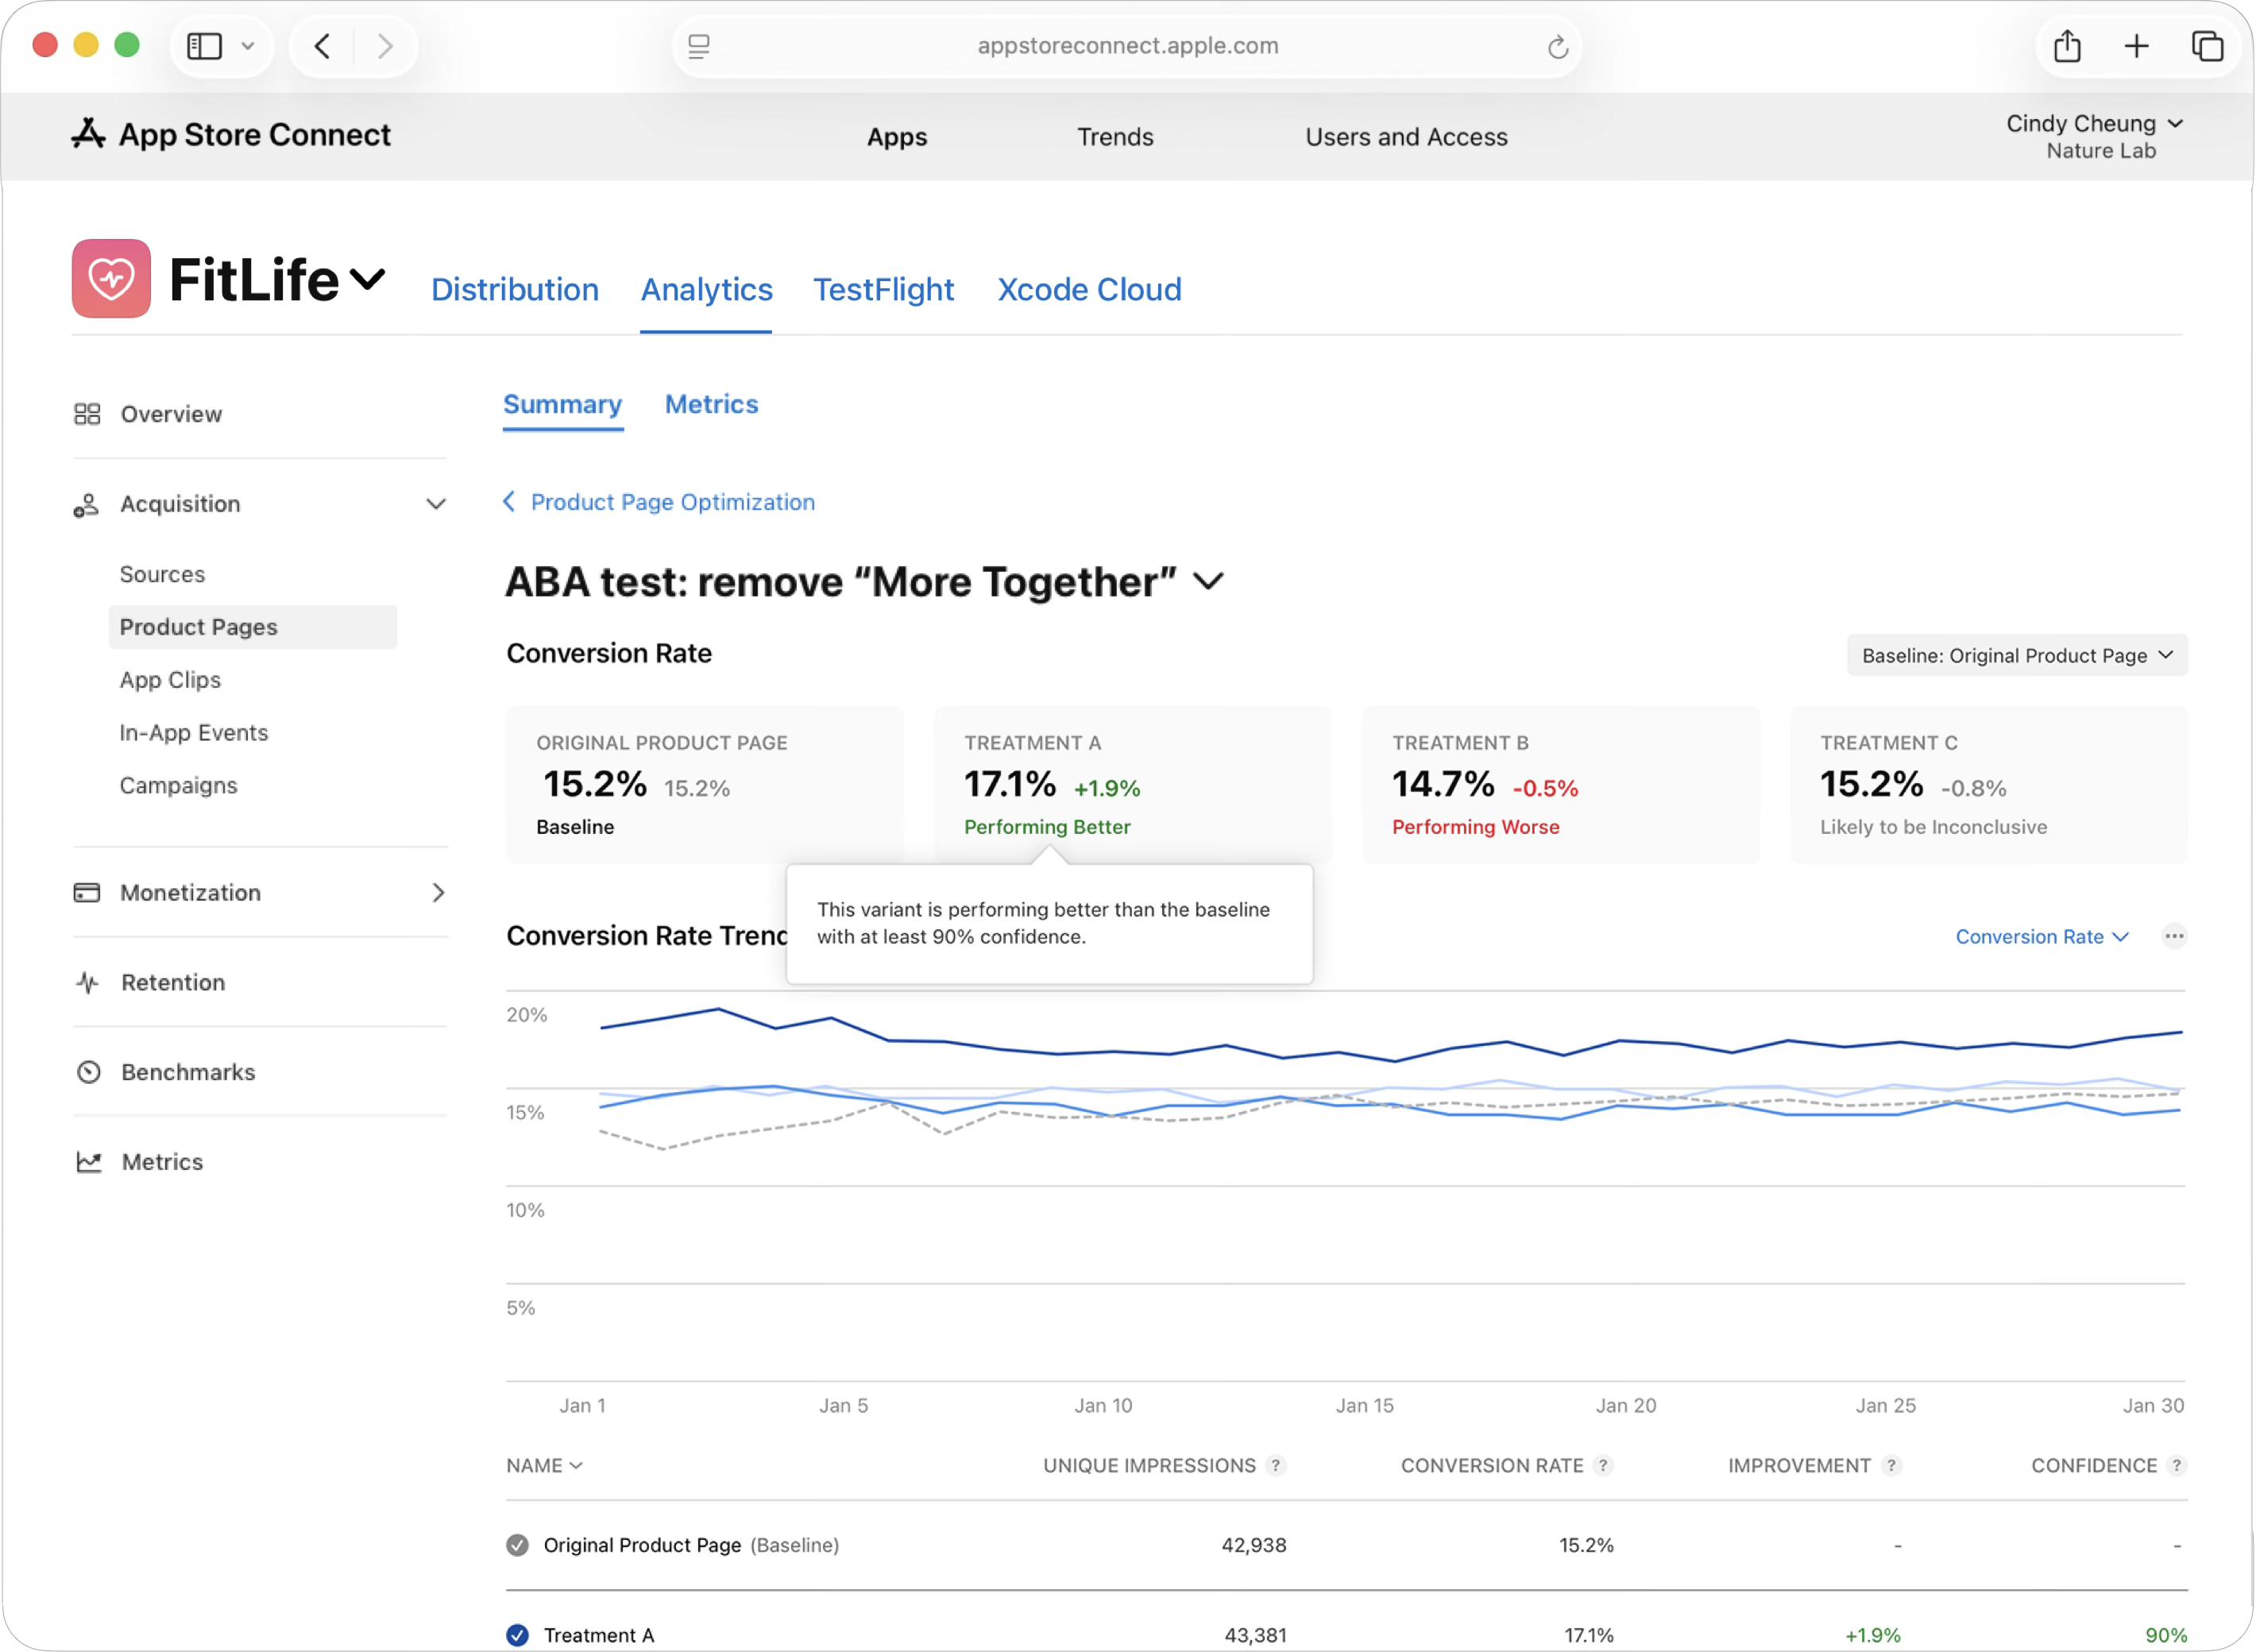
Below the conversion rate cards is an Improvement Trend graph that visualizes how each variant's performance has evolved throughout your test period. The baseline appears as a dotted line, making it easy to learn how treatments compare over time. You can toggle between the Improvement Percentage (showing relative lift) or the Conversion Rate (showing absolute conversion percentages) to get different perspectives on performance.
At the bottom of the page is a Results table that provides detailed metrics for each variant. The table includes the variant Name, Unique Impressions (the number of unique devices that viewed each variant), Conversion Rate (the percentage of viewers who downloaded your app), Improvement (the percentage lift compared to your baseline), and Confidence (the statistical confidence level in the results, with 90%+ indicating reliable data). This table allows you to compare all variants side-by-side and identify which performed best based on multiple data points. Learn about applying test treatments to your product page.
To find a list of all your current and previous tests:
-
In Apps, select the app you want to view.
-
Click the Analytics tab.
-
In the sidebar under Acquisition, click Product Pages.
-
From this page, click “See All Tests.”
The dashboard will display all of your tests, including your historical tests.
Product Page Optimization metrics and definitions
|
Metric |
Definition |
||||||||||
|---|---|---|---|---|---|---|---|---|---|---|---|
|
Product Page |
A page on the App Store that informs people about your app and lets them download it onto their device. |
||||||||||
|
Test |
An experiment in which different treatments of your product page are shown to a percentage of users so their performance can be compared to the performance of your original product page during the same timeframe. |
||||||||||
|
Variant |
An instance of your product page (either the original or a treatment). |
||||||||||
|
Treatment |
A variant of your product page that’s compared to your original product page. |
||||||||||
|
Original |
Your default product page, which serves as the control for your test. |
||||||||||
|
Referral Traffic |
Visits to any variant of your product page from a direct URL. |
||||||||||
|
Apply Treatment |
The action of replacing the metadata on your original product page with the metadata from one of your treatments. |
||||||||||
|
Confidence Level |
The probability that the data gathered in a test suggests that two variants are performing differently. |
||||||||||
|
Baseline |
The variant that the other pages are being compared against. |
||||||||||
|
Collecting Data |
Data is still being collected to determine whether this variant is performing better than the baseline. |
||||||||||
|
Performing Better |
This variant is performing better than the baseline with at least 90% confidence. |
||||||||||
|
Performing Worse |
This variant is performing worse than the baseline with at least 90% confidence. |
||||||||||
|
Likely to be Inconclusive |
Based on the current results, there likely won’t be enough data after 90 days to determine how this variant is performing compared to the baseline. |
||||||||||
|
Estimated Conversion Rate |
The estimated percentage of people that downloaded or pre-ordered your app from a certain product page variant. This estimate incorporates the data observed during the test, as well as existing data. |
||||||||||
|
Estimated Relative Lift |
The estimated relative increase in conversion rate for a variant as compared to the selected baseline. It requires fewer weeks of data to determine significance on higher improvement values (e.g. 30%) as opposed to lower improvement values (e.g. 5%). Your actual test duration will depend on the level of improvement detected during your specific test. |
||||||||||
|
Bayesian Reasoning |
A statistical method where probability expresses a degree of confidence in an event; used to justify confidence in your conversion rate lift. |
||||||||||
|
Credible Interval |
The probable range of your lift or conversion rate. This represents a 90% interval, meaning there’s a 90% probability that the conversion rate or lift falls within this range. |
||||||||||
Why hasn't my test started showing results yet?
Test results appear in Analytics only after there are at least five first-time downloads associated with the test. If your app has lower traffic, it may take longer to accumulate sufficient data. Once you reach five downloads, results will begin appearing and will update daily.
What does "Likely to be Inconclusive" mean, and what should I do?
This status indicates that based on current traffic patterns, your test may not gather enough data within 90 days to reach 90% confidence. If you find this, consider: (1) extending your test beyond 90 days if possible, (2) testing a more dramatic change that may show larger lift, or (3) running the test again during a period of higher traffic.
How long should I run my test before making a decision?
Tests require at least 90% confidence to mark a variant as Performing Better or Performing Worse. The time this takes depends on your traffic volume and the magnitude of improvement. Larger improvements (e.g., 30% lift) require fewer weeks of data than smaller improvements (e.g., 1% lift). Don't end tests early—allow them to run until you reach statistical significance.
Can I run multiple tests simultaneously on different elements?
Yes. You can test different product page elements (screenshots, description, preview video, etc.) in separate tests at the same time. However, avoid testing overlapping elements simultaneously, as this can make it difficult to isolate which change drove results.
What's the difference between Conversion Rate and Estimated Relative Lift?
Conversion Rate shows the absolute percentage of viewers who download your app from each variant (e.g., 4.5%). Estimated Relative Lift shows the percentage improvement of a treatment compared to your baseline (e.g., +12% lift). Use Conversion Rate to understand absolute performance; use Lift to compare variants directly.
Can I change my baseline after I've already started a test?
Yes. You can change your baseline at any time to any of your available treatments. This is useful once a treatment performs better—you can set it as the new baseline and test the next element against this improved version. All comparisons will recalculate against your new baseline.
Should I apply a treatment to my live product page immediately after it shows "Performing Better"?
Yes. Once a treatment reaches 90% confidence and is marked as Performing Better, you should apply it to your live product page. This locks in the conversion improvement and allows you to test the next element against this new winning version, compounding your gains over time.
What does the Credible Interval represent, and why does it matter?
The Credible Interval is the probable range of your conversion rate or lift—a 90% probability that the true value falls within this range. A narrow interval indicates high confidence in your results; a wide interval suggests more uncertainty. Use this to understand the precision of your estimates.
How does Bayesian reasoning affect my test results?
Apple uses Bayesian statistical methods to incorporate prior information about your app's product page performance. This helps ensure there's enough data to report on differences between variants and allows results to update daily with confidence. This methodology is specifically designed for App Store product page data.