App Store Connect Analytics Help
Cohorts
Cohorts allow you to group users based on shared characteristics, such as when they downloaded your app or when they started paying for a subscription. Cohort metrics let you measure user behavior over time, giving you clear insights into user progression.
There are two types of cohorts available in App Analytics:
-
Download cohort: Users who downloaded your app on a specific day or month.
-
Subscription cohort: Users who subscribed to a plan on a specific day or month.
You can use the Cohorts section in the Analytics dashboard to analyze the following cohort metrics:
-
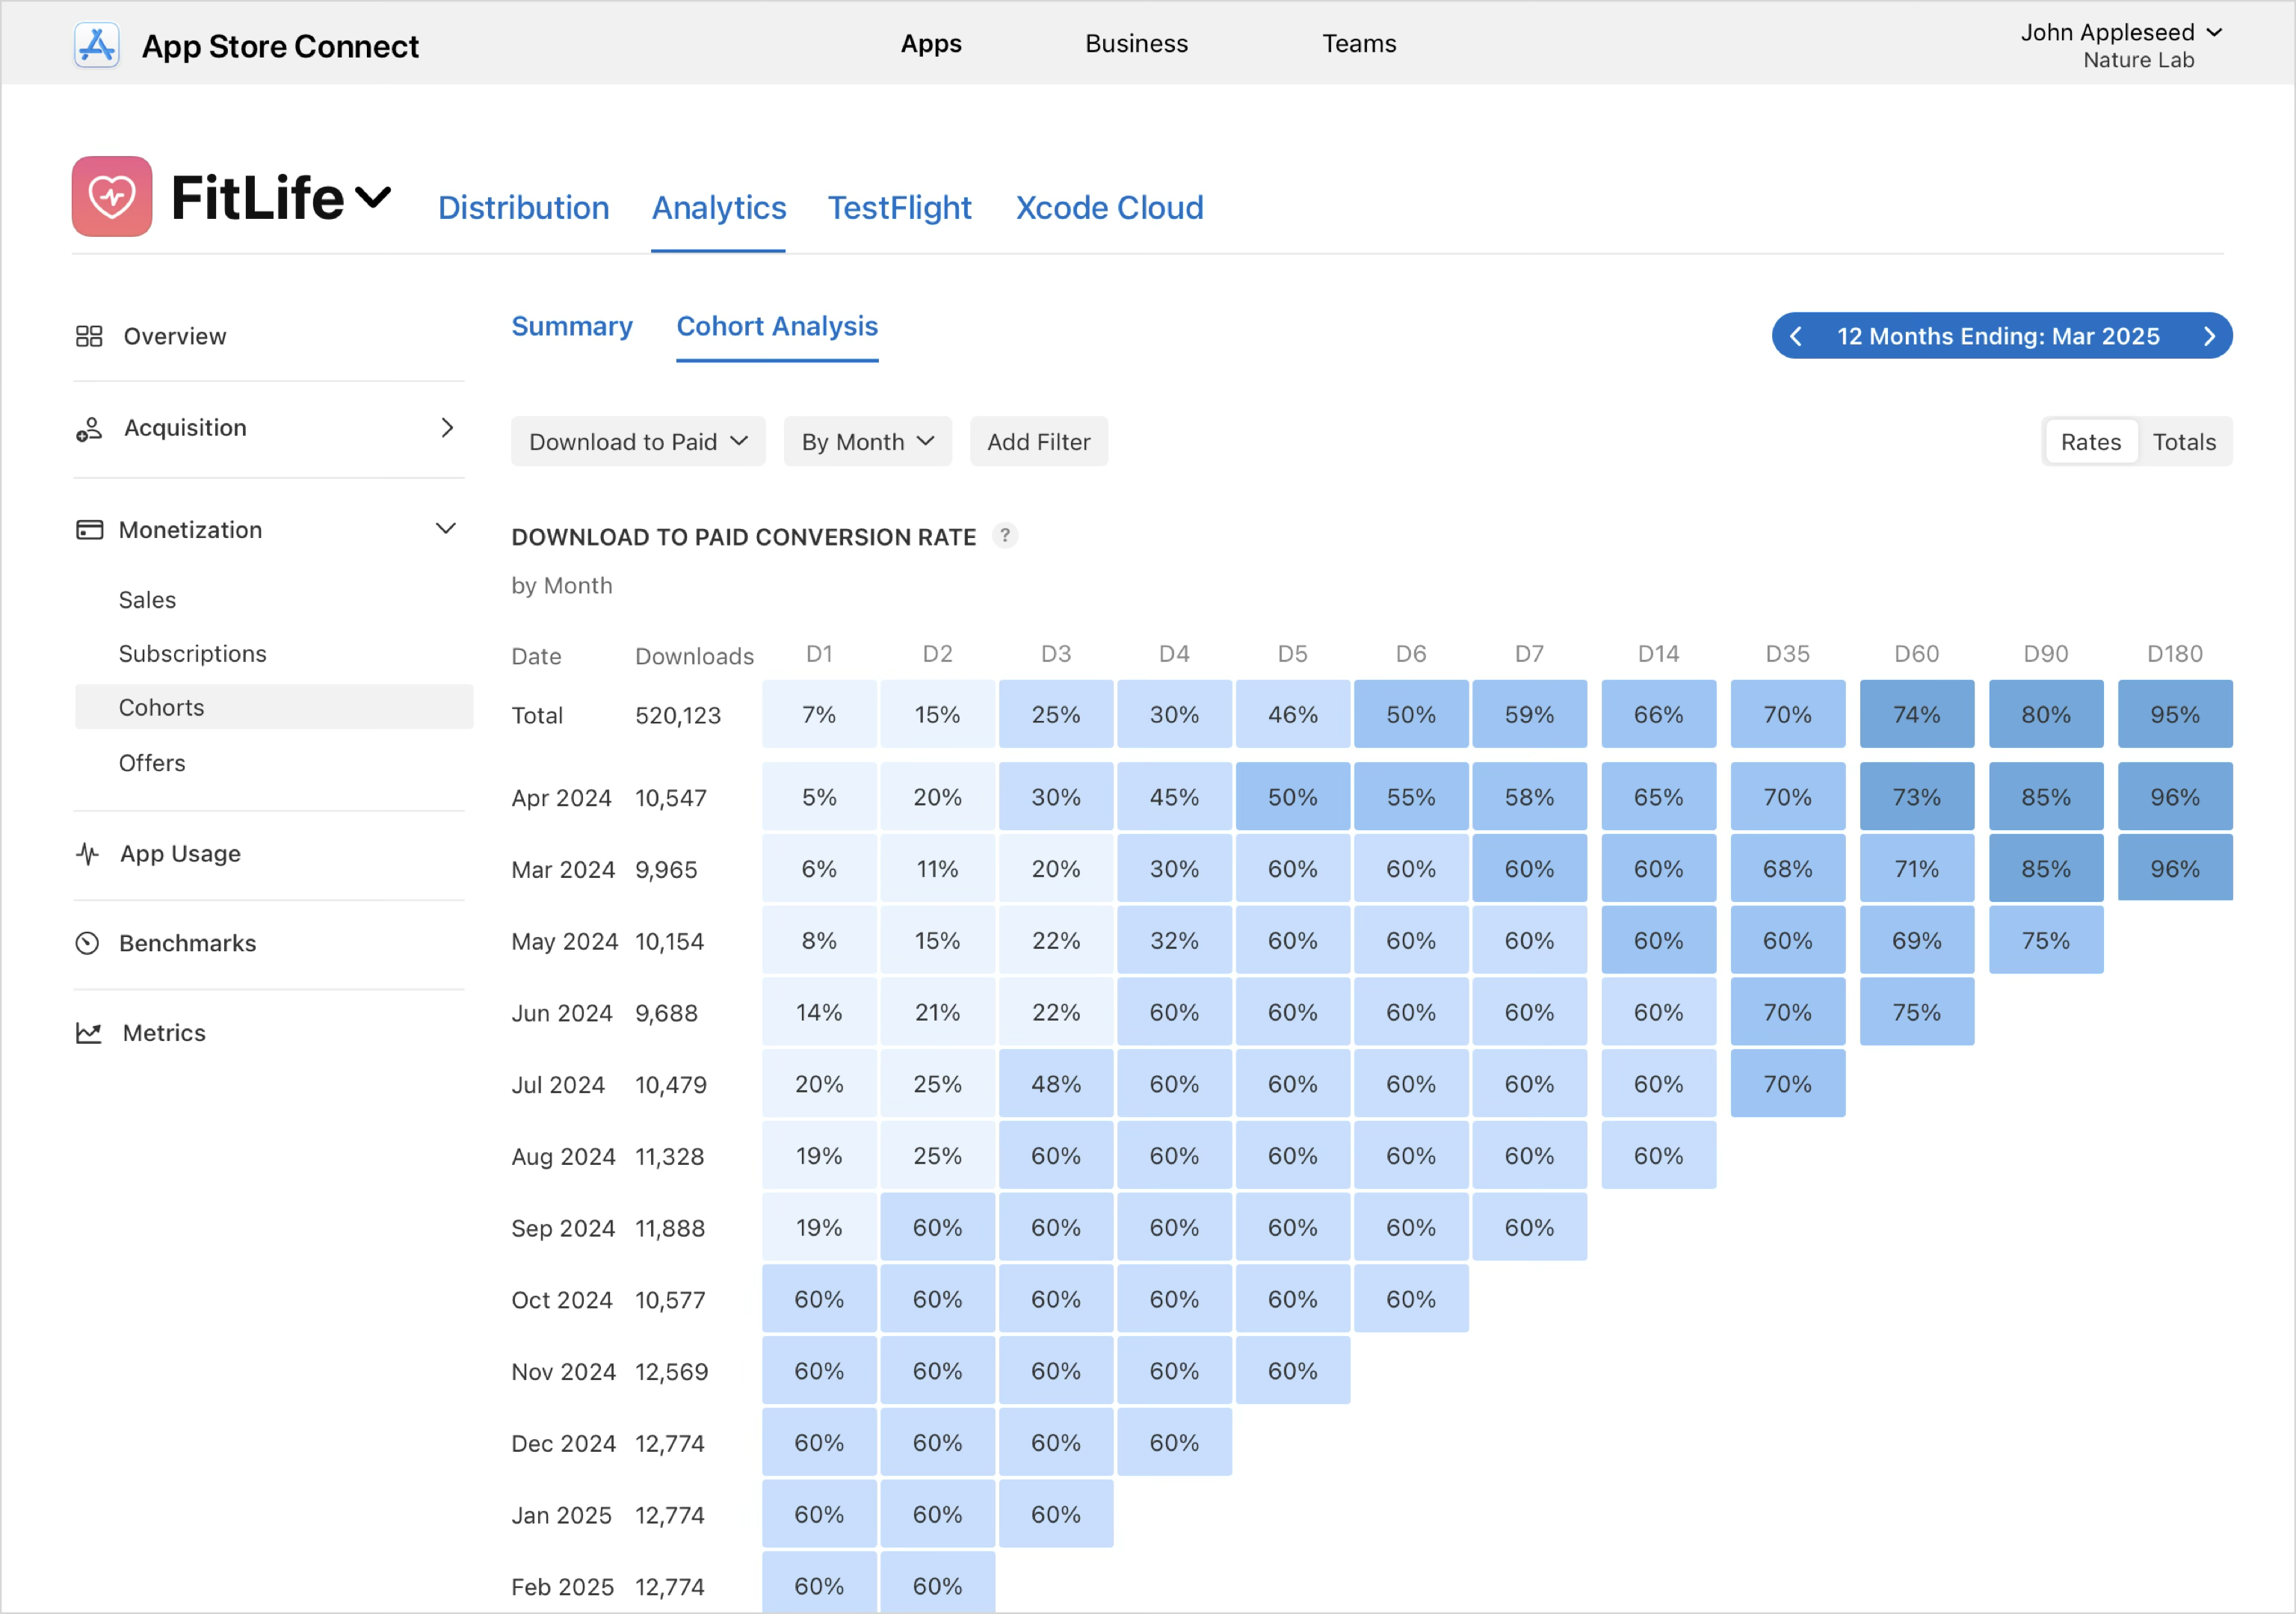
Download to Paid: The percentage of first-time downloads or redownloads that is followed by an In-App Purchase within a certain timeframe.
-
Proceeds per Download: The average amount of proceeds generated within a certain number of days of download.
-
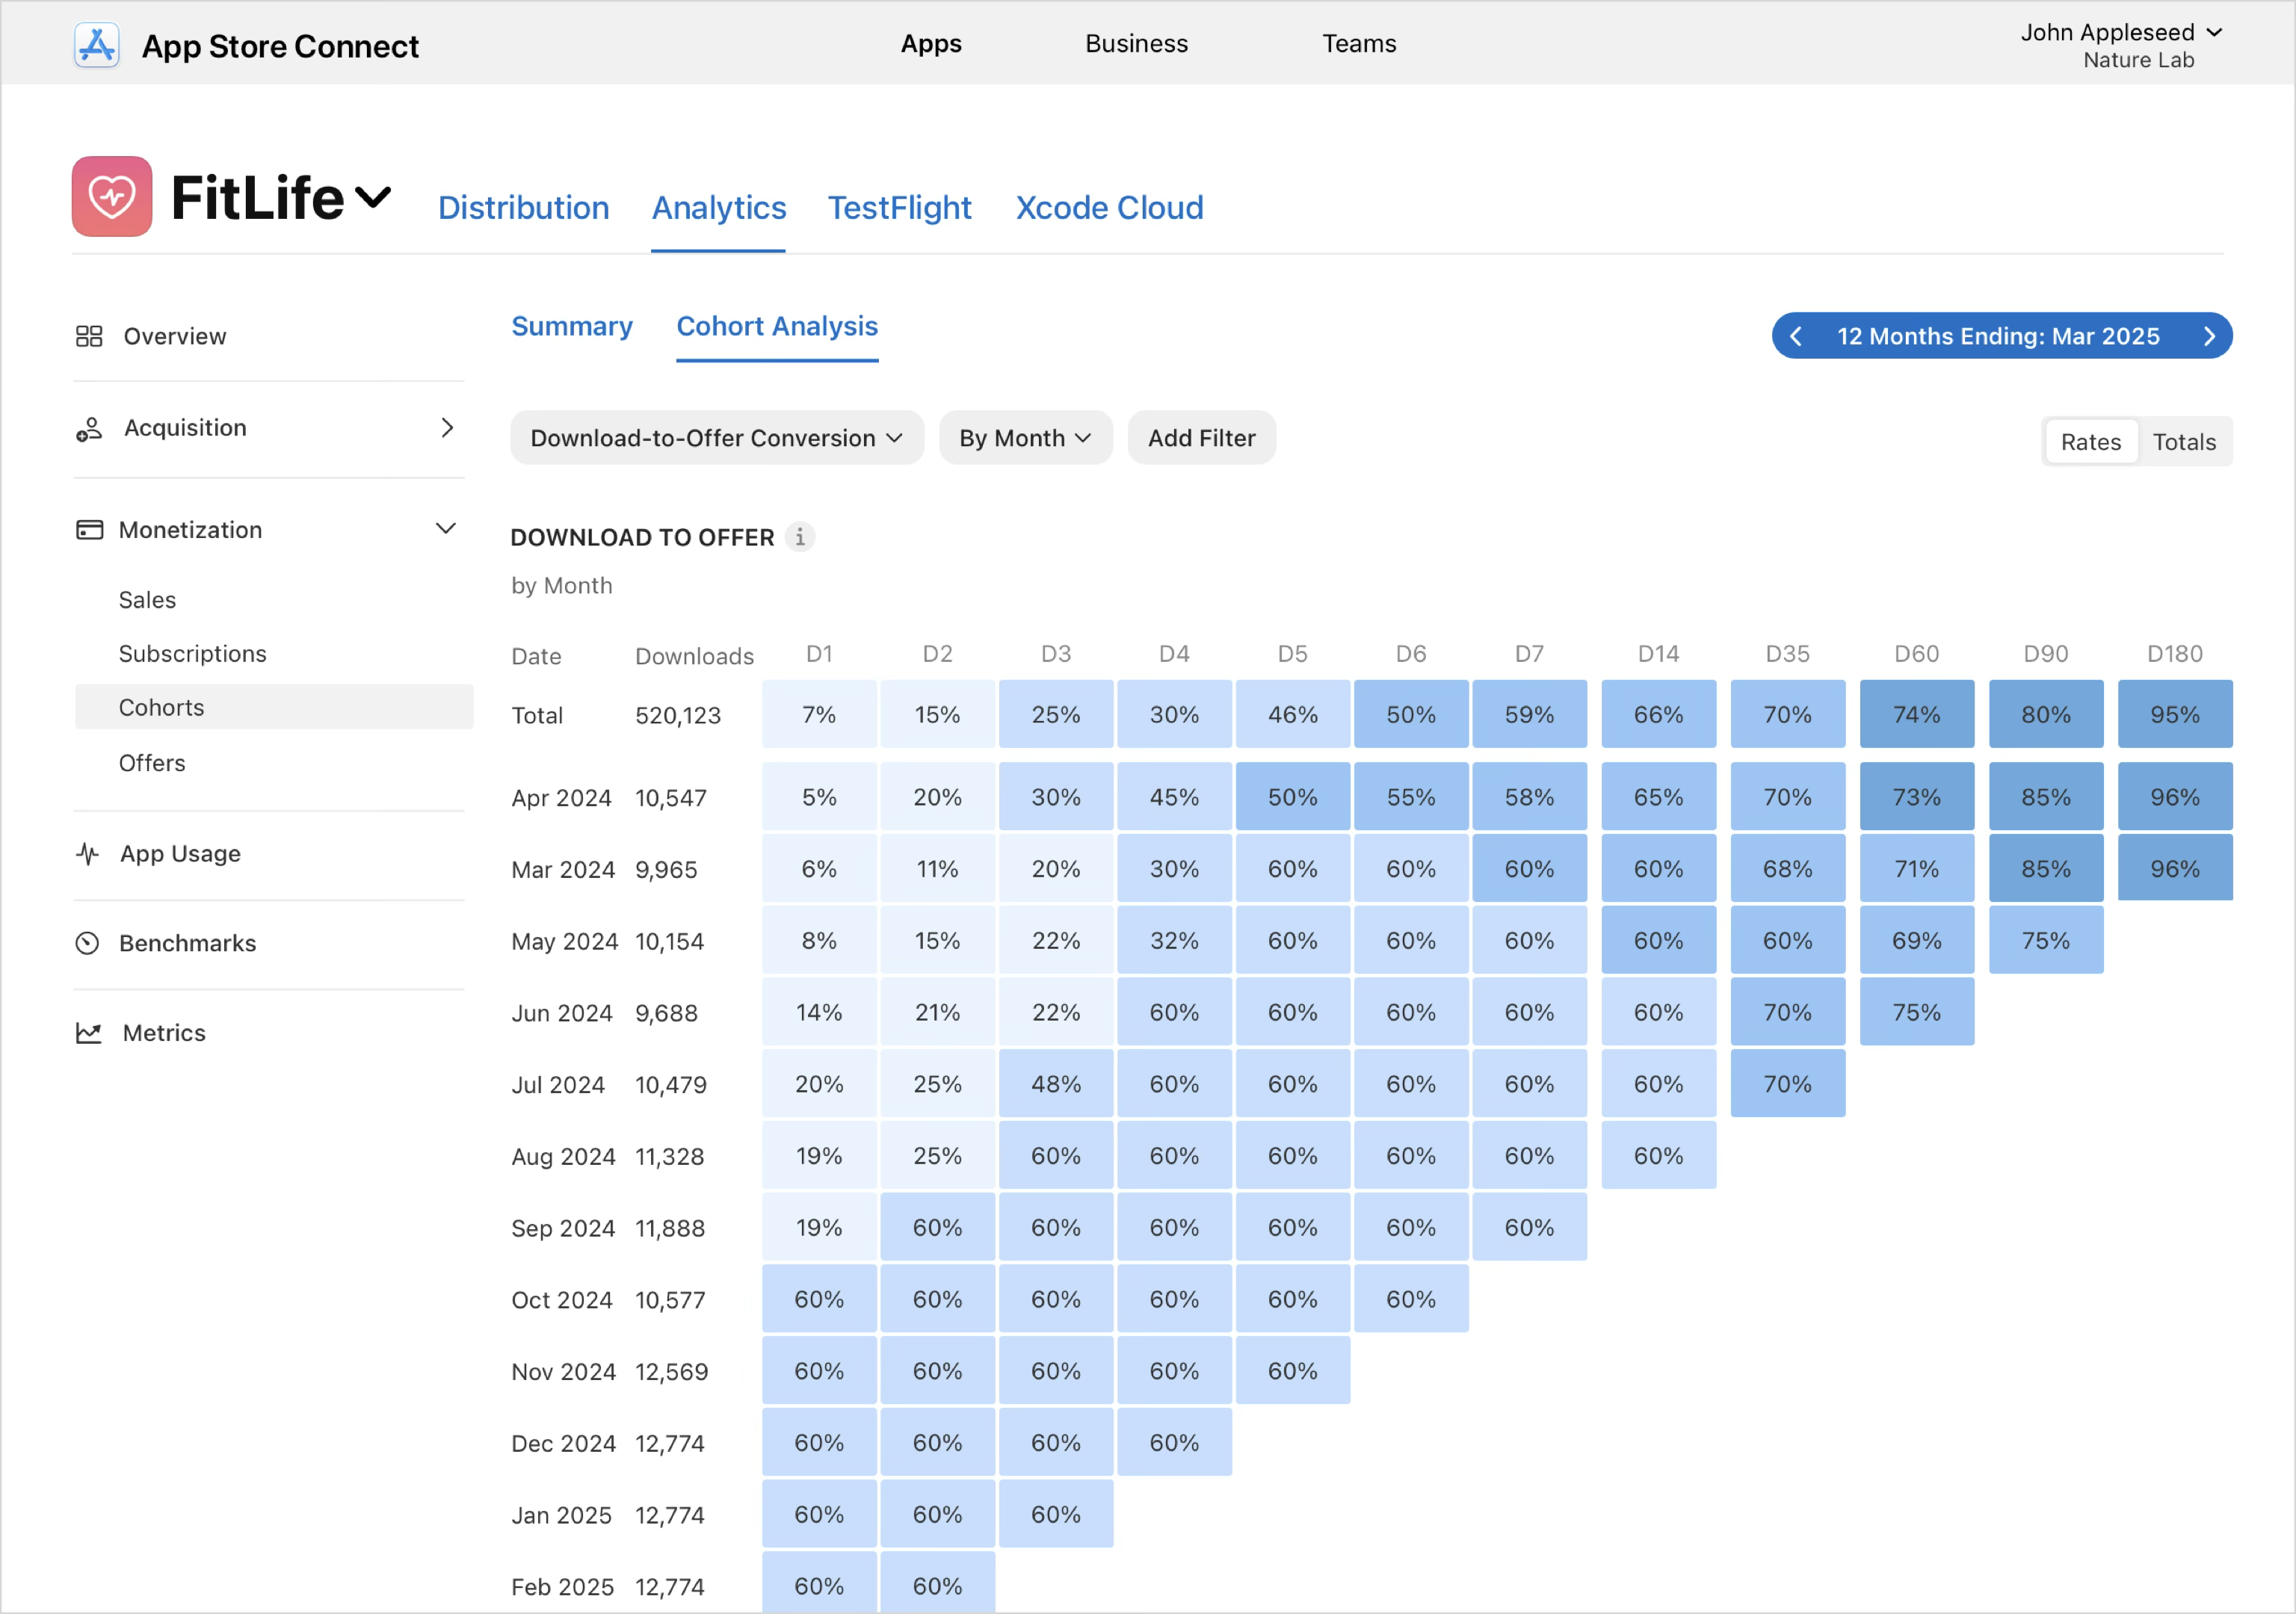
Download to Offer Conversion: The percentage of first-time downloads or redownloads that resulted in offer activations within a certain number of days of download.
-
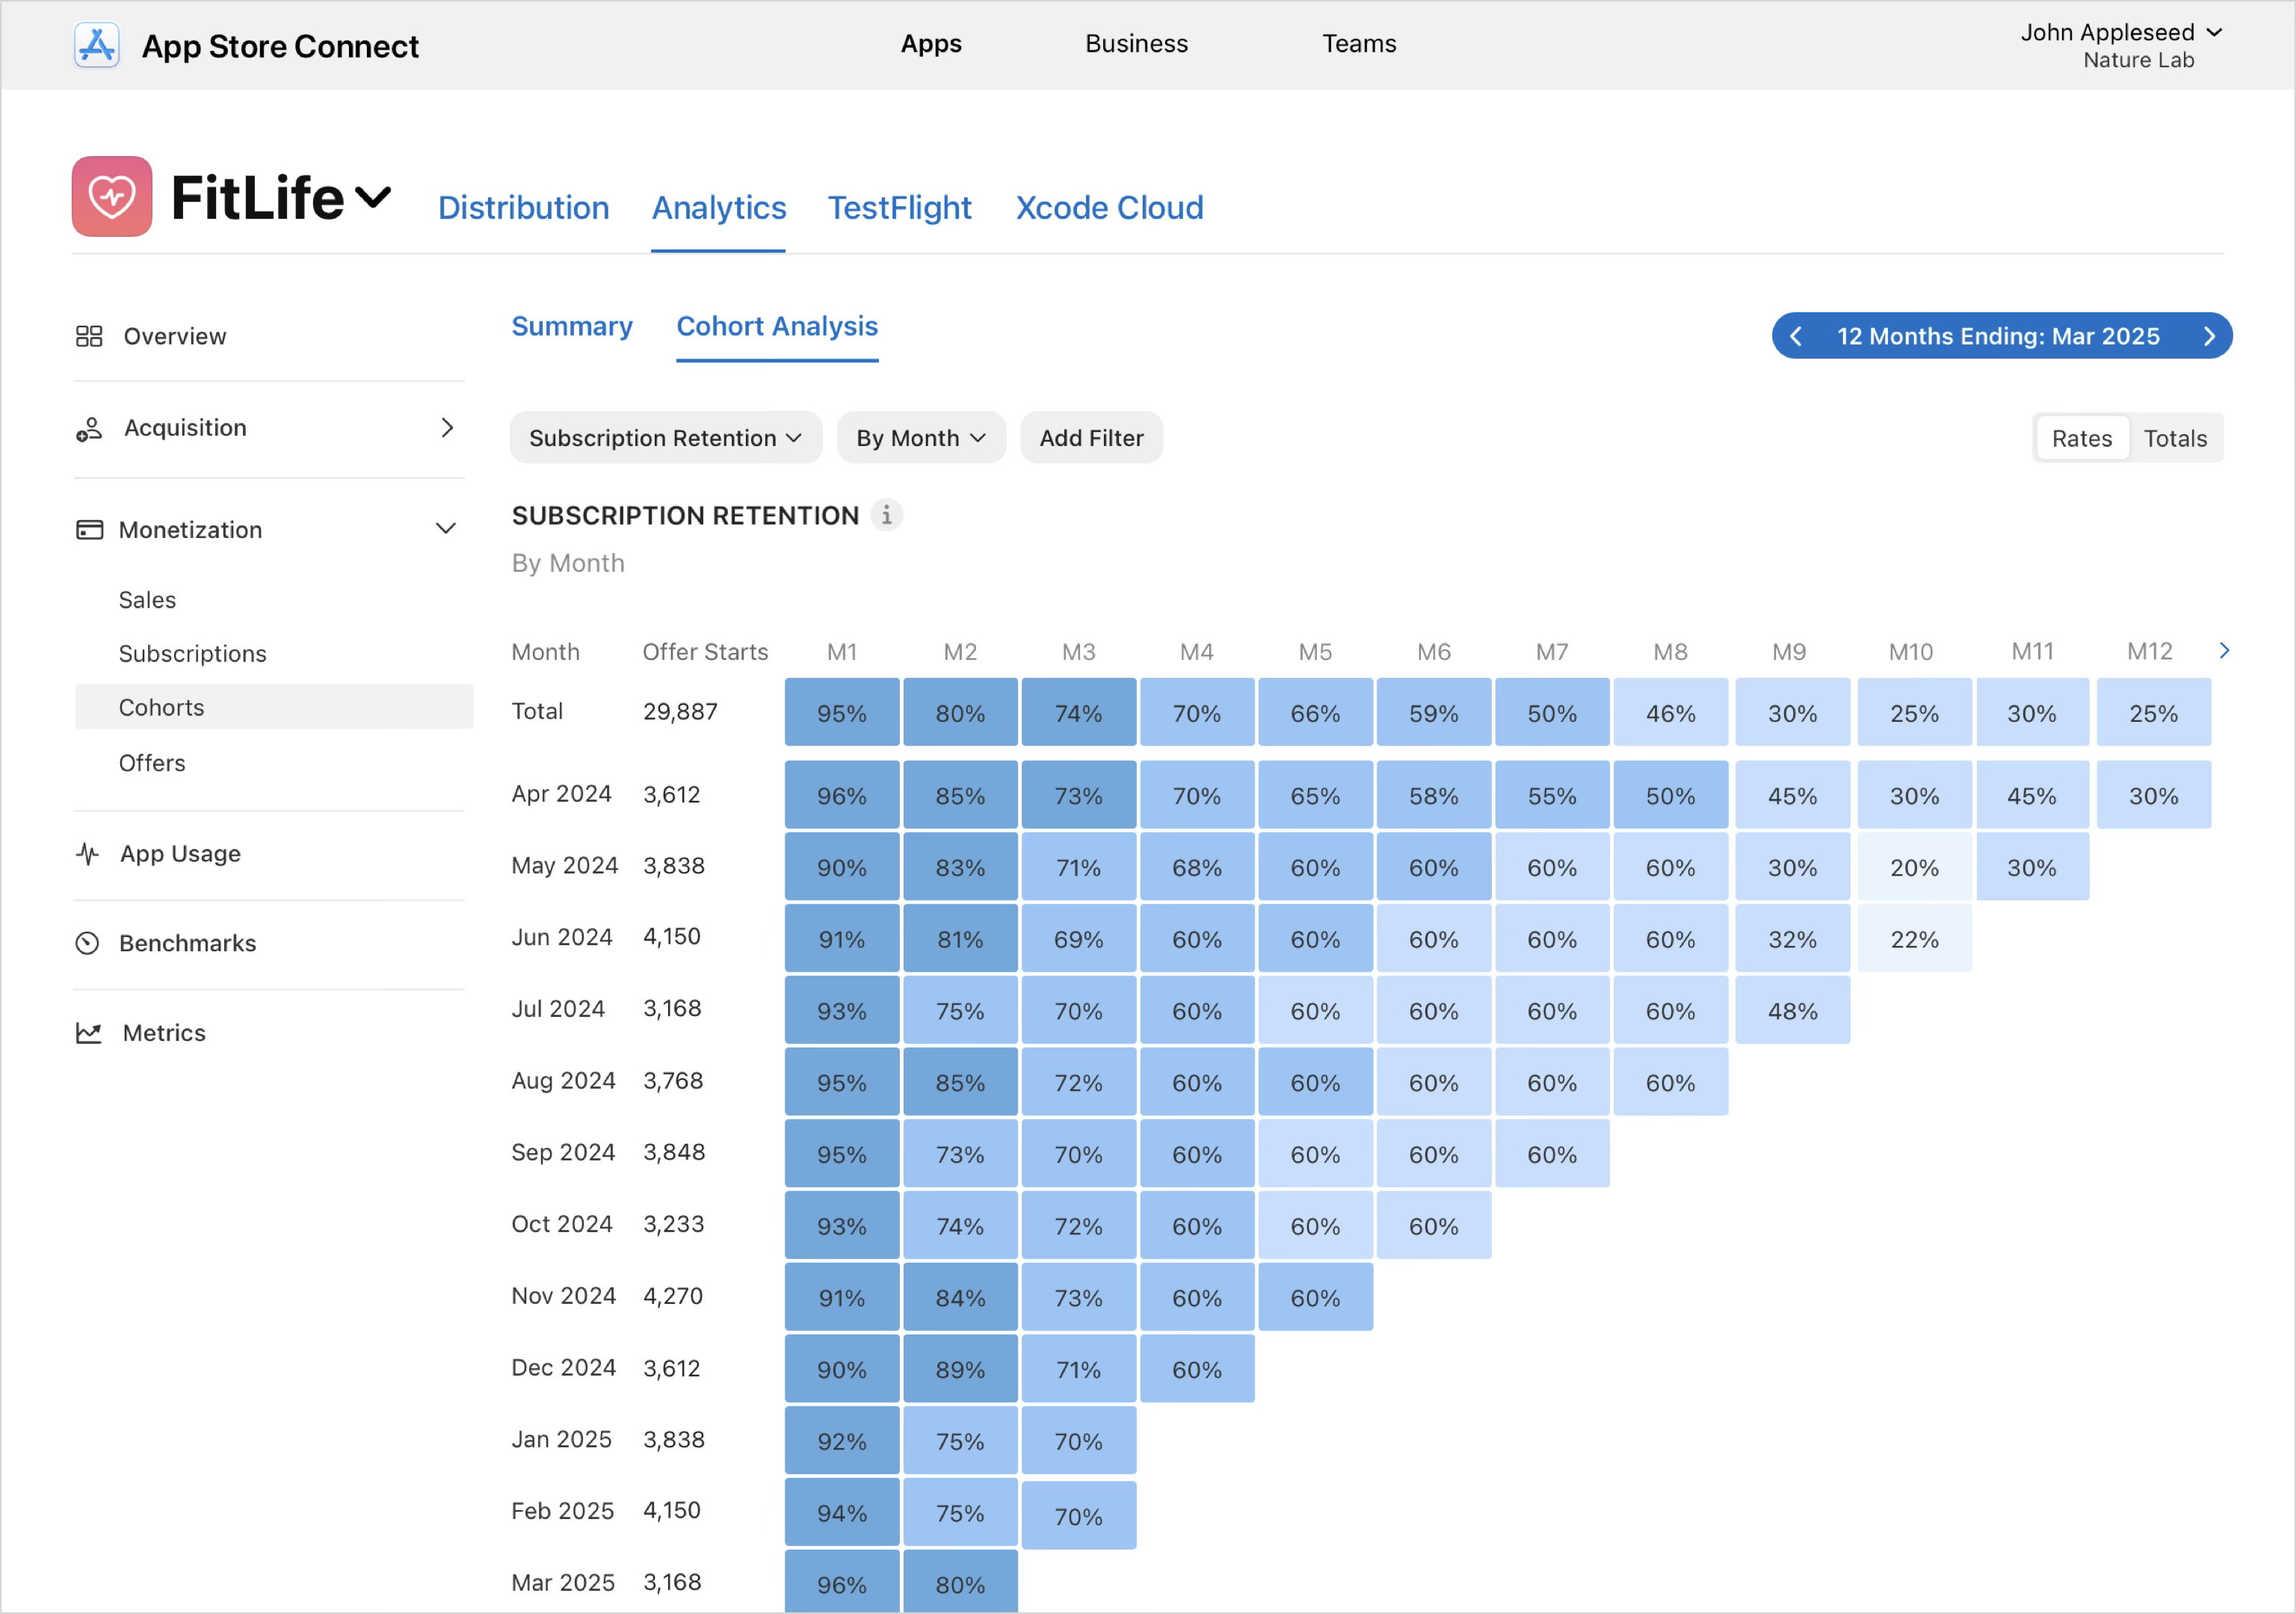
Subscription Retention: The percentage of subscriptions started on a given day or month, and remain paid subscriptions after a specified time period.
View cohort data
-
In Apps, select the app you want to view.
-
Click the Analytics tab.
-
In the sidebar under Monetization, click Cohorts.
-
Click Cohort Analysis.
-
Use the drop-down menus to select your desired metric. You can add additional filters to view the data by dimensions such as territory, device type, or source type. You can add up to 7 filters at a time.
Download to Paid
If you select the Download to Paid metric, each row represents a cohort of users who downloaded your app in the same month, and each column (D1, D2, D3, and so on) shows the percentage of that cohort that completed a paid transaction—such as starting a paid subscription or making an In-App Purchase—within a given number of days after download. This view helps you understand how effectively downloads convert into revenue over time, compare monetization performance across cohorts, and evaluate the impact of changes to onboarding, pricing, offers, or acquisition quality. Use filters like purchase type, subscription group, offer type, territory, or device to analyze specific segments, and switch between Ratesand Totals to view conversion performance as percentages or as absolute counts of paying users.
Proceeds per Download
If you select the Proceeds per Download metric, then each row represents a cohort of users who downloaded your app in the same month, and each column (D1, D2, D3, and so on) shows the average cumulative proceeds generated per download after that many days. This view helps you understand how quickly and how much value each cohort generates over time, compare monetization performance across cohorts, and evaluate the long-term revenue impact of changes to pricing, offers, or acquisition quality. Use filters such as subscription group, offer type, territory, or device to focus on specific segments, and switch between Rates and Totals to view proceeds as an average per download or as total accumulated revenue.

Download to Offer Conversion
If you select the Download to Offer metric, then each row represents a cohort of users who downloaded your app in the same month, and each column (D1, D2, D3, and so on) shows the percentage of that cohort that activated an offer within a given number of days after download. This view helps you understand how quickly new users convert to offers, compare conversion speed and effectiveness across cohorts, and evaluate the impact of changes such as onboarding improvements, offer configuration, or acquisition quality. Use filters like subscription group, offer type, territory, or device to analyze specific segments, and switch between Rates and Totals to view conversion performance as percentages or absolute counts.
Proceeds per Download
If you select the Proceeds per Download metric, then each row represents a cohort of users who downloaded your app in the same month, and each column (D1, D2, D3, and so on) shows the average cumulative proceeds generated per download after that many days. This view helps you understand how quickly and how much value each cohort generates over time, compare monetization performance across cohorts, and evaluate the long-term revenue impact of changes to pricing, offers, or acquisition quality. Use filters such as subscription group, offer type, territory, or device to focus on specific segments, and switch between Rates and Totals to view proceeds as an average per download or as total accumulated revenue.
Subscription Retention
If you select the subscription retention metric, then each row represents a cohort of subscriptions that started in the same month, and each column (M1, M2, M3, etc.) shows the percentage of that cohort that remains an active paid subscription after that many months. You can use this view to compare retention trends across cohorts, spot improvements or regressions over time, and understand how changes like new offers, pricing, or app updates affect long-term subscriber retention. Use filters such as subscription group, offer type, territory, or device to isolate specific segments, and switch between Rates and Totals to view retention as percentages or as absolute subscription counts.