App Store Connect Analytics Help
App Clips
App Clips provide quick access to a specific app feature without requiring a full download, offering a lightweight experience at the moment it is most useful. App Store Connect Analytics helps you measure App Clip discovery, usage, and engagement through metrics like card views, installations, sessions, active devices, and crashes. This data covers performance across invocation sources such as NFC tags, App Clip Codes, Safari, and Maps. You can segment results by source, device, and territory to measure success in driving new users, engagement, and full app downloads.
Analytics provides a dedicated section for App Clip performance. Here, you can analyze the user funnel:
-
Discovery: View App Clip Card Views and App Clip Card Views (Unique) to discover how many users are invoking your App Clip.
-
Acquisition: Measure App Clip Installations to learn how many users are installing your App Clip, and correl ate this with downloads of your full app. Filter this data by source to learn where users are discovering your App Clip.
-
Usage: Measure App Clip Sessions and App Clip Active Devices to understand how users are interacting with your App Clip.
-
Stability: Monitor App Clip Crashes to ensure a smooth user experience.
App Clip data is available from users who opt-in to share their data with app developers, and will begin appearing in Analytics one day after your App Clip goes live. Learn about configuring App Clips in App Store Connect.
To export App Clip data in bulk, use the Analytics reports in the App Store Analytics API.
View App Clip data
-
In Apps, select the app you want to view.
-
Click the Analytics tab.
-
In the Acquisition section, click App Clips.
-
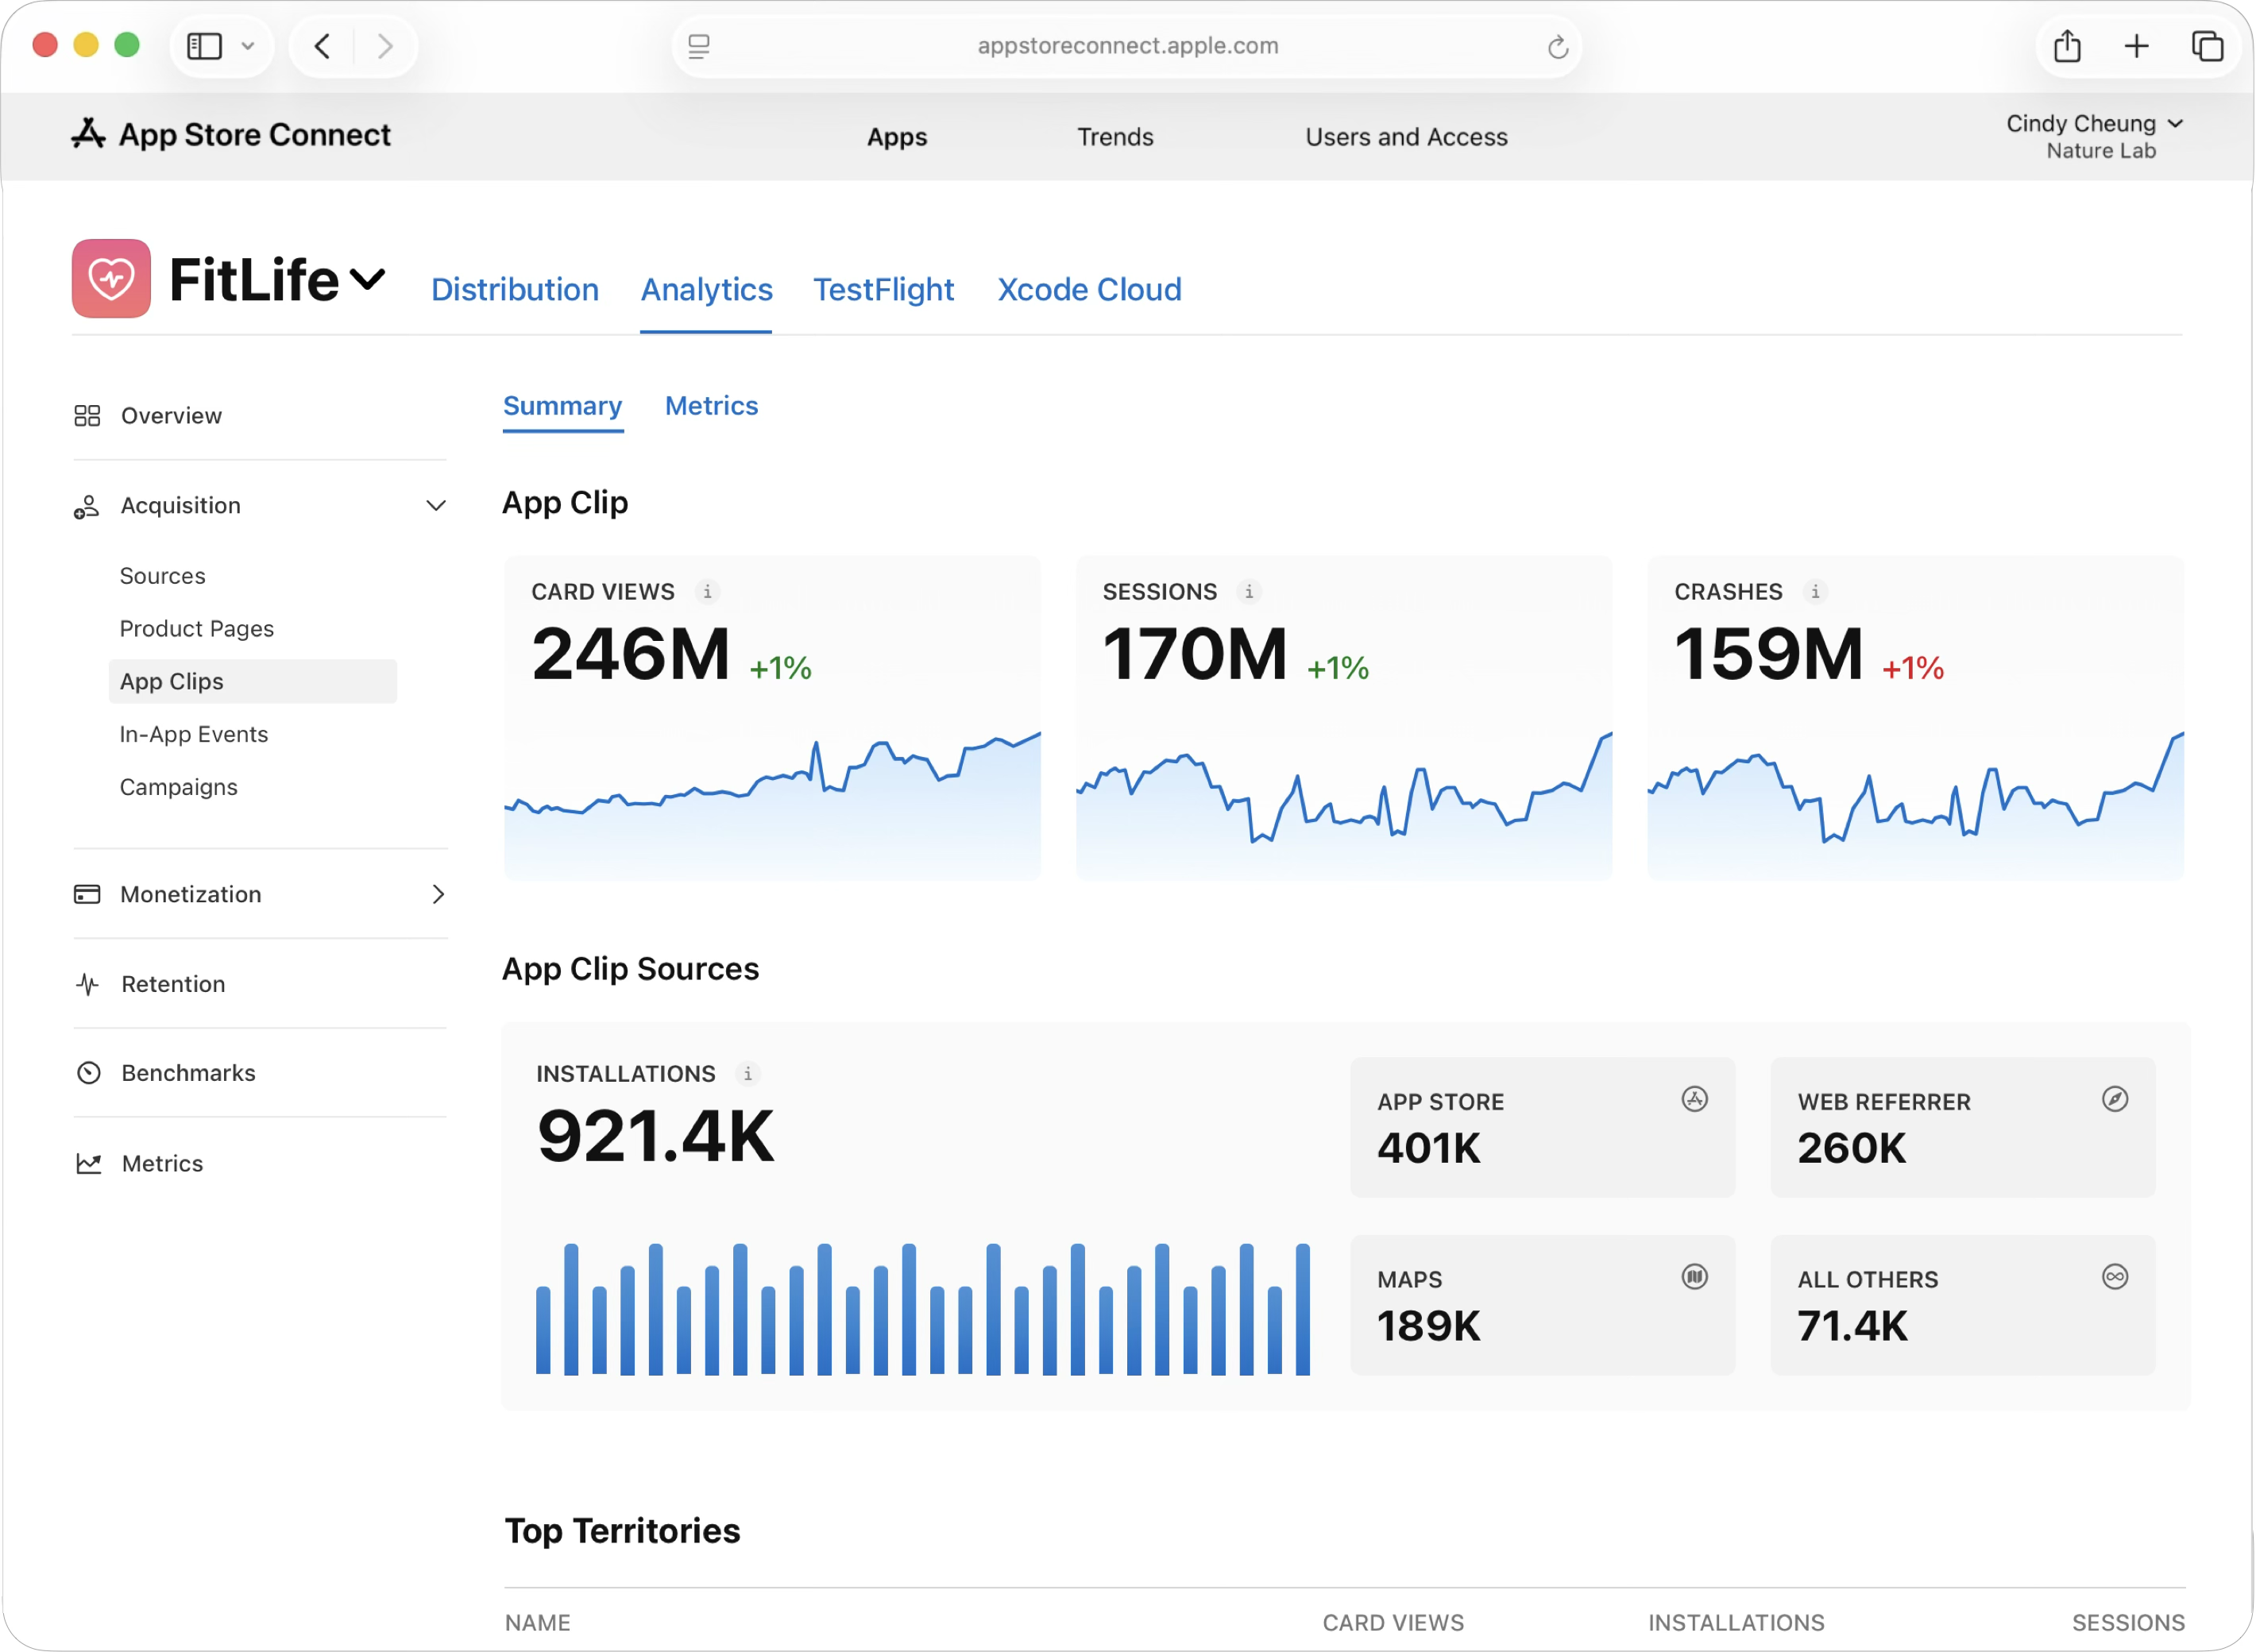
The App Clips dashboard displays key performance metrics like Card Views, Sessions, and Crashes. Below these, the App Clip Sources charts show installations by source.
-
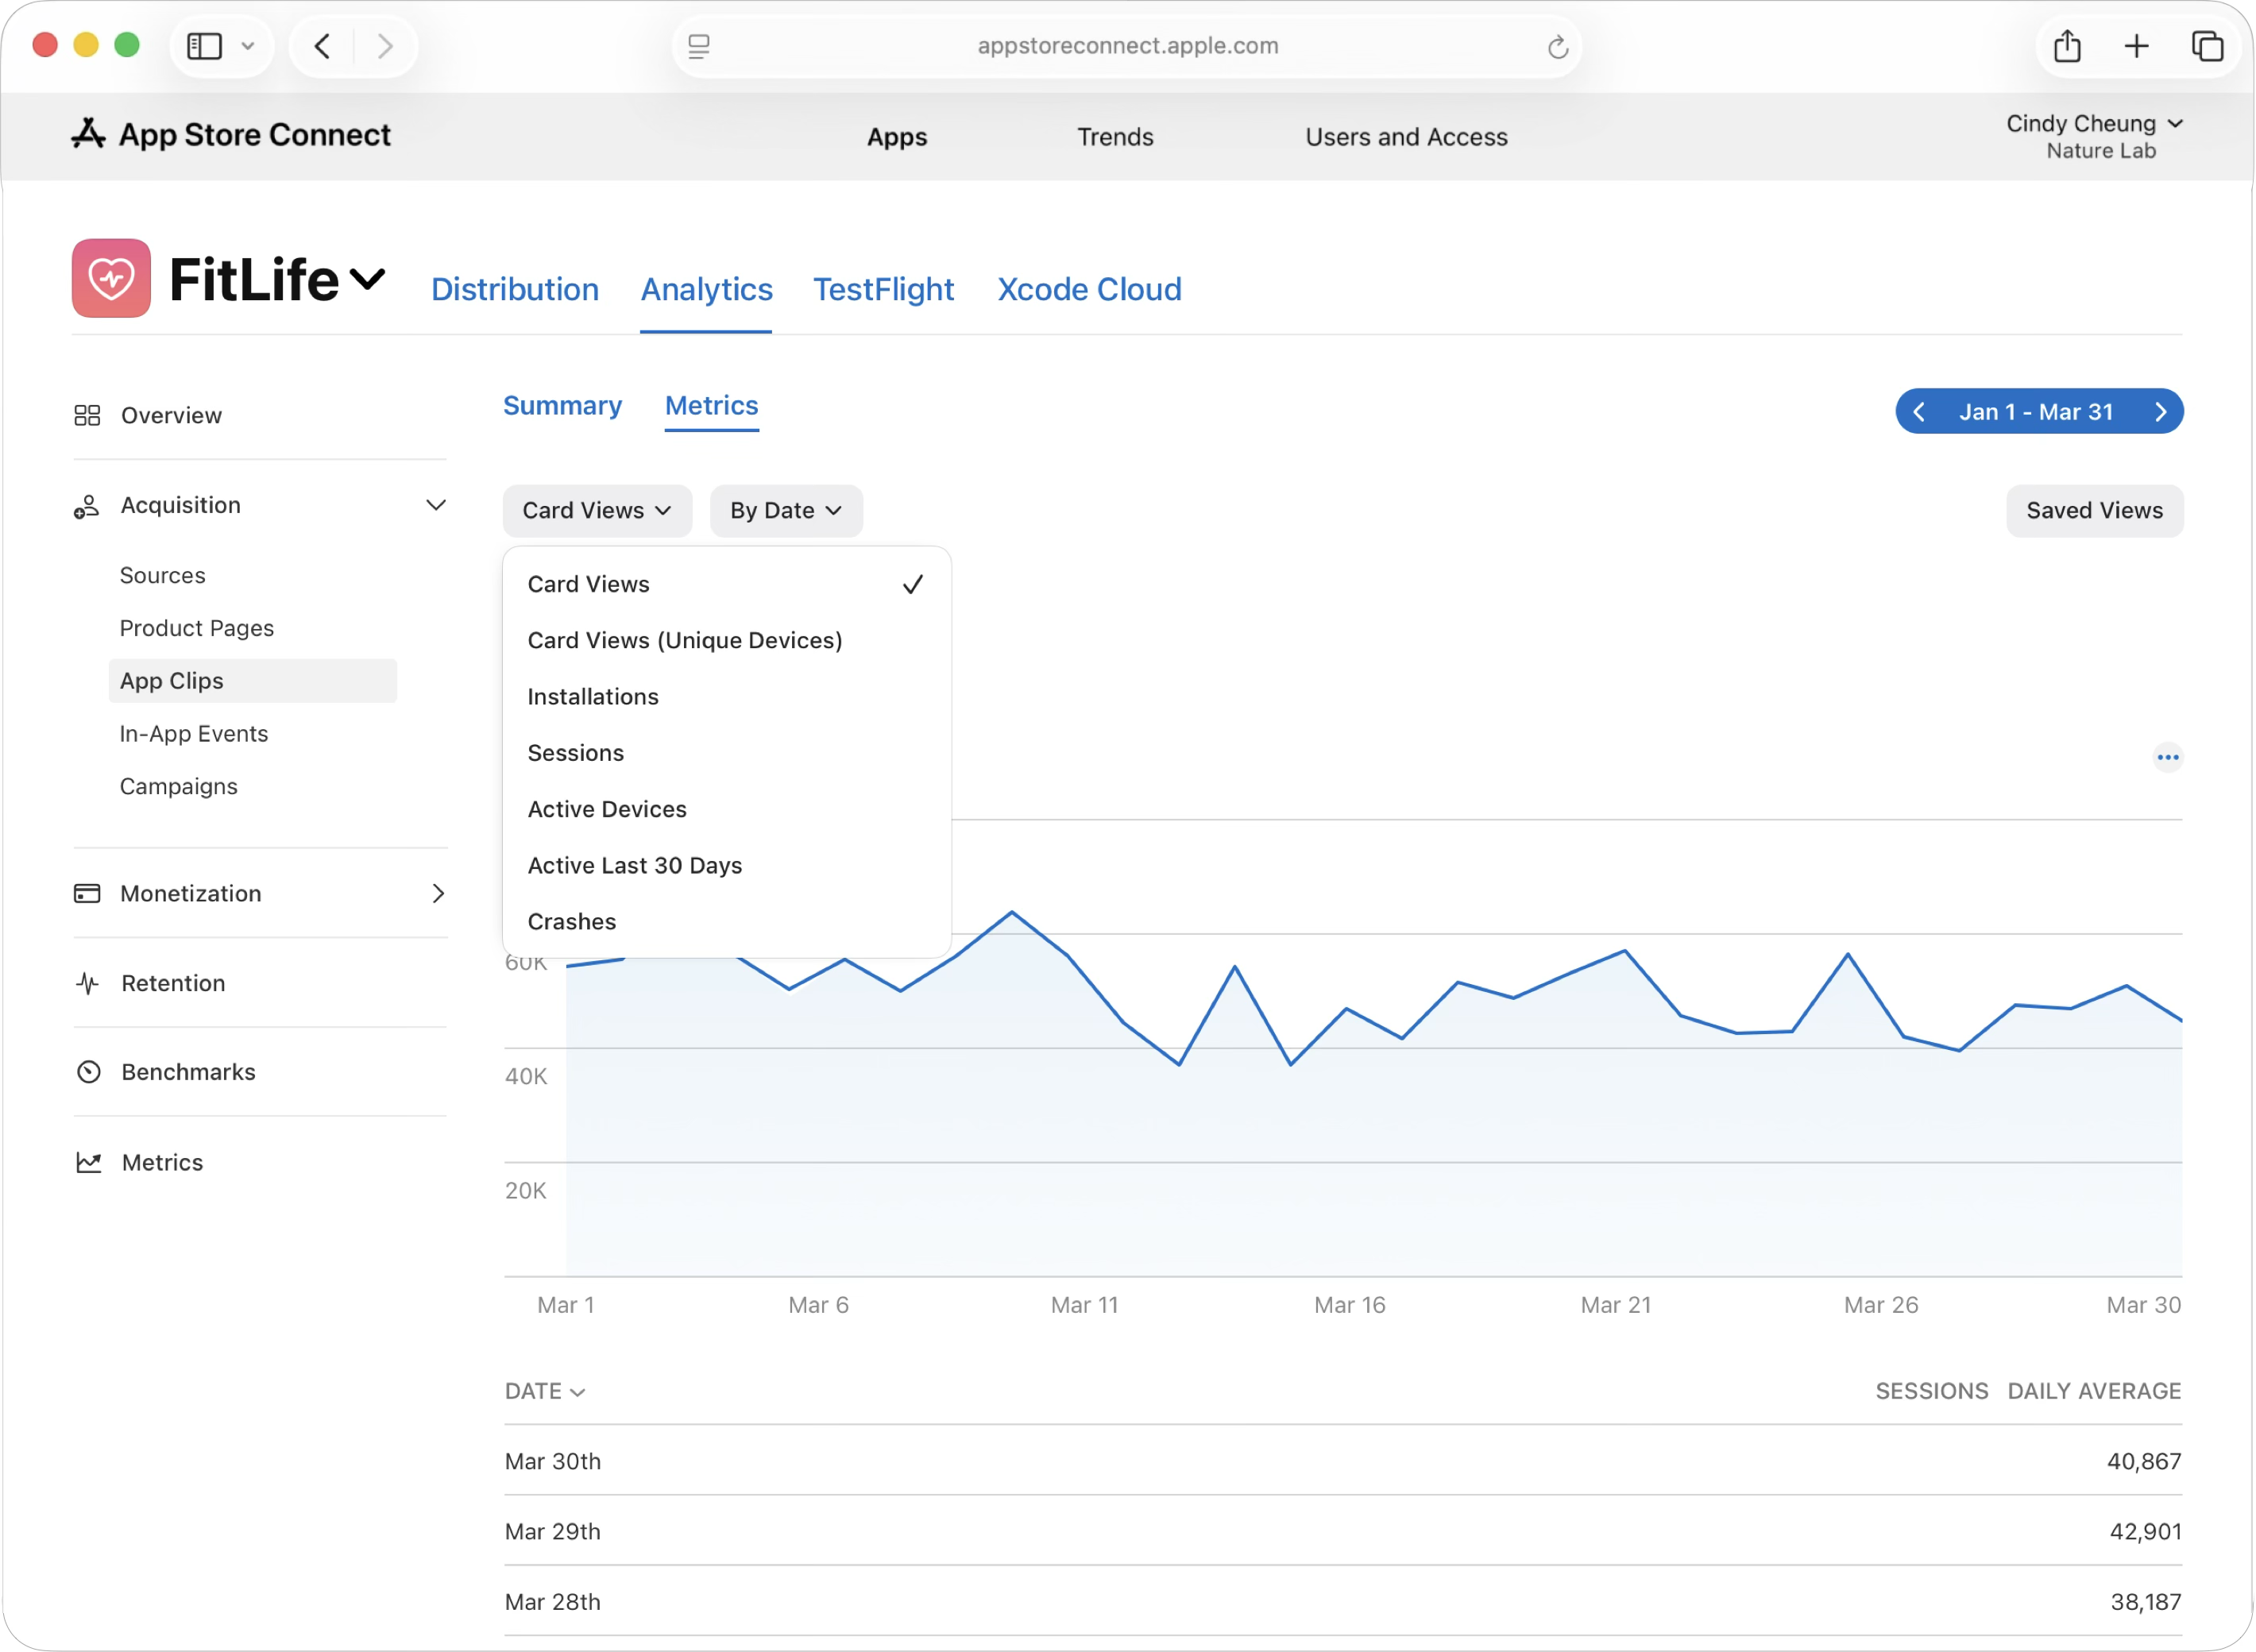
To view detailed metrics by day, click the Metrics tab. You can also adjust the date range, view your data by various dimensions, and add filters such as Territory and Device.
App Clip metrics
|
Metric |
Definition |
||||||||||
|---|---|---|---|---|---|---|---|---|---|---|---|
|
App Clip Card Views |
The number of times a card for this App Clip has been invoked by a device on iOS 14 or later. |
||||||||||
|
App Clip Card Views (Unique) |
The unique number of devices that invoked a card for this App Clip on iOS 14 or later. |
||||||||||
|
App Clip Installations |
The number of times an App Clip has been installed on a device. An App Clip Installation occurs when a user taps the Open button on an App Clip card. Once an App Clip is installed on a user’s device, it'll remain installed for a period of seven days. If the same user installs the app a second time after the seven-day period has ended, a second installation will be counted. |
||||||||||
|
App Clip Sessions |
The number of times the App Clip has been used for at least one second. |
||||||||||
|
App Clip Active Devices |
The unique number of devices with at least one App Clip session. |
||||||||||
|
App Clip Crashes |
The total number of times the App Clip has crashed. |
||||||||||
App Clip invocation sources
|
Source |
Definition |
||||||||||
|---|---|---|---|---|---|---|---|---|---|---|---|
|
Siri |
When Siri suggests your App Clip in response to a user and they tap the suggestion, your App Clip card is displayed. |
||||||||||
|
NFC Tags |
A user held their iPhone near an NFC tag that you placed at a specific location and your App Clip card was displayed. |
||||||||||
|
Maps |
A user tapped on a place card in Apple Maps, followed the link to your App Clip, and your App Clip card was displayed. |
||||||||||
|
Messages |
Your App Clip card was displayed after a user tapped a link they received through the Messages app. |
||||||||||
|
QR Code |
A user scanned a QR code with their device and your App Clip card was displayed. |
||||||||||
|
App Clip Code |
A user scanned an App Clip Code with their device and your App Clip card was displayed. |
||||||||||
|
Location Based |
Your App Clip card was displayed due to the user’s location settings. |
||||||||||
|
App Referrer |
Your App Clip card was displayed after a user tapped on a link in another app, such as the Notes app or Facebook. Safari, Maps, and Messages aren't included in app referrers. |
||||||||||
|
Web Referrer |
A user tapped an invocation URL or Smart App Banner in Safari, which invoked the App Clip card. A detailed breakdown of web referrers is not available. |
||||||||||
How are the metrics driven by Apple Ads (such as app downloads, product page views, and impressions) attributed in Analytics?
When a user searches for your app using keywords in the search tab of the App Store and your search results ad appears in the results, the metrics are included in Search totals. If a user doesn't enter any keywords in search, and your search results ad appears on the search page by default, the metrics are included in Browse totals. For a guided walkthrough of Apple Ads reporting, check out the "Maximize campaign results with insights" lesson in Apple Ads Certification.
Why is there a spike in downloads attributed to Institutional Purchases in my Analytics data?
When your app is public, it'll be publicly available on the App Store in the countries or regions you selected and available to anyone for volume purchase through Apple Business Manager or Apple School Manager. Volume purchases generally result in large spikes of downloads because content is purchased in bulk and directly assigned to devices or accounts within a business or educational institution.
Review the Promo Code field in the Sales and Trends Summary Sales Report to confirm if a spike in downloads is due to a volume purchase for a business transaction through Apple Business Manager or volume purchase for an education transaction through Apple School Manager. Learn more about purchasing content in Apple Business Manager and Apple School Manager.